. 2014 Nov 20:5:5530.
doi: 10.1038/ncomms6530.

Vesicles derived via AP-3-dependent recycling contribute to asynchronous release and influence information transfer

Affiliations

Vesicles derived via AP-3-dependent recycling contribute to asynchronous release and influence information transfer

Alesya Evstratova et al. Nat Commun. .

Abstract

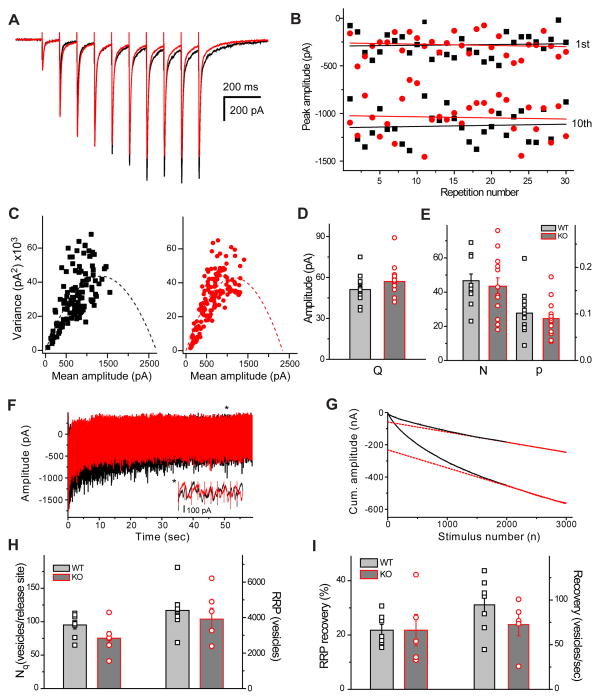
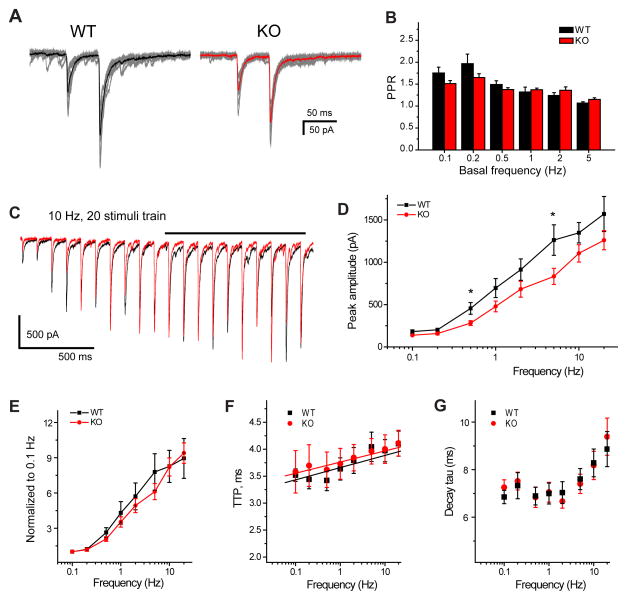
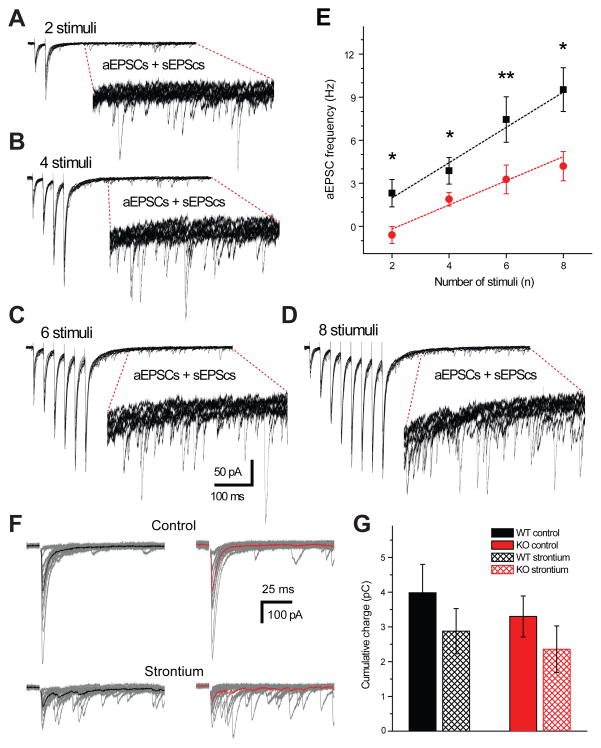
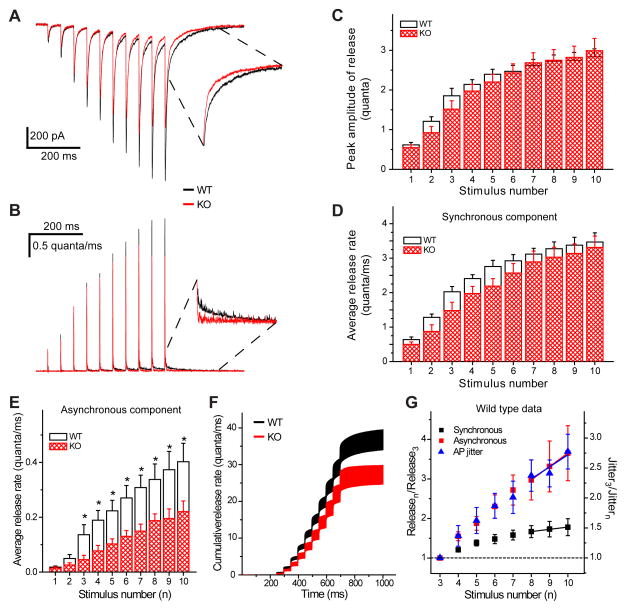
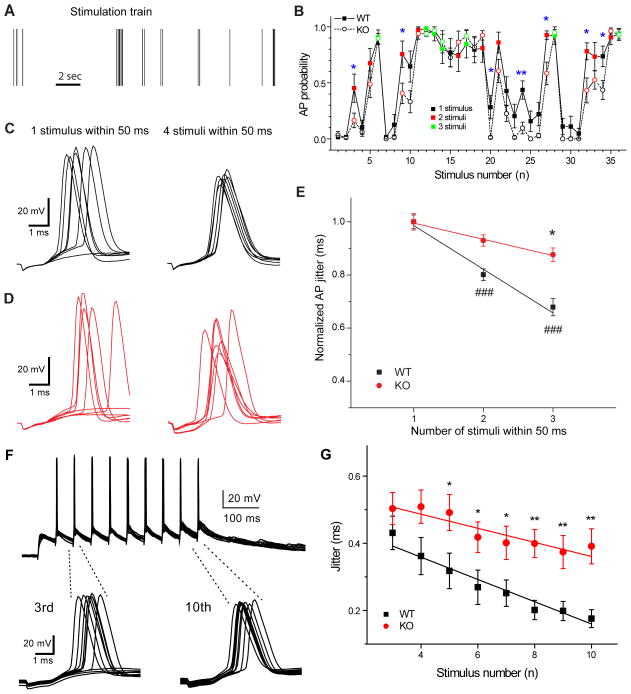
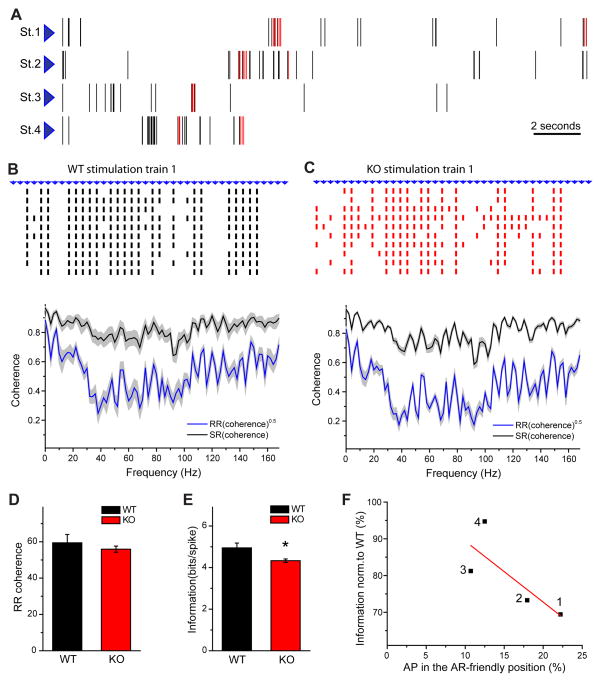
Action potentials trigger synchronous and asynchronous neurotransmitter release. Temporal properties of both types of release could be altered in an activity-dependent manner. While the effects of activity-dependent changes in synchronous release on postsynaptic signal integration have been studied, the contribution of asynchronous release to information transfer during natural stimulus patterns is unknown. Here we find that during trains of stimulations, asynchronous release contributes to the precision of action potential firing. Our data show that this form of release is selectively diminished in AP-3b2 KO animals, which lack functional neuronal AP-3, an adaptor protein regulating vesicle formation from endosomes generated during bulk endocytosis. We find that in the absence of neuronal AP-3, asynchronous release is attenuated and the activity-dependent increase in the precision of action potential timing is compromised. Lack of asynchronous release decreases the capacity of synaptic information transfer and renders synaptic communication less reliable in response to natural stimulus patterns.


Conflict of interest statement

Competing financial interests:

The authors declare no competing financial interests.

Figures

Figure 1
Figure 1
Temporal precision of postsynaptic action potentials enhanced after natural short burst stimulation. A) Example of natural stimulation train and corresponding probability of evoked postsynaptic action potentials (B). Blue boxes indicate position of individual stimulus (1) and last stimulus in a 50 ms burst of three stimuli (3). Examples of postsynaptic spikes evoked by these stimuli are shown on C (ten traces included). Note the difference in the action potential jitter between single stimulation (1 stimulus within 50 ms, left) and stimulation after two preceding stimuli (3 stimuli within 50 ms, right). D) Action potential probability, delay (E) and jitter (F) as a function of the number of stimuli within 50 ms. Note that action potential probability significantly increases with the number of stimuli, while spike delay and jitter become significantly smaller after burst stimulation (2–4 stimuli, n=18). Error bars show standard error of the mean (SEM). ***p < 0.001, Student’s t-test.
Figure 2
Figure 2
Slow calcium chelator EGTA-AM blocks the asynchronous response and prevents spike dejittering. A) EPSCs evoked by stimulation trains (20 Hz, 10 stimuli) in control conditions (black) and after application of 100 μM EGTA-AM (red), five individual responses are shown. Inserts show expanded 500 ms regions with a mixture of aEPSCs and sEPSCs. B) Bar graph showing significant reduction in aEPSC frequency and cumulative transferred charge after EGTA-AM application. Examples of postsynaptic spikes evoked by 10 stimuli at 20 Hz in control (black, C) and after EGTA-AM (red, D). Action potentials evoked by the third and tenth stimuli are expanded, 10 responses are shown. Note that action potential jitter calculated within 6 ms after stimulation significantly decreases at the end of the train (C, bottom right) in control conditions, but not after EGTA-AM (D, bottom right). E) Significant decrease is observed in action potential jitter starting from the 5th stimulus (#p < 0.05, ##p < 0.01, ###p< 0.001; Student’s t-test), which is abolished in the presence of EGTA-AM (n=7). Significantly larger jitter is present after EGTA-AM application compared to control (*p < 0.05, **p < 0.01, ***p < 0.001; Student’s t-test). F) AP jitter decreases most profoundly at the end of the stimulation train in control condition (black bars), reaching a threefold decrease by the 10th stimuli. EGTA-AM (red bars) significantly impairs jitter reduction, even though it does not change AP probability (black and red squares) in response to last three stimuli. Normalized EPSC peak amplitudes (G) and AP jitter (H) recorded at 2.5 (black) and 6 mM (red) CaCl2 in response to 20 Hz stimulation train. Note that facilitation is more than three times smaller at high calcium concentration (n=25 and n=7 for 2.5 and 6 mM CaCl2, respectively), but AP jitter decreases to the same degree (n=8 and n=7 for 2.5 and 6 mM CaCl2, respectively). Dashed lines correspond to linear fits of the data. Error bars show standard error of the mean (SEM).
Figure 3
Figure 3
Action potential jitter does not decrease during glutamate uncaging. A) Example of CA3 pyramidal neuron labeled with Alexa-594. The white box indicates the apical dendritic region expanded on A2. Points of glutamate uncaging are shown as white dots around the dendritic spine. B) Example of postsynaptic spikes evoked in this pyramidal cell by glutamate uncaging repeated at 20 Hz frequency. Action potentials evoked by the third and tenth stimuli are expanded, 9 responses are shown. C) Action potential jitter (calculated within a 8 ms window after uncaging) does not change during the train, in contrast to electrical stimulation (n=5). Red line corresponds to the linear fit of the data. Error bars show standard error of the mean (SEM).
Figure 4
Figure 4
Primary contribution of AP-3-derived vesicles to the asynchronous release. EPSCs recorded in response to 20 Hz stimulation trains (10 stimuli) in WT (A) and KO (B) mice. Ten individual responses are shown in grey, averaged evoked EPSCs in black (WT) and red (KO) are compared on the middle panel (2). Expanded regions show spontaneous (sEPSCs, left) and asynchronous (aEPSCs, right) events analysed within 500 ms before stimulation (1) and 200 ms after stimulation (black line, 3), respectively. C) Frequency of aEPSCs in comparison with total EPSC (aEPSCs + sEPSCs) and sEPSC frequencies. Note a significantly higher aEPSC frequency in WT mice compared to KO and similar sEPSCs frequency. In both cases sEPSC frequency was significantly lower than the total EPSC frequency after stimulation (*p < 0.05, **p < 0.01, ***p < 0.001, ###p < 0.001; Student’s t-test). D) Normalized potentiation of the synchronous component (eEPSCs) is similar between WTs and KOs, while the cumulative charge evoked by stimuli from 2 to 10 is significantly smaller in KOs (E). F) Bar graph shows that the fast decay component (tau1) of EPSCs evoked by the10th stimuli is not different in WTs and KOs. In contrast, the slow decay component (tau2) and the total cumulative charge are significantly higher in WTs, due to the larger number of asynchronous EPSCs (WT n=27, KO n=33). Error bars show standard error of the mean (SEM).
Figure 5
Figure 5
Quantal parameters of synchronous release and the releasable vesicle pool size are not affected in AP-3 KO animals. A) Averaged eEPSCs recorded during stimulation trains (10 Hz, 10 stimuli) in ACSF containing 4mM [Ca2+]. B) Peak amplitudes of the 1st and 10th eEPSCs in a train are plotted against repetition number and fitted with linear fit, solid black (WT) and red (KO) lines in order to exclude the involvement of long-term plastic changes. C) Pooled variance-mean plots, parabolic fits are shown as dashed lines (WT -black, n = 13 and KO - red, n = 15). D) Comparison of calculated quantal size Q in WTs, n=13 and KOs, n=15). E) Number of release sites (N) and initial release probability (p) calculated from parabolic fits (WT n=12, KO n=13). Data for individual cells are shown as black squares (WT) and red circles (KO). None of the parameters are significantly different. F) eEPSCs amplitude during stimulation train (50 Hz, 3000 stimuli), black and response to the same stimulation 10 seconds later, red. Note a smaller amplitude of the response to the second train. Inset shows expanded response at the end of the train after vesicle depletion. Corresponding cumulative amplitudes are shown on G. Dashed lines represent back extrapolated linear fits obtained from last 1000 stimuli (solid red). WT data are shown. H and I) Comparison of the number of vesicles per release site (Nq, WT n=8, KO n=6), size of ready releasable pool of vesicles (RRP), percentage and speed of RRP recovery after 10 seconds (WT n=9, KO n=6). The data for individual cells are shown as black squares (WT) and red circles (KO). Error bars show standard error of the mean (SEM).
Figure 6
Figure 6
Short-term plasticity is not altered by AP-3 deletion. A) EPSCs evoked using paired pulse stimulation protocol. Individual responses are shown in grey; black and red traces correspond to the averaged responses for WT and KO, respectively. B) Paired pulse ratio calculated at different basal frequencies (paired pulse was given at 20 Hz). C) Example of averaged responses for WTs (black) and KOs (red) evoked by 10 Hz stimulation train. Peak amplitude and kinetic properties were measured after potentiation reached plateau (last 10 EPSCs, solid black line). Graphs are depicting the correlation between averaged peak amplitude (D), normalized peak amplitude (E), TTP (F), decay time constant (G) and the stimulation frequency. The level of short-term plasticity in KO (n=9, red) animals compared to WTs (n=7, black) is similar (except for the 0.5 and 5 Hz before normalization, D). At all tested frequencies TTP and decay time constant are not significantly different. Solid lines correspond to the linear fits (F). *p < 0.05; Student’s t-test. Error bars show standard error of the mean (SEM).
Figure 7
Figure 7
Asynchronous release increases with the number of stimuli and impaired in AP-3 KOs. aEPSCs after, 2 (A), 4 (B), 6 (C) and 8 (D) stimuli delivered at 20 Hz, 15 sweeps are shown. Inserts show expanded 500 ms regions with a mixture of aEPSCs and sEPSCs. E) Average data showing increase in the aEPSCs frequency with the number of stimuli. This increase was significantly smaller in KOs (n=7) compare to WTs (n=7). Dashed lines correspond to the linear fits. F) eEPSCs recorded at 0.5 Hz frequency in control conditions (top) and in the presence of 6 mM strontium (bottom) in WT (left) and KO (right) mice. Fifteen individual traces are shown in grey, averaged eEPSCs are shown in black and red, respectively (F). G) Bar graph showing that total cumulative charge is not significantly different between WTs (n=7) and KOs (n=6) in control conditions (p=0.53) and after strontium application (p=0.59). *p < 0.05, **p < 0.01; Student’s t-test. Error bars show standard error of the mean (SEM).
Figure 8
Figure 8
Deconvolution analysis of evoked EPSCs. A) Averaged EPSCs evoked by stimulation trains (20 Hz, 10 stimuli) and the corresponding release rate (B) are calculated using the deconvolution method. Inserts are showing expanded regions; note the difference in decay between WTs and KOs. C) Quantified release rate: The peak amplitude of release (C) and synchronous rate (integrated within the first 10 ms following each stimulus) (D) are similar in response to all 10 stimuli. Asynchronous rate of release (integrated between 10 and 50 ms after each stimulus) (E) is significantly higher in WTs, starting from the third response. Reduced asynchronous release significantly affects the total cumulative release (F). WT n=7, KO n=6. G) Deconvolution data shown together with AP jitter from separate sets of cells. Note that by the end of train the synchronous release (black) increase reaches a plateau; while increases in asynchronous release (red) and AP jitter (blue) continue to rise. Data are normalized to the 3rdresponse. Solid lines correspond to linear fits. *p < 0.05; Student’s t-test. Error bars show standard error of the mean (SEM).
Figure 9
Figure 9
Action potential dejittering is impaired in AP-3b2 KO mice. A) Example of a natural stimulation train and the corresponding probability of evoked postsynaptic action potentials (B). Responses to small number of stimuli were different in WTs and KOs (5 out of 36). Examples of evoked postsynaptic spikes recorded in WTs (C) and KOs (D), seven responses are shown. Note that the difference in action potential jitter between single stimulation (1 stimulus within 50 ms, left) and burst stimulation (3 stimuli within 50 ms, right) is not present in KOs. E) Plot showing normalized action potential jitter as a function of the number of stimuli within 50 ms in WTs (black, n=18) and KOs (red, n=19). In contrast to WTs, action potential jitter does not change with the frequency of the presynaptic stimulus in KOs and is significantly larger after short burst stimulation. Dashed lines indicate example of corresponding stimulus number in B, stimuli were grouped into categories 1 and 3, respectively. F) Example of postsynaptic APs evoked by 10 stimuli at 20 Hz in KO mice. APs evoked by the third and tenth stimuli are expanded, ten responses are shown. Note similar AP jitter at the beginning and end of the train. G) Average plot showing that AP jitter calculated within 6 ms after stimulation is significantly larger in KOs (n=13) compared to WTs (n=7), and does not decrease significantly during train stimulation. *p < 0.05, **p < 0.01, ###p < 0.001; Student’s t-test. Error bars show standard error of the mean (SEM).
Figure 10
Figure 10
Impaired information transfer during natural-like stimulation patterns due to reduced asynchronous release. A) Four stimulation trains used in the experiments. Action potentials occurring under conditions when asynchronous release can be evoked are highlighted in red (22%, 18%, 12.5% and 11% of total stimulus number for stimulation trains 1, 2, 3 and 4 respectively). B) An example of postsynaptic responses (action potentials) evoked by the first stimulation train (St. 1; A) in WT (B, top) and KO (C, top) cells. Data is presented in binary format, 10 consecutive trials are shown. Averaged square rooted RR coherence and SR coherence calculated for responses to the St. 1 in WTs (B, bottom n=8) and KOs (C, bottom n=10). Integrated from 0 to 168 Hz RR coherence (D) and transferred information per spike (E). Information in response to the first stimulation train is significantly smaller in KOs, while coherence is similar. F) Difference in the total transferred information between WTs and KOs dependent on the percentage of action potentials occurring in asynchronous release friendly positions (see text for definition). Four points correspond to four different stimulation trains. Solid line corresponds to linear fit of the data. Total 19 WT neurons and 25 KO neurons were stimulated with 1 – 3 different stimulation patterns. *p < 0.05; Student’s t-test. Error bars show standard error of the mean (SEM).

Similar articles

Cited by

References

    1. Galarreta M, Hestrin S. Spike transmission and synchrony detection in networks of GABAergic interneurons. Science. 2001;292:2295–2299. - PubMed
    1. Harsch A, Robinson HP. Postsynaptic variability of firing in rat cortical neurons: the roles of input synchronization and synaptic NMDA receptor conductance. J Neurosci. 2000;20:6181–6192. - PMC - PubMed
    1. Cottrell JR, et al. Working Memory Impairment in Calcineurin Knock-out Mice Is Associated with Alterations in Synaptic Vesicle Cycling and Disruption of High-Frequency Synaptic and Network Activity in Prefrontal Cortex. J Neurosci. 2013;33:10938–10949. - PMC - PubMed
    1. Glyvuk N, et al. AP-1/sigma1B-adaptin mediates endosomal synaptic vesicle recycling, learning and memory. EMBO J. 2010;29:1318–1330. - PMC - PubMed
    1. Fatt P, Katz B. Spontaneous subthreshold activity at motor nerve endings. J Physiol. 1952;117:109–128. - PMC - PubMed

Publication types

Substances