. 2016 Jan;65(1):19-32.
doi: 10.1136/gutjnl-2014-307918. Epub 2014 Nov 19.

HNF4α is a therapeutic target that links AMPK to WNT signalling in early-stage gastric cancer

Affiliations

HNF4α is a therapeutic target that links AMPK to WNT signalling in early-stage gastric cancer

Hae Ryung Chang et al. Gut. 2016 Jan.

Abstract

Background: Worldwide, gastric cancer (GC) is the fourth most common malignancy and the most common cancer in East Asia. Development of targeted therapies for this disease has focused on a few known oncogenes but has had limited effects.

Objective: To determine oncogenic mechanisms and novel therapeutic targets specific for GC by identifying commonly dysregulated genes from the tumours of both Asian-Pacific and Caucasian patients.

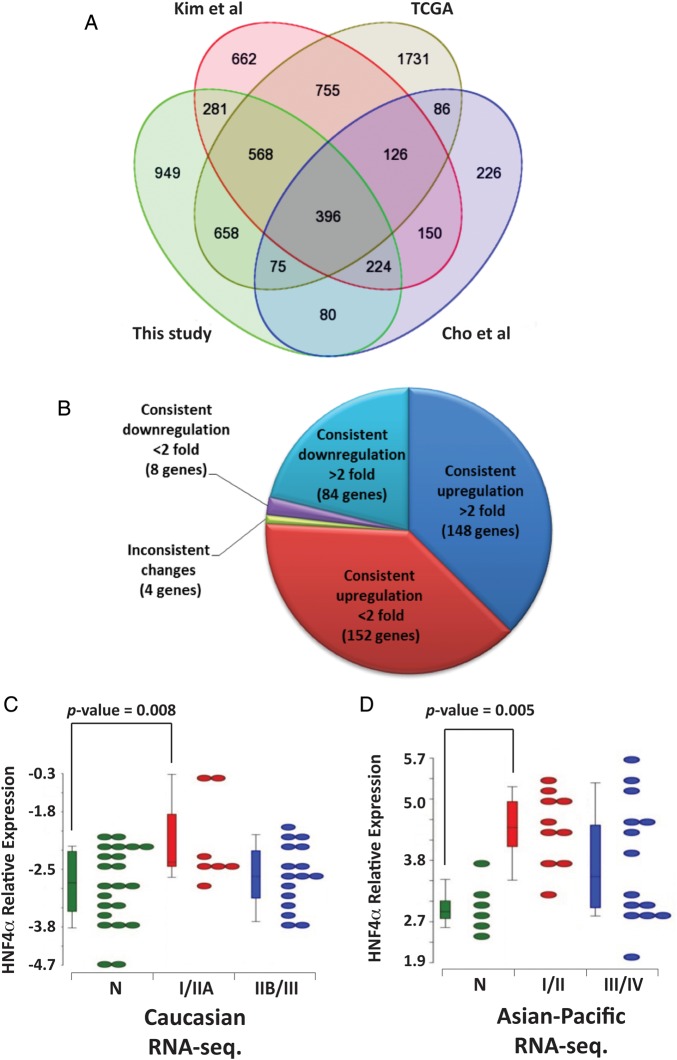
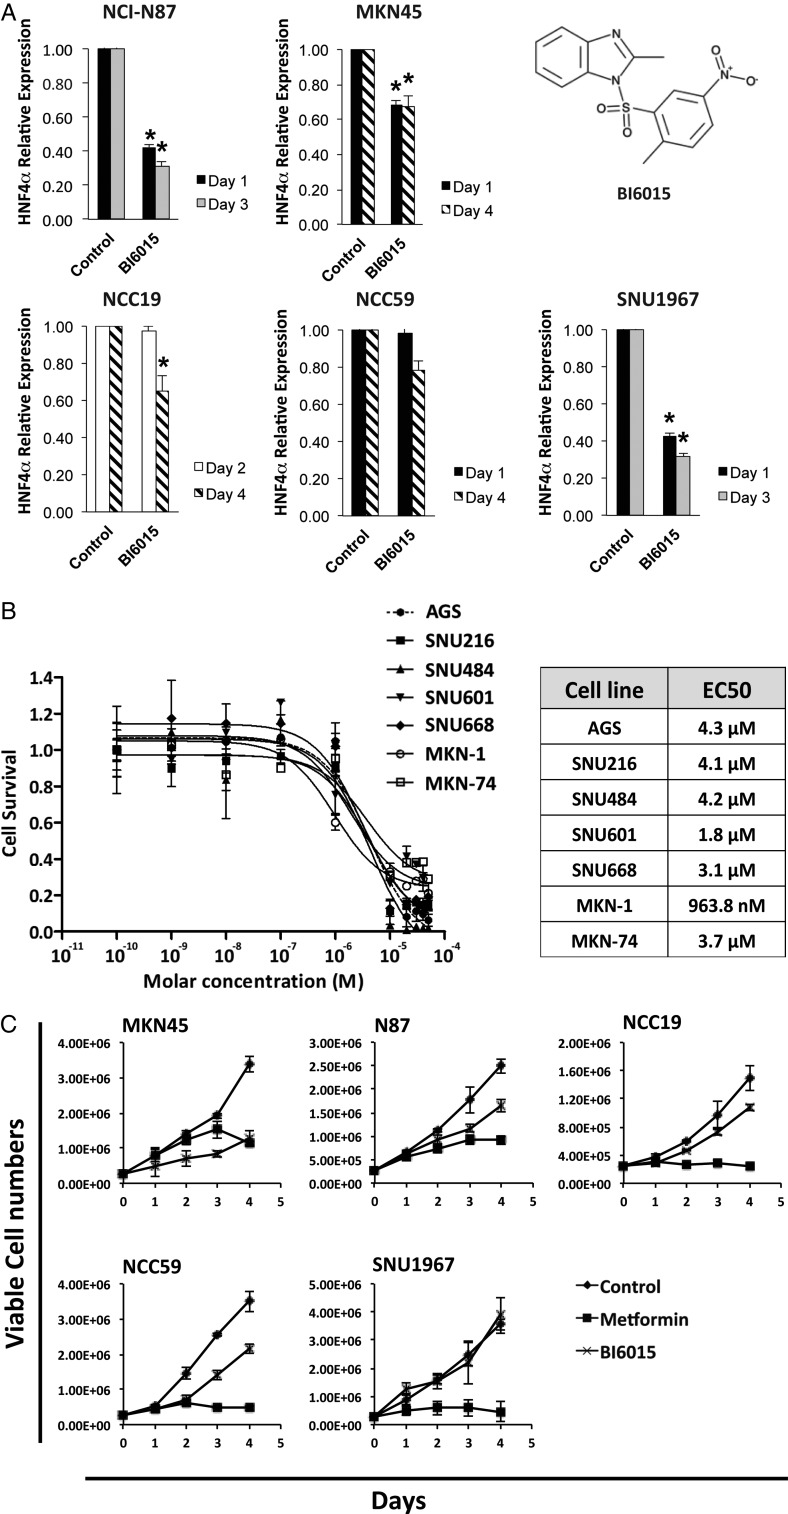
Methods: We generated transcriptomic profiles of 22 Caucasian GC tumours and their matched non-cancerous samples and performed an integrative analysis across different GC gene expression datasets. We examined the inhibition of commonly overexpressed oncogenes and their constituent signalling pathways by RNAi and/or pharmacological inhibition.

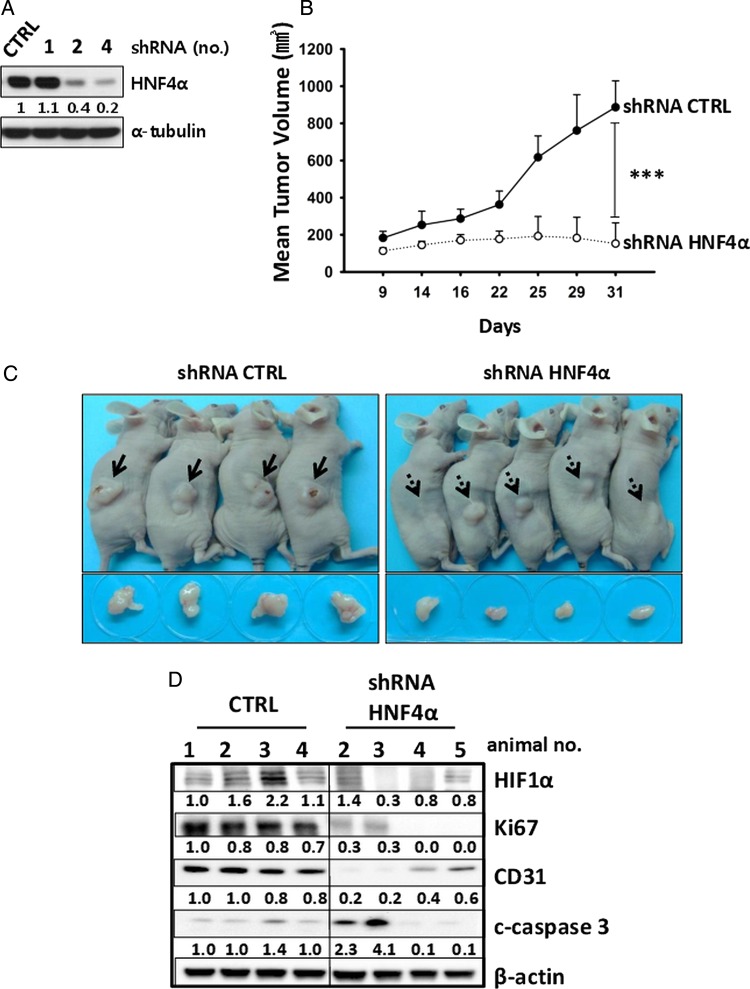
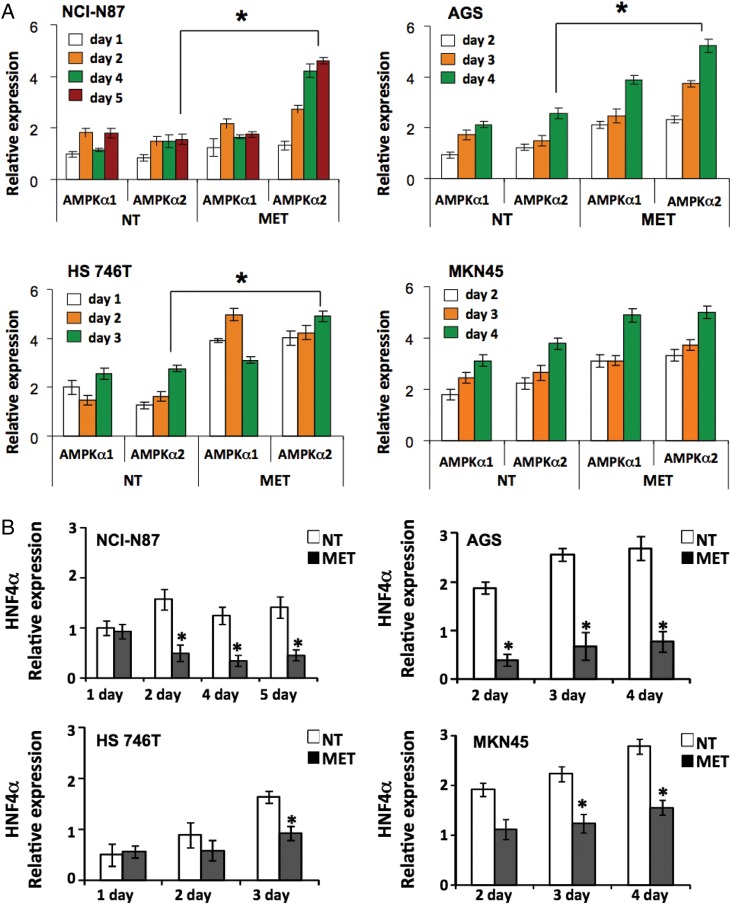
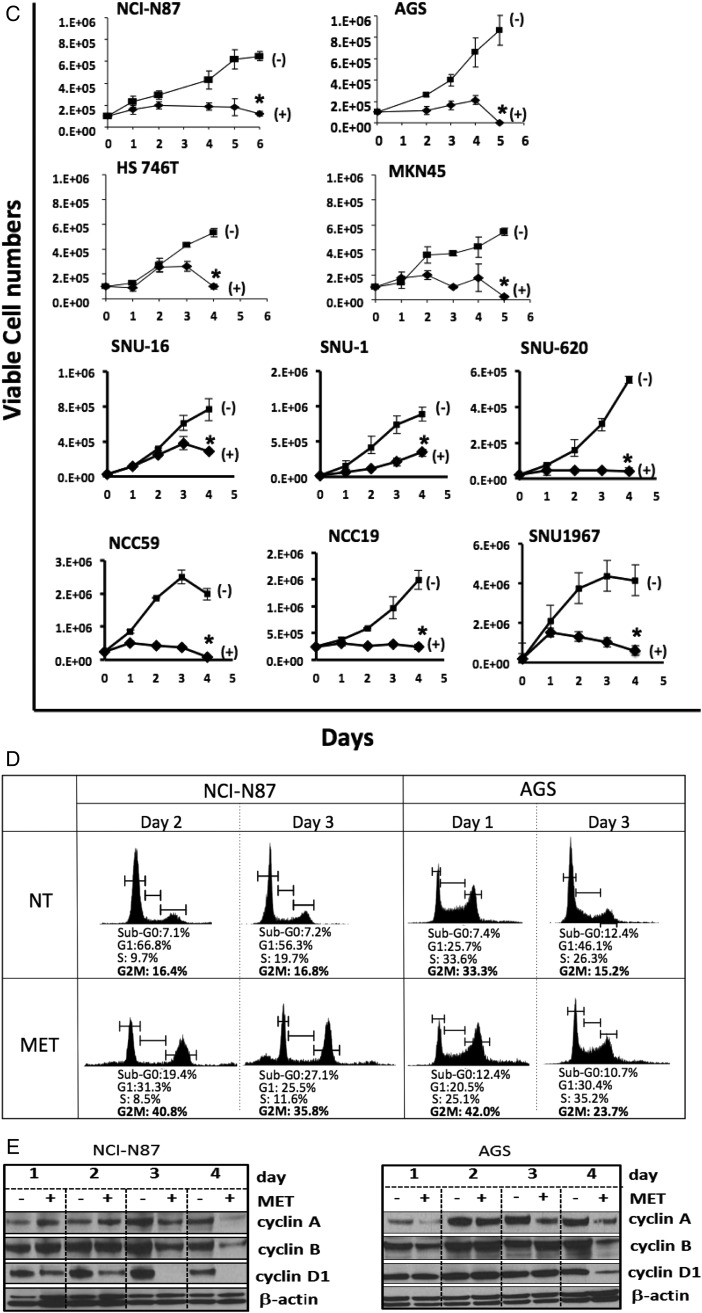
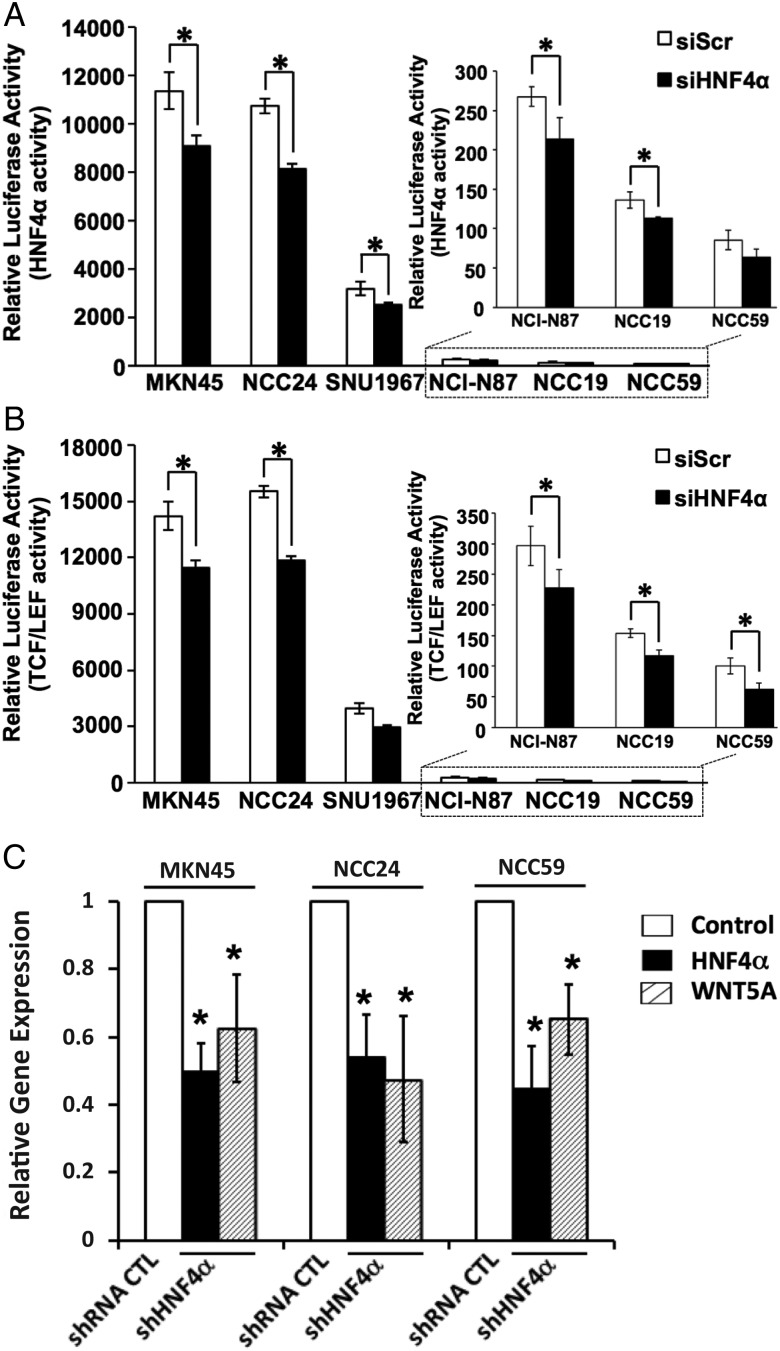
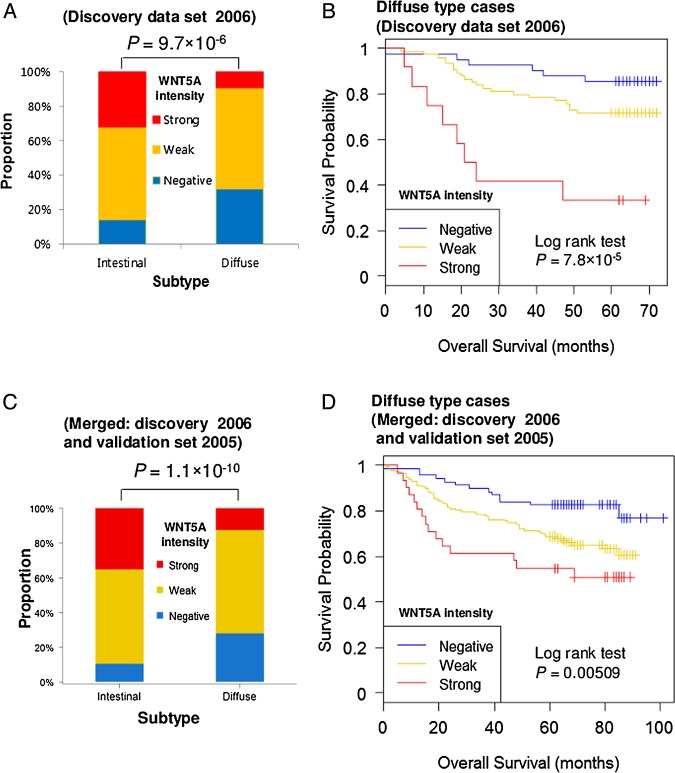
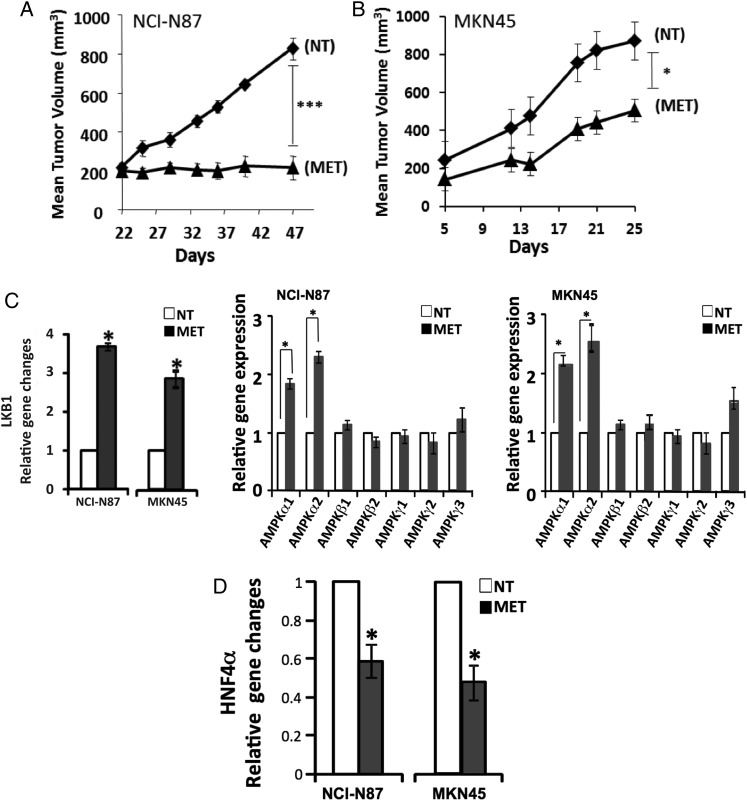
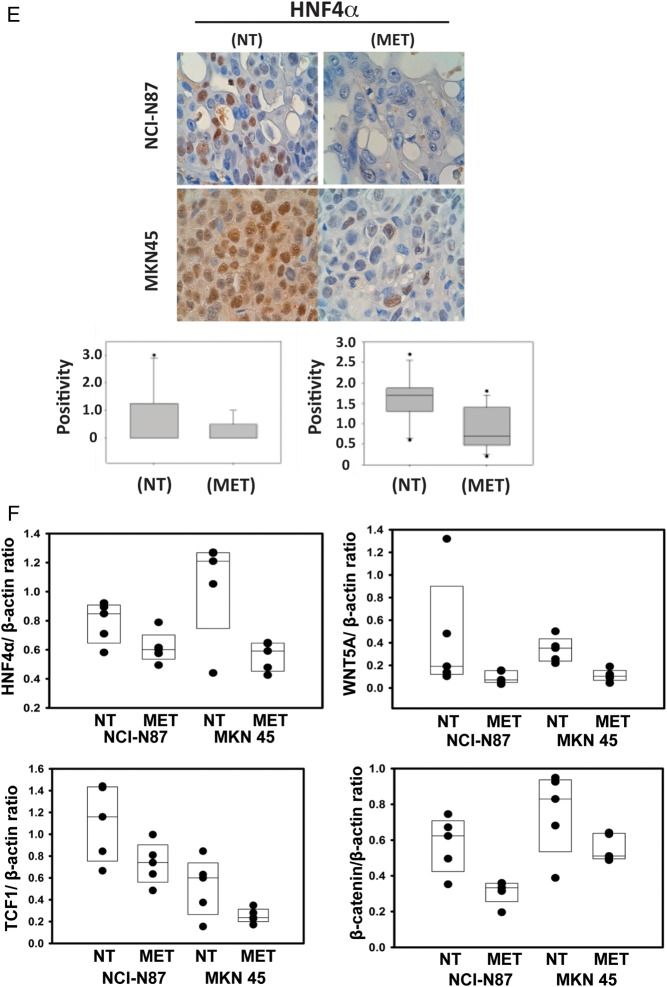
Results: Hepatocyte nuclear factor-4α (HNF4α) upregulation was a key signalling event in gastric tumours from both Caucasian and Asian patients, and HNF4α antagonism was antineoplastic. Perturbation experiments in GC tumour cell lines and xenograft models further demonstrated that HNF4α is downregulated by AMPKα signalling and the AMPK agonist metformin; blockade of HNF4α activity resulted in cyclin downregulation, cell cycle arrest and tumour growth inhibition. HNF4α also regulated WNT signalling through its target gene WNT5A, a potential prognostic marker of diffuse type gastric tumours.

Conclusions: Our results indicate that HNF4α is a targetable oncoprotein in GC, is regulated by AMPK signalling through AMPKα and resides upstream of WNT signalling. HNF4α may regulate 'metabolic switch' characteristic of a general malignant phenotype and its target WNT5A has potential prognostic values. The AMPKα-HNF4α-WNT5A signalling cascade represents a potentially targetable pathway for drug development.

Keywords: DRUG DEVELOPMENT; GASTRIC CANCER; GENE EXPRESSION; MOLECULAR BIOLOGY; ONCOGENES.


Figures

Figure 1
Figure 1
Differential expression analysis across multiple transcriptome-wide expression datasets. (A) Venn diagram of differentially expressed genes identified from the four expression datasets. (B) Classification of 396 genes into five groups: consistent upregulation with >2 fold; consistent upregulation with <2 fold; consistent downregulation with >2 fold; consistent downregulation with <2 fold; inconsistent changes. Differential expression of HNF4α in (C) Caucasian and (D) Asian RNA-seq datasets, respectively. Caucasian RNA-seq includes normal versus tumour stages I, II and III tissue samples. Asian RNA-seq includes normal versus tumour stages I, II, III and IV tissue samples.
Figure 2
Figure 2
Hepatocyte nuclear factor-4α (HNF4α) inhibition shows antitumour activities. (A) A pool of five (short hairpin RNA) shRNA lentiviral particles targeting different regions of the HNF4α mRNA transcript and shRNA empty vectors was infected into NCI-N87 gastric cancer (GC) cells. Stably transfected cells were selected by puromycin, and clones 2 and 4 showed loss of HNF4α by immunoblotting. (B, C) Nine 5-week-old female BALB/C nude mice were randomly divided into two groups (4 shRNA control, 5 shRNA HNF4α). Approximately 107 shRNA control (CTRL) and HNF4α (#2 and #4) shRNA-infected NCI-N87 cells in 100 µL phosphate-buffered saline were inoculated subcutaneously. All animals were sacrificed on day 31 after injection. ***p<0.001. (D) Immunoblotting shows antiproliferative activity with loss of hypoxia-inducible factor 1α (HIF-1α) from HNF4α shRNA-transduced xenograft model tumours.
Figure 3
Figure 3
Effect of the hepatocyte nuclear factor-4α (HNF4α) antagonist BI6015 on gastric cancer (GC) cell lines. (A) Expression of HNF4α in GC cell lines treated with or without BI6015 using quantitative RT-PCR (*p<0.05) as well as the molecular structure of BI6015. (B) EC50 growth inhibition values of BI6015 in various GC cell lines. (C) BI6015 shows different levels of growth inhibition on five GC cell lines.
Figure 4
Figure 4
AMP-activated protein kinase (AMPKα) activation and hepatocyte nuclear factor-4α (HNF4α) inhibition by metformin show antiproliferation activity in gastric cancer (GC) cell lines. (A) Expression of AMPKα1 and AMPKα2 in four GC cell lines (NCI-N87, AGS, HS 746T and MKN45), with and without metformin treatment, as measured by quantitative RT-PCR (*p<0.05). For NCI-N87, white bars=day 1, orange bars=day 2, green bars=day 4, red bars=day 5; for AGS and MKN45, white bars=day 2, orange bars=day 3, green bars=day 4; and for HS 746T, white bars=day 1, orange bars=day 2, green bars=day 3. (B) Expression of HNF4α in four GC cell lines, with and without metformin treatment (white bars=non-treated (NT), black bars=metformin-treated (MET)), as measured by quantitative RT-PCR (*p<0.05). (C) Growth inhibition observed in 10 GC cell lines (NCI-N87, AGS, HS 746T, MKN45, SNU-1, SNU-16, SNU-620, NCC59, NCC19 and SNU1967) following metformin treatment (squares=non-treated (NT), diamonds=metformin-treated (MET)). Cells were counted from the onset of metformin treatment (day 0) (*p<0.05). (D) Metformin mechanism of action through AMPKα activation and HNF4α inhibition, resulting in G2/M arrest and antiproliferation of GC cell lines. Two GC cell lines (NCI-N87 and AGS) were treated with metformin and cells were fixed and analysed for DNA content using propidium iodide and flow cytometry. Metformin-treated cells were compared with non-treated cells. The percentage of cells in each cell cycle stage was calculated. Cell cycle arrest in the G2M phase was observed following metformin treatment. (E) Immunoblotting shows the expression levels of cyclins A, B and D1. β-actin was used as control. Decreased cyclin D1 levels were apparent in both NCI-N87 and AGS cell lines upon metformin treatment.
Figure 4
Figure 4
AMP-activated protein kinase (AMPKα) activation and hepatocyte nuclear factor-4α (HNF4α) inhibition by metformin show antiproliferation activity in gastric cancer (GC) cell lines. (A) Expression of AMPKα1 and AMPKα2 in four GC cell lines (NCI-N87, AGS, HS 746T and MKN45), with and without metformin treatment, as measured by quantitative RT-PCR (*p<0.05). For NCI-N87, white bars=day 1, orange bars=day 2, green bars=day 4, red bars=day 5; for AGS and MKN45, white bars=day 2, orange bars=day 3, green bars=day 4; and for HS 746T, white bars=day 1, orange bars=day 2, green bars=day 3. (B) Expression of HNF4α in four GC cell lines, with and without metformin treatment (white bars=non-treated (NT), black bars=metformin-treated (MET)), as measured by quantitative RT-PCR (*p<0.05). (C) Growth inhibition observed in 10 GC cell lines (NCI-N87, AGS, HS 746T, MKN45, SNU-1, SNU-16, SNU-620, NCC59, NCC19 and SNU1967) following metformin treatment (squares=non-treated (NT), diamonds=metformin-treated (MET)). Cells were counted from the onset of metformin treatment (day 0) (*p<0.05). (D) Metformin mechanism of action through AMPKα activation and HNF4α inhibition, resulting in G2/M arrest and antiproliferation of GC cell lines. Two GC cell lines (NCI-N87 and AGS) were treated with metformin and cells were fixed and analysed for DNA content using propidium iodide and flow cytometry. Metformin-treated cells were compared with non-treated cells. The percentage of cells in each cell cycle stage was calculated. Cell cycle arrest in the G2M phase was observed following metformin treatment. (E) Immunoblotting shows the expression levels of cyclins A, B and D1. β-actin was used as control. Decreased cyclin D1 levels were apparent in both NCI-N87 and AGS cell lines upon metformin treatment.
Figure 5
Figure 5
Effects of hepatocyte nuclear factor-4α (HNF4α) knockdown on WNT5A in gastric cancer (GC). (A) Monitoring of HNF4α activity through HNF4α reporter luciferase assay under siRNA-HNF4α in six GC cell lines (diffuse type: SNU1967 and NCC24; intestinal type: NCC19 and NCC59) (*p<0.05). (B) Monitoring of WNT signal pathway activity through TCF/LEF reporter luciferase assays following siRNA-HNF4α knockdown in six GC cell lines (*p<0.05). (C) Suppression of WNT5A mRNA expression levels by negative control (white bars), HNF4α shRNA (black bars) or WNT5A (line filled bars) in three GC cell lines.
Figure 6
Figure 6
WNT5A is a potential prognostic marker in gastric cancer (GC) of the diffuse type. (A) WNT5A shows a strong bias with regard to the Lauren types in discovery data set (2006). (B) Kaplan–Meier plot showing correlation of WNT5A intensity with patient overall survival in the diffuse type in the discovery dataset (2006). (C, D) Merged (discovery data set 2006 and validation data set 2005) dataset shows WNT5A as a prognostic marker of diffuse type GC.
Figure 7
Figure 7
Animal models confirm the liver kinase B1/AMP-activated protein kinase/hepatocyte nuclear factor-4α (LKB1/AMPK/HNF4α) signalling cascade in gastric cancer (GC) mouse models. (A, B) Antitumor activity of metformin treatment on NCI-N87 and MKN45 GC mouse xenograft models (scid mice, n=8 per cell type). Cells were subcutaneously injected and grown for 22 days for NCI-N87 cells and 5 days for MKN45 cells before treating with metformin. Tumour size growth was measured and compared between mice treated with or without metformin, as depicted by the growth curve (diamond=non-treated (NT); triangle=metformin-treated (MET)) (*p<0.05, ***p<0.001). (C) AMPK subunit expression levels with and without metformin after 25 days (open bars=NT, black bars=MET). The expression levels of AMPKα1 and AMPKα2 were significantly higher when treated with metformin, but not those of AMPKβ1, AMPKβ2, AMPKγ1, AMPKγ2, AMPKγ3 (*p<0.05). (D) Expression level of HNF4α with and without metformin at 25 days (open bars=NT, black bars=MET). HNF4α expression level decreased upon metformin treatment. *p<0.05. (E) Immunohistochemistry results showing WNT5A staining of mouse model xenograft tumours. WNT5A levels in tumours strongly decreased when mice were treated with metformin. The stain was scored as 0–3, representing weakly or strongly positively stained cells. (F) Xenograft model protein levels for β-catenin and TCF1, the downstream genes of the HNF4α, WNT5A and WNT pathway. Mice were untreated or treated with metformin for 25 days. Four graphs represent quantified immunoblots using ImageQuant software normalised to β-actin.
Figure 7
Figure 7
Animal models confirm the liver kinase B1/AMP-activated protein kinase/hepatocyte nuclear factor-4α (LKB1/AMPK/HNF4α) signalling cascade in gastric cancer (GC) mouse models. (A, B) Antitumor activity of metformin treatment on NCI-N87 and MKN45 GC mouse xenograft models (scid mice, n=8 per cell type). Cells were subcutaneously injected and grown for 22 days for NCI-N87 cells and 5 days for MKN45 cells before treating with metformin. Tumour size growth was measured and compared between mice treated with or without metformin, as depicted by the growth curve (diamond=non-treated (NT); triangle=metformin-treated (MET)) (*p<0.05, ***p<0.001). (C) AMPK subunit expression levels with and without metformin after 25 days (open bars=NT, black bars=MET). The expression levels of AMPKα1 and AMPKα2 were significantly higher when treated with metformin, but not those of AMPKβ1, AMPKβ2, AMPKγ1, AMPKγ2, AMPKγ3 (*p<0.05). (D) Expression level of HNF4α with and without metformin at 25 days (open bars=NT, black bars=MET). HNF4α expression level decreased upon metformin treatment. *p<0.05. (E) Immunohistochemistry results showing WNT5A staining of mouse model xenograft tumours. WNT5A levels in tumours strongly decreased when mice were treated with metformin. The stain was scored as 0–3, representing weakly or strongly positively stained cells. (F) Xenograft model protein levels for β-catenin and TCF1, the downstream genes of the HNF4α, WNT5A and WNT pathway. Mice were untreated or treated with metformin for 25 days. Four graphs represent quantified immunoblots using ImageQuant software normalised to β-actin.

Similar articles

Cited by

References

    1. Jemal A, Bray F, Center MM, et al. . Global cancer statistics. CA Cancer J Clin 2011;61:69–90. - PubMed
    1. Parkin DM, Bray F, Ferlay J, et al. . Global cancer statistics, 2002. CA Cancer J Clin 2005;55:74–108. - PubMed
    1. McDonald M, Hertz RP, Pitman Lowenthal SW. Pfizer facts, the burden of cancer in Asia. USA: Pfizer, 2008.
    1. Ferlay JEA. GLOBOCAN 2008, cancer incidence and mortality worldwide. CancerBase 2010;2010.
    1. Fuccio L, Eusebi LH, Bazzoli F. Gastric cancer, Helicobacter pylori infection and other risk factors. World J Gastrointest Oncol 2010;2:342–7. - PMC - PubMed

Publication types

MeSH terms

Associated data