. 2014;15(11):524.
doi: 10.1186/s13059-014-0524-x.

The Harvest suite for rapid core-genome alignment and visualization of thousands of intraspecific microbial genomes

The Harvest suite for rapid core-genome alignment and visualization of thousands of intraspecific microbial genomes

Todd J Treangen et al. Genome Biol. 2014.

Abstract

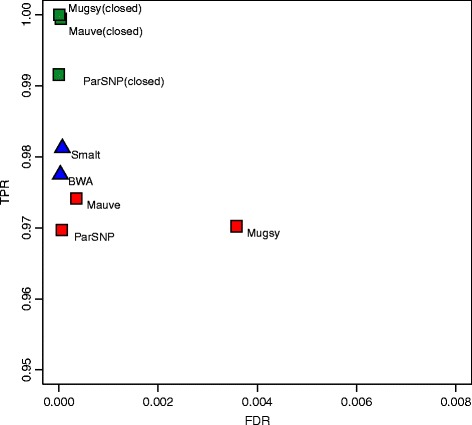
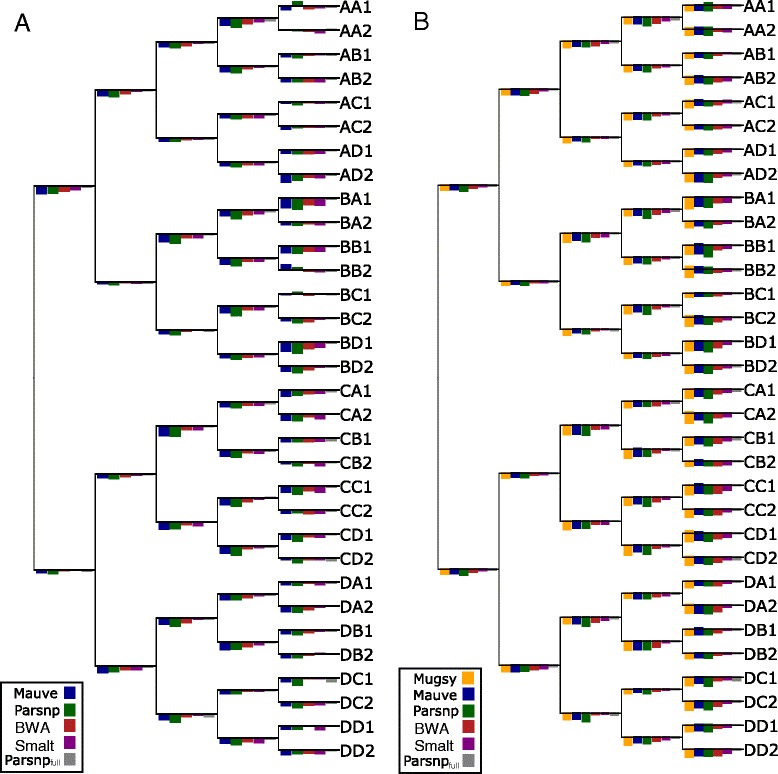
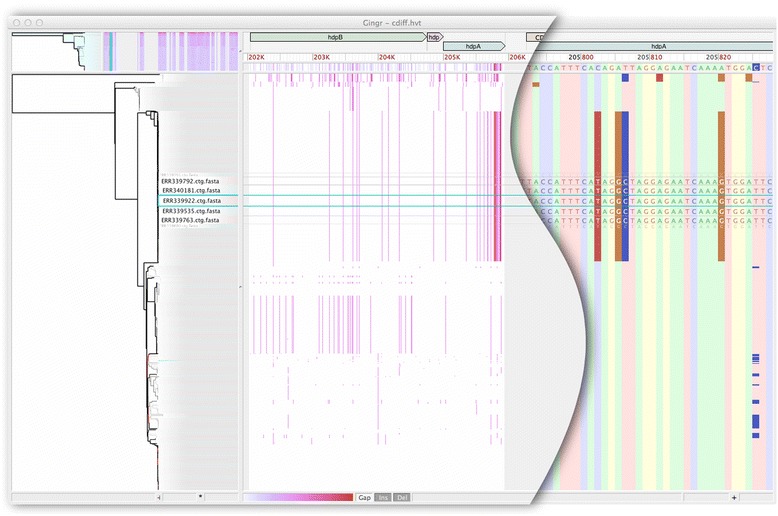
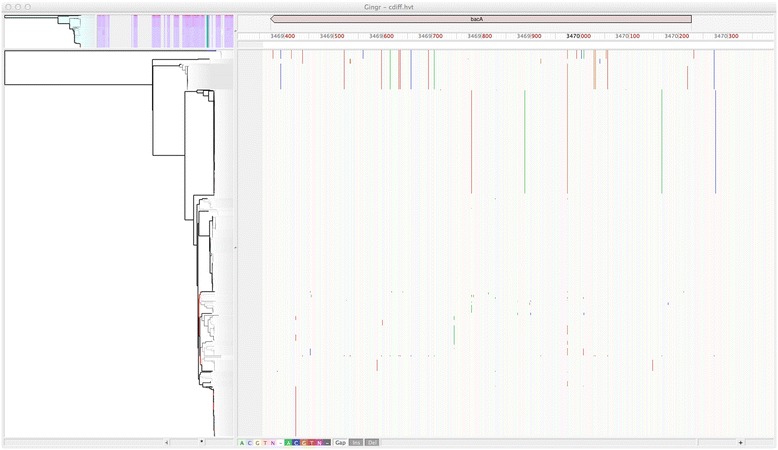
Whole-genome sequences are now available for many microbial species and clades, however existing whole-genome alignment methods are limited in their ability to perform sequence comparisons of multiple sequences simultaneously. Here we present the Harvest suite of core-genome alignment and visualization tools for the rapid and simultaneous analysis of thousands of intraspecific microbial strains. Harvest includes Parsnp, a fast core-genome multi-aligner, and Gingr, a dynamic visual platform. Together they provide interactive core-genome alignments, variant calls, recombination detection, and phylogenetic trees. Using simulated and real data we demonstrate that our approach exhibits unrivaled speed while maintaining the accuracy of existing methods. The Harvest suite is open-source and freely available from: http://github.com/marbl/harvest.


Figures

Figure 1
Figure 1
Core-genome SNP accuracy for simulated E. coli datasets. Results are averaged across low, medium, and high mutation rates. Red squares denote alignment-based SNP calls on draft assemblies, green squares alignment-based SNP calls on closed genomes, and blue triangles for read mapping. Full results for each dataset are given in Table 1.
Figure 2
Figure 2
Branch errors for simulated E. coli datasets. Simulated E. coli trees are shown for medium mutation rate (0.0001 per base per branch). (A) shows branch length errors as bars, with overestimates of branch length above each branch and underestimates below each branch. Maximum overestimate of branch length was 2.15% (bars above each branch) and maximum underestimate was 4.73% (bars below each branch). (B) shows branch SNP errors as bars, with false-positive errors above each branch and false-negative errors below each branch. The maximum FP SNP value is 6 (bars above each branch) and maximum FN SNP value is 23 (bars below each branch). Note that the bar heights have been normalized by the maximum value for each tree and are not comparable across trees. Outlier results from Mugsy were excluded from the branch length plot, and kSNP results are not shown. All genome alignment methods performed similarly on closed genomes, with Mauve and Mugsy exhibiting the best sensitivity (Table 1).
Figure 3
Figure 3
Gingr visualization of 826 P. difficile genomes aligned with Parsnp. The leaves of the reconstructed phylogenetic tree (left) are paired with their corresponding rows in the multi-alignment. A genome has been selected (rectangular aqua highlight), resulting in a fisheye zoom of several leaves and their rows. A SNP density plot (center) reveals the phylogenetic signature of several clades, in this case within the fully-aligned hpd operon (hpdB, hpdC, hpdA). The light gray regions flanking the operon indicate unaligned sequence. When fully zoomed (right), individual bases and SNPs can be inspected.
Figure 4
Figure 4
Conserved presence of bacA antiobiotic resistance gene in P. difficile outbreak. Gingr visualization of conserved bacitracin resistance gene within the Parsnp alignment of 826 P. difficile genomes. Vertical lines indicate SNPs, providing visual support of subclades within this outbreak dataset.
Figure 5
Figure 5
Comparison of Parsnp and Comas et al. result on M. tuberculosis dataset. A Venn diagram displays SNPs unique to Comas et al. [98] (left, blue), unique to Parsnp (right, red), and shared between the two analyses (middle, brown). On top, an unrooted reference phylogeny is given based on the intersection of shared SNPs produced by both methods (90,295 SNPs). On bottom, the phylogenies of Comas et al. (left) and Parsnp (right) are given. Pairs of trees are annotated with their Robinson-Foulds distance (RFD) and percentage of shared splits. The Comas et al. and Parsnp trees are largely concordant with each other and the reference phylogeny. All major clades are shared and well supported by all three trees.
Figure 6
Figure 6
Gingr visualization of 171M. tuberculosis genomes aligned with Parsnp. The visual layout is the same as Figure 3, but unlike Figure 3, a SNP density plot across the entire genome is displayed. Major clades are visible as correlated SNP densities across the length of the genome.

References

    1. Pagani I, Liolios K, Jansson J, Chen IM, Smirnova T, Nosrat B, Markowitz VM, Kyrpides NC. The Genomes OnLine Database (GOLD) v. 4: status of genomic and metagenomic projects and their associated metadata. Nucleic Acids Res. 2012;40:D571–D579. doi: 10.1093/nar/gkr1100. - DOI - PMC - PubMed
    1. Rasko DA, Webster DR, Sahl JW, Bashir A, Boisen N, Scheutz F, Paxinos EE, Sebra R, Chin CS, Iliopoulos D, Klammer A, Peluso P, Lee L, Kislyuk AO, Bullard J, Kasarskis A, Wang S, Eid J, Rank D, Redman JC, Steyert SR, Frimodt-Moller J, Struve C, Petersen AM, Krogfelt KA, Nataro JP, Schadt EE, Waldor MK. Origins of the E. coli strain causing an outbreak of hemolytic-uremic syndrome in Germany. N Engl J Med. 2011;365:709–717. doi: 10.1056/NEJMoa1106920. - DOI - PMC - PubMed
    1. Magoc T, Pabinger S, Canzar S, Liu X, Su Q, Puiu D, Tallon LJ, Salzberg SL. GAGE-B: an evaluation of genome assemblers for bacterial organisms. Bioinformatics. 2013;29:1718–1725. doi: 10.1093/bioinformatics/btt273. - DOI - PMC - PubMed
    1. Koren S, Schatz MC, Walenz BP, Martin J, Howard JT, Ganapathy G, Wang Z, Rasko DA, McCombie WR, Jarvis ED, Adam MP. Hybrid error correction and de novo assembly of single-molecule sequencing reads. Nat Biotechnol. 2012;30:693–700. doi: 10.1038/nbt.2280. - DOI - PMC - PubMed
    1. Chin CS, Alexander DH, Marks P, Klammer AA, Drake J, Heiner C, Clum A, Copeland A, Huddleston J, Eichler EE, Turner SW, Korlach J. Nonhybrid, finished microbial genome assemblies from long-read SMRT sequencing data. Nat Methods. 2013;10:563–569. doi: 10.1038/nmeth.2474. - DOI - PubMed

Publication types

LinkOut - more resources