. 2015 Feb;63(2):99-113.
doi: 10.1369/0022155414562045. Epub 2014 Nov 19.

Quantitative analysis of the cellular composition in seminiferous tubules in normal and genetically modified infertile mice

Affiliations

Quantitative analysis of the cellular composition in seminiferous tubules in normal and genetically modified infertile mice

Hiroki Nakata et al. J Histochem Cytochem. 2015 Feb.

Abstract

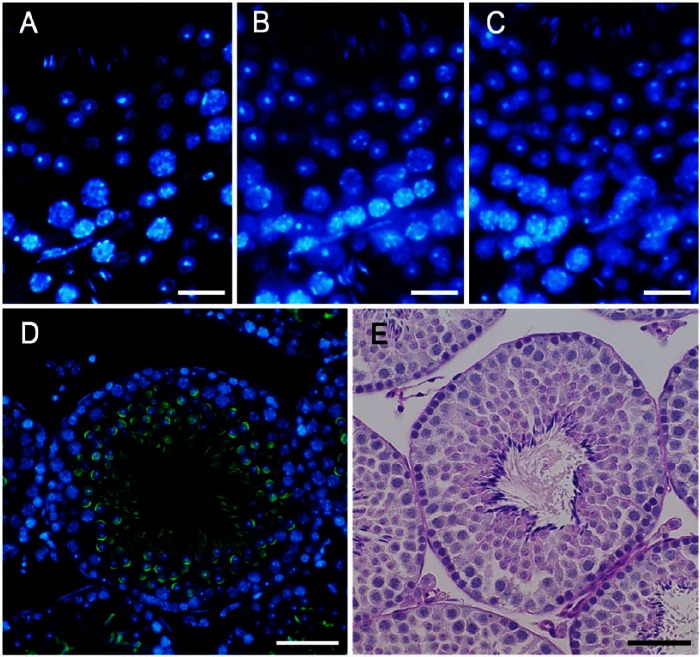
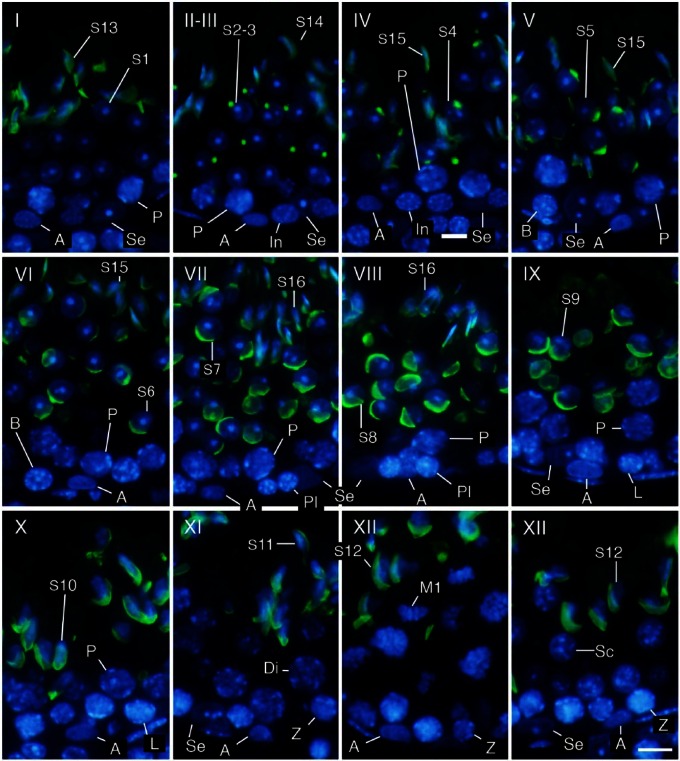
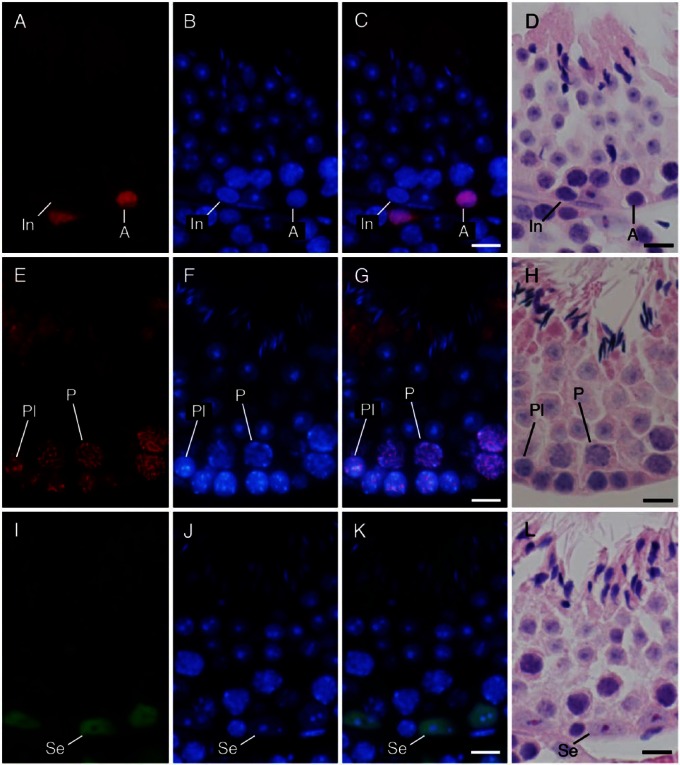
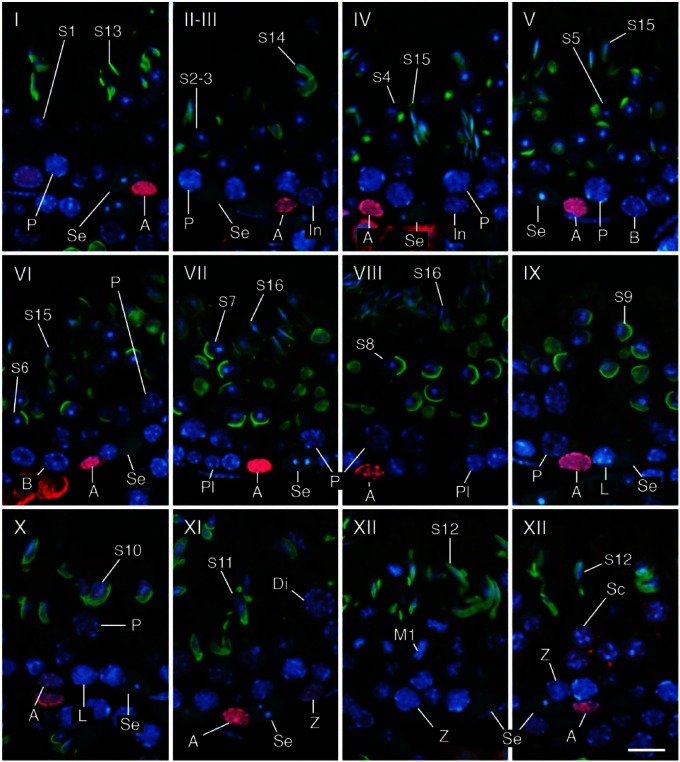
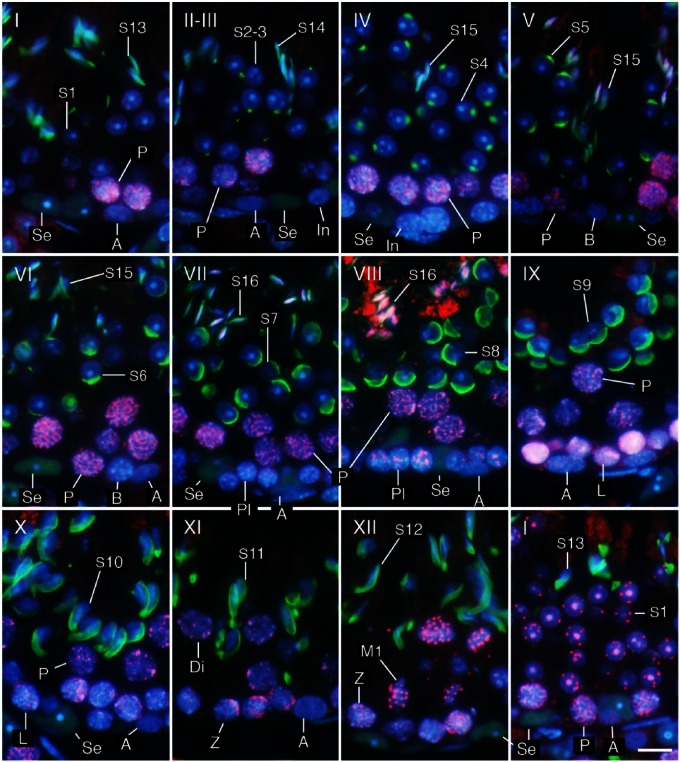
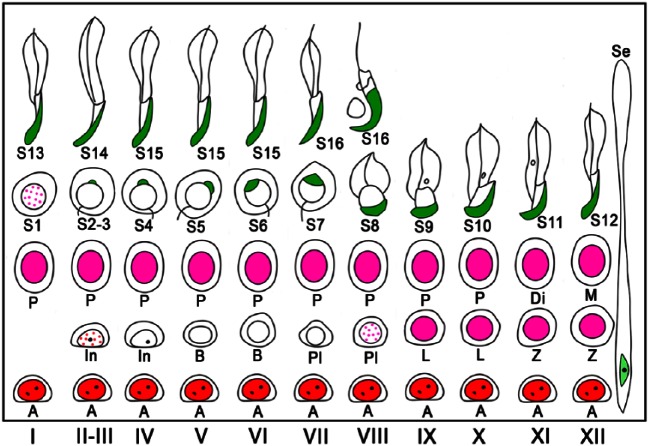
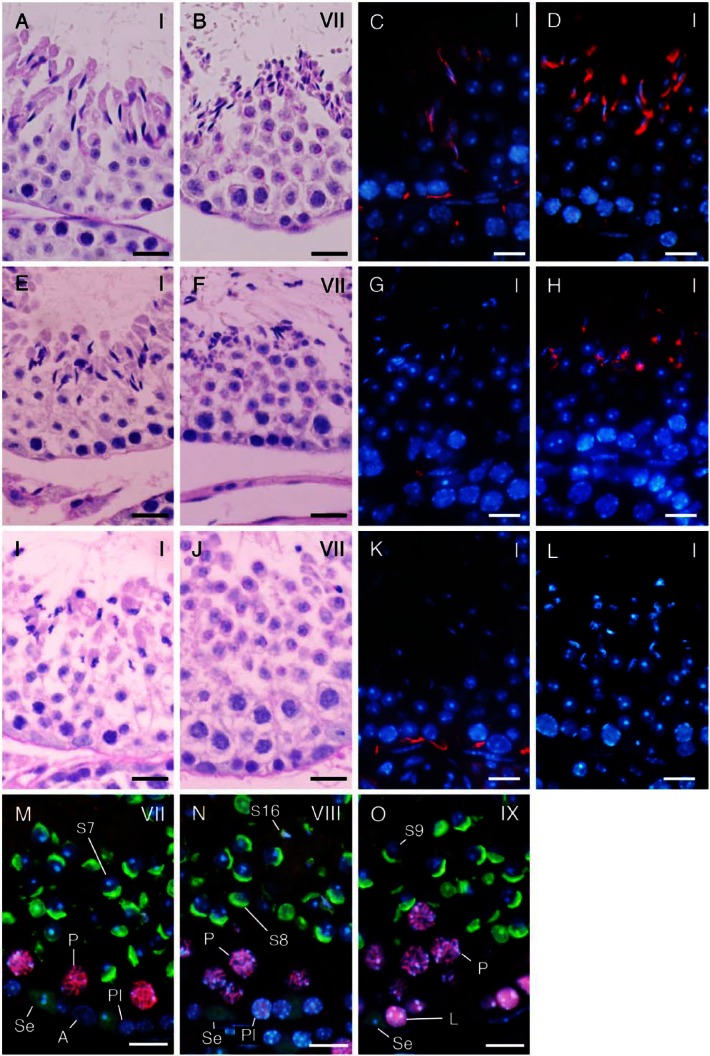
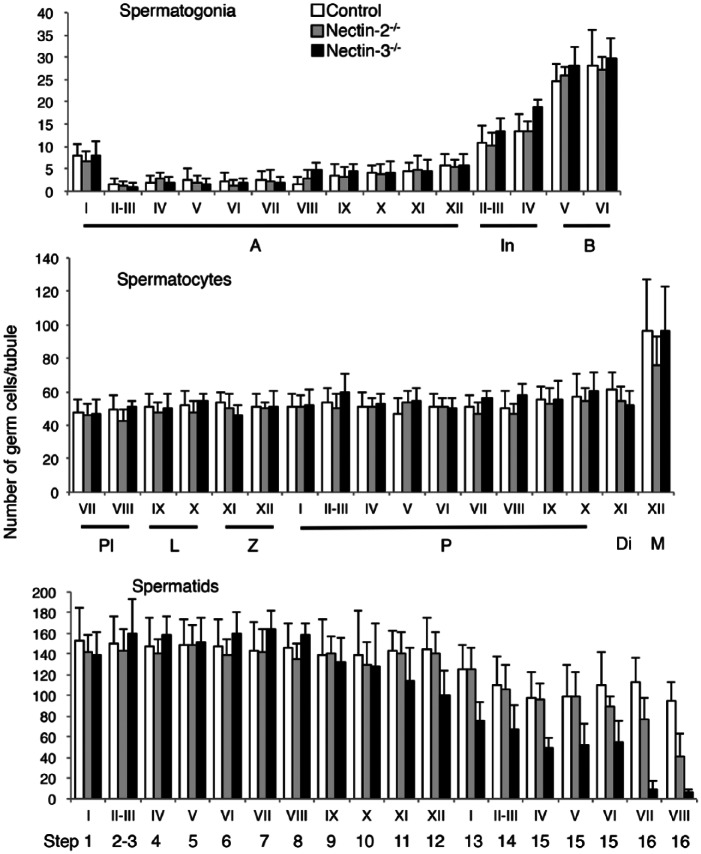
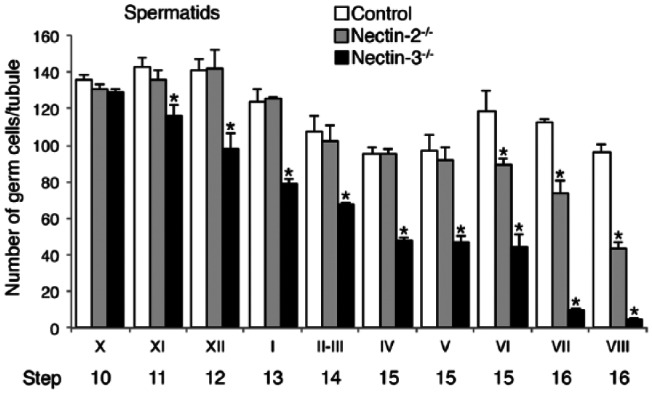
The aim of this study was to establish a quantitative standard for the cellular composition in seminiferous tubules at each stage of spermatogenesis in the mouse testis, and thereby evaluate abnormalities in the infertile mouse testis. We applied a combination of lectin histochemistry for acrosomes and immunohistochemistry for various specific cell markers, both of which were visualized with fluorescence, on paraffin sections of the testis. We first examined seminiferous tubules from normal mice and counted the number of each cell type at each stage of spermatogenesis. We then examined seminiferous tubules from genetically modified mice deficient (-/-) for one of the cell adhesion molecules, nectin-2 or nectin-3, and compared the number of each cell type at each stage of spermatogenesis with the corresponding value in normal mice. In both nectin-2-/- and nectin-3-/- mice, which are infertile despite the apparently normal morphology of the seminiferous epithelia, we measured a progressive loss in the later-step spermatids, with significantly lower numbers of step 11-16 spermatids in nectin-3-/- mice and step 15-16 spermatids in nectin-2-/- mice as compared with that in normal control mice. The present study demonstrated that a quantitative analysis of cellular compositions at different stages in seminiferous tubules was useful for evaluating abnormalities in spermatogenesis.

Keywords: cell adhesion molecule; fluorescence; immunohistochemistry; lectin; spermatogenesis; stage.


Conflict of interest statement

The authors declared no potential conflicts of interest with respect to the research, authorship, and/or publication of this article.

Figures

Figure 1.
Figure 1.
Sections of the seminiferous epithelium (presumably stage VII or VIII) taken at 1 µm (A), 3 µm (B) and 5 µm (C) in thickness and stained with DAPI. Stage VIII seminiferous tubules shown after fluorescence (D) and periodic acid-Schiff/hematoxylin (PAS-H; E) staining. Acrosomes were stained with PNA lectin histochemistry (green; D) or PAS (E), and nuclei were stained with DAPI (blue; D) or hematoxylin (E). Scale, 15 μm (A–C), 30 μm (D, E).
Figure 2.
Figure 2.
Determination of stages (I–XII) and identification of cell types. Three-µm-thick sections were stained in the nuclei with DAPI (blue) and in the acrosomes with PNA lectin histochemistry (green). Se, Sertoli cells; A, type A spermatogonia; In, intermediate spermatogonia; B, type B spermatogonia; Pl, preleptotene spermatocytes; L, leptotene spermatocytes; Z, zygotene spermatocytes; P, pachytene spermatocytes; Di, diplotene spermatocytes; M1, spermatocytes undergoing the first meiotic division; Sc, secondary spermatocytes; S1-16, step 1-16 spermatids. Scale, 10 μm.
Figure 3.
Figure 3.
Immunohistochemical localization of ZBTB16 (A–D), SYCP3 (E–H), and GATA4 (I–L) in the seminiferous tubules at approximate stages of IV, VIII, and VII, respectively. (A, E, I) immunostaining with the antibodies indicated (red in A, E; green in I); (B, F, J) staining with DAPI (blue); and (C, G, K) merged pictures. (D, H, L) Staining with HE after fluorescent staining. (A–D) type A (A) spermatogonia were immunopositive, whereas intermediate (In) spermatogonia were immunonegative. (E–H) Preleptotene (Pl) spermatocytes and pachytene (P) spermatocytes were immunopositive. (I–L) Sertoli cells (Se) were immunopositive. Scale, 10 μm.
Figure 4.
Figure 4.
Determination of stages I–XII and identification of cell types using a combination of IHC and PNA lectin histochemistry. Three-µm-thick sections were double-immunostained for GATA4 (green) and ZBTB16 (red), then stained with PNA-lectin histochemistry (green) and DAPI (blue). Se, Sertoli cells; A, type A spermatogonia; In, intermediate spermatogonia; B, type B spermatogonia; Pl, preleptotene spermatocytes; L, leptotene spermatocytes; Z, zygotene spermatocytes; P, pachytene spermatocytes; Di, diplotene spermatocytes; M1, spermatocytes undergoing the first meiotic division; Sc, secondary spermatocytes; S1-16, step 1-16 spermatids. Scale, 10 μm.
Figure 5.
Figure 5.
Determination of stages (I–XII) and identification of cell types using a combination of IHC and PNA lectin histochemistry. Three-µm-thick sections were double-immunostained for GATA4 (green) and SYCP3 (red), then stained with PNA-lectin histochemistry (green) and DAPI (blue). Se, Sertoli cells; A, type A spermatogonia; In, intermediate spermatogonia; B, type B spermatogonia; Pl, preleptotene spermatocytes; L, leptotene spermatocytes; Z, zygotene spermatocytes; P, pachytene spermatocytes; Di, diplotene spermatocytes; M1, spermatocytes undergoing the first meiotic division; S1-16, step 1-16 spermatids. Scale, 10 μm.
Figure 6.
Figure 6.
Schematic of acrosomal staining patterns with PNA lectin histochemistry and nuclear immunostaining patterns for ZBTB16, SYCP3, and GATA4 at different stages (I–XII) of mouse spermatogenesis. PNA lectin is shown in green, GATA4 in light-green, ZBTB16 in red, and SYCP3 in pink. Dotted red and pink for ZBTB16 and SYCP3, respectively, indicate that immunoreactivity was weak and dot-like in distribution. Se, Sertoli cells; A, type A spermatogonia; In, intermediate spermatogonia; B, type B spermatogonia; Pl, preleptotene spermatocytes; L, leptotene spermatocytes; Z, zygotene spermatocytes; P, pachytene spermatocytes; Di, diplotene spermatocytes; M, meiotic cells; S1–16, step 1-16 spermatids.
Figure 7.
Figure 7.
A comparison of seminiferous tubules in normal control (A–D), nectin-2-/- (E–H), and nectin-3-/- mice (I–O) at the representative stages shown in period acid-Schiff–hematoxylin (PAS-H) staining (A–B, E–F, I–J), IHC for nectin-2 (red; C, G, K) and nectin-3 (red; D, H, L), and double IHC for SYCP3 (red) and GATA4 (green) in combination with PNA-lectin histochemistry (green) (M–O). Nuclei were stained with DAPI (blue; C–D, G–H, K–L, M–O). (A–L) Normal (A, E) and distorted (I) shapes of step 13 spermatids in stage I; abundant (B), fewer (F), and scarce (I) numbers of step 16 spermatids in stage VII; the presence (C, K) and absence (G) of nectin-2-immunoreactivity in Sertoli cells in stage I, as well as the presence (D, H) and absence (L) of nectin-3-immunoreactivity in step 13 spermatids in stage I. (M–O) Stage VII (M), VIII (N), and IX (O) seminiferous tubules were distinguishable with the help of SYCP3 immunoreactivity in preleptotene (PI) spermatocytes at stage VIII, but not in those at stage VII, in leptotene (L) spermatocytes at stage IX, or in pachytene (P) spermatocytes at stages VII–IX, even in the absence of step 16 spermatids (S16) and with similar acrosomal patterns in step 7–9 spermatids (S7-9). Se, Sertoli cells immunopositive for GATA4 (green). Scale, 20 μm (A-–L), 10 μm (M–O).
Figure 8.
Figure 8.
An analysis of the numbers of different spermatogenic cell types in seminiferous tubules at different stages (I–XII) in normal control, nectin-2-/-, and nectin-3-/- mice. The numbers of all spermatogenic cell types in each stage were counted for a total of 322 (in control mouse), 197 (in nectin-2-/- mouse), or 220 (in nectin-3-/- mouse) seminiferous tubule sections obtained from a testis of a single representative mouse from the respective strains, and expressed as the mean cell number ± SD per tubule in each stage. Data obtained in control mouse are the same as that given in Table 1. A, type A spermatogonia; In, intermediated spermatogonia; B, type B spermatogonia; Pl, preleptotene spermatocytes; L, leptotene spermatocytes; Z, zygotene spermatocytes; P, pachytene spermatocytes; Di, diplotene spermatocytes; M, meiotic cells; S1-16, step 1-16 spermatids.
Figure 9.
Figure 9.
A comparison of the numbers of later-step spermatids among normal control, nectin-2-/-, and nectin-3-/- mice. The mean numbers of step 10 and later spermatids in stage X–VIII seminiferous tubules were first calculated for each testis, as in Figure 8, and the data obtained in 3 testes from 3 animals for each mouse strain are expressed as the average cell number ± SD per tubule in each stage (n=3). Differences in cell numbers among control, nectin-2-/-, and nectin-3-/- mice were analyzed with a one-way ANOVA followed by Bonferroni’s post-hoc test. *significantly lower than the numbers of corresponding spermatids in the same stages in control mice (p<0.05; n=3).

References

    1. Abercrombie M. (1946). Estimation of nuclear population from microtome sections. Anat Rec 94:239-247. - PubMed
    1. Ahmed EA, de Rooij DG. (2009). Staging of mouse seminiferous tubule cross-sections. Methods Mol Biol 558:263-277. - PubMed
    1. Arya M, Vanha-Perttula T. (1986). Comparison of lectin-staining pattern in testis and epididymis of gerbil, guinea pig, mouse, and nutria. Am J Anat 175:449-469. - PubMed
    1. Buaas FW, Kirsh AL, Sharma M, McLean DJ, Morris JL, Griswold MD, de Rooij DG, Braun RE. (2004). Plzf is required in adult male germ cells for stem cell self-renewal. Nat Genet 36:647-652. - PubMed
    1. Chiarini-Garcia H, Russell LD. (2001). High-resolution light microscopic characterization of mouse spermatogonia. Biol Reprod 65:1170–1178. - PubMed

Publication types