. 2015 Jan 1;194(1):307-15.
doi: 10.4049/jimmunol.1401999. Epub 2014 Nov 19.

Altered lymph node composition in diphtheria toxin receptor-based mouse models to ablate dendritic cells

Affiliations

Altered lymph node composition in diphtheria toxin receptor-based mouse models to ablate dendritic cells

Janneke van Blijswijk et al. J Immunol. .

Abstract

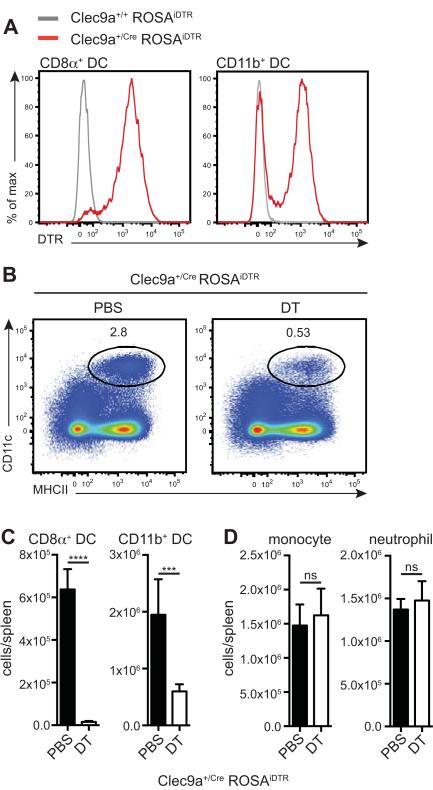
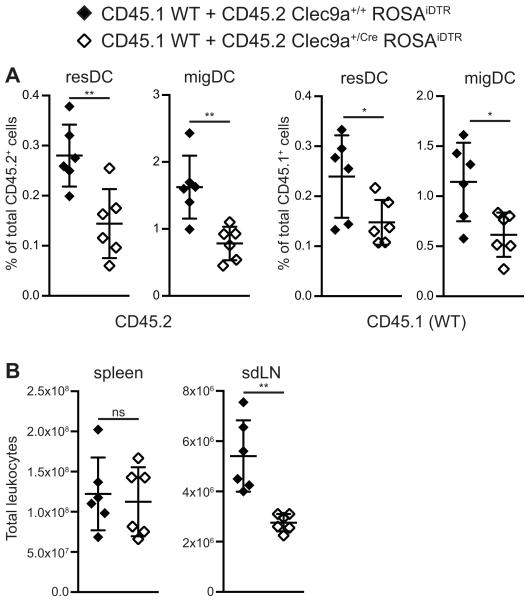
Dendritic cells (DCs) are key regulators of innate and adaptive immunity. Our understanding of immune function has benefited greatly from mouse models allowing for selective ablation of DCs. Many such models rely on transgenic diphtheria toxin receptor (DTR) expression driven by DC-restricted promoters. This renders DCs sensitive to DT but is otherwise thought to have no effect on immune physiology. In this study, we report that, unexpectedly, mice in which DTR is expressed on conventional DCs display marked lymph node (LN) hypocellularity and reduced frequency of DCs in the same organs but not in spleen or nonlymphoid tissues. Intriguingly, in mixed bone marrow chimeras the phenotype conferred by DTR-expressing DCs is dominant over control bone marrow-derived cells, leading to small LNs and an overall paucity of DCs independently of the genetic ability to express DTR. The finding of alterations in LN composition and size independently of DT challenge suggests that caution must be exercised when interpreting results of experiments obtained with mouse models to inducibly deplete DCs. It further indicates that DTR, a member of the epidermal growth factor family, is biologically active in mice. Its use in cell ablation experiments needs to be considered in light of this activity.


Figures

Figure 1
Figure 1. Efficient DC depletion in spleens of DT-injected Clec9a+/creROSAiDTR mice
(A) CD8α+ DCs (CD11c+ MHCII+ CD8α+) and CD11b+ DCs (CD11c+ MHCII+ CD11b+) in spleen were stained with a polyclonal anti-DTR antibody and analyzed by flow cytometry. Each plot is representative of at least 6 mice per group. (B-D) Mice were injected with DT or PBS and sacrificed 24h later. (B-D) CD8α+ DCs (CD11c+ MHCII+ CD8α+) and CD11b+ DCs (CD11c+ MHCII+ CD11b+) in spleen were identified by flow cytometry. (B) Representative plots of spleen for PBS and DT treated Clec9a+/CreROSAiDTR mice (gated on live, autofluorescence cells). Frequency of gated population is shown. (C) Total CD8α+ DCs and CD11b+ DCs in spleen of PBS- and DT-treated Clec9a+/CreROSAiDTR mice. (D) The total counts of monocytes (CD11b+ Ly6c+ Ly6g) and neutrophils (CD11b+ Ly6g+) per spleen of PBS and DT treated Clec9a+/CreROSAiDTR mice is shown. Ns: non significant, ***: p≤0.001, ****: p≤0.0001. This experiment was performed twice with 4-7 mice per group. One representative experiment is shown.
Figure 2
Figure 2. LNs, but not spleen, thymus or non-lymphoid tissues of Clec9a+/CreROSAiDTR mice display hypocellularity and reduced DC frequency
(A) Representative plots of sdLNs of control and Clec9a+/CreROSAiDTR mice, gated on live cells. (B) CD8α+ DCs (CD11c+ MHCII+ CD8α+) and CD11b+ DCs (CD11c+ MHCII+ CD11b+) in spleen, DCs in thymus (CD11c+ MHCII+) and resDCs (CD11c+ MHCIIint) and migDCs (CD11c+ MHCIIhi) in sdLNs and mesLNs of control and Clec9a+/CreROSAiDTR mice were identified by flow cytometry and DC subsets as percentage of live leukocytes are plotted. (C) The frequency of Langerhans cells (LCs, MHCII+ CD64 EpCAMhi), CD103+ DCs (MHCII+ CD64 CD103+) and double negative DCs (dn DCs, MHCII+ CD64 CD103 EpCAM) in epidermis and dermis of control and Clec9a+/CreROSAiDTR mice is shown (left two panels). The frequency of CD64+ cells (CD11c+ MHCII+ CD64+), CD103+ DCs (CD11c+ MHCII+ CD64 CD103+ CD11b), CD103+ CD11b+ DCs (CD11c+ MHCII+ CD64 CD103+ CD11b+) and CD11b+ DCs (CD11c+ MHCII+ CD64 CD103 CD11b+) in the small intestine and DCs (CD11c+ MHCII+) in the Peyer’s Patches (PP) of control and Clec9a+/CreROSAiDTR mice is shown (right two panels). (D) Single-cell suspensions of spleen, thymus, sdLNs and mesLNs from control and Clec9a+/CreROSAiDTR mice were counted and the number of total leukocytes is plotted. (E) T cells (CD3+ MHCII) and B cells (MHCII+ CD11c) in mesLNs of control and Clec9a+/CreROSAiDTR mice were identified by flow cytometry and T cells and B cells as percentage of live leukocytes are plotted. (B-E) Each dot represents one mouse. Ns: non significant, *: p≤0.05, **: p≤0.01, ***: p≤0.001, ****: p≤0.0001. Data are pooled from at least two independent experiments. (F) Frozen sections of sdLNs from control and Clec9a+/creROSAiDTR mice were stained with anti-CD3 and anti-B220 antibodies and imaged by confocal microscopy. Scale bar: 300μm. Images are representative of 3 mice per group.
Figure 3
Figure 3. In mixed bone marrow chimeras the phenotype conferred by Clec9a+/CreROSAiDTR bone marrow is dominant
CD45.2+ C57BL/6J hosts were lethally irradiated and reconstituted with a 1:1 mixture of CD45.1+ WT and CD45.2+ Clec9a+/+ROSAiDTR or Clec9a+/CreROSAiDTR BM. Mice were analyzed 7 months after BM transfer. (A) Single cell suspensions of sdLNs were analyzed by flow cytometry. CD45.1+ and CD45.2+ cells were identified and within these fractions resDCs (CD11c+ MHCIIint) and migDCs (CD11c+ MHCIIhi) were gated. Frequencies of resDCs and migDCs within the CD45.2+ or CD45.1+ fraction are plotted. (B) Total leukocyte numbers of spleens and sdLNs are plotted. Each dot represents one mouse. Ns: non significant, *: p≤0.05, **: p≤0.01. Data are representative of two independent experiments.
Figure 4
Figure 4. Other mouse models in which DTR is expressed on migDCs display hypocellularity and reduced DC frequency in sdLNs
(A-C) SdLNs of CD11c-Cre+veROSAiDTR (A) CD11c-DTR (B) and Langerin-DTR (C) mice were analyzed for total cellularity (left panel) and frequency of resDCs (CD11c+ MHCIIint) and migDCs (CD11c+ MHCIIhi) (right panel). (D) ResDCs (CD11c+ MHCIIint) and migDCs (CD11c+ MHCIIhi) in sdLNs from Langerin-DTR mice were stained with a polyclonal anti-DTR antibody and analyzed by flow cytometry. (E) SdLNs from CD11c-DOG mice were analyzed as in A-C. (F) DTR expression on resDCs and migDCs in sdLNs from CD11c-DOG mice was analyzed as in D. (A-C,E) Each dot represents one mouse. Data are pooled from at least two independent experiments. Ns: non significant, *: p≤0.05, **: p≤0.01 ***: p≤0.001, ****: p≤0.0001. (B,F) Each plot is representative of 6-8 mice per group.
Figure 5
Figure 5. Expression of DTR on B cells or Tregs does not lead to overall LN hypocellularity and reduced frequencies of LN DCs
Left panels: single-cell suspensions of sdLNs, mesLNs and spleen from control and CD19+/CreROSAiDTR mice (A) or DEREG mice (B) were counted and the number of total leukocytes is plotted. Right panels: resDCs (CD11c+ MHCIIint) and migDCs (CD11c+ MHCIIhi) in sdLNs and mesLNs and CD8α+ DCs (CD11c+ MHCII+ CD8α+), CD11b+ DCs (CD11c+ MHCII+ CD11b+) and B cells (CD11c MHCII+, CD19+/CreROSAiDTR mice only) in spleen of control and CD19+/CreROSAiDTR mice (A) or DEREG mice (B) were identified by flow cytometry and DC subsets as percentage of live leukocytes are plotted. Each dot represents one mouse. Data are pooled from at least two independent experiments. Ns: non significant, *: p≤0.05, **: p≤0.01 ***: p≤0.001.

References

    1. Geissmann F, Manz MG, Jung S, Sieweke MH, Merad M, Ley K. Development of monocytes, macrophages, and dendritic cells. Science. 2010;327:656–661. - PMC - PubMed
    1. Hashimoto D, Miller J, Merad M. Dendritic Cell and Macrophage Heterogeneity In Vivo. Immunity. 2011;35:323–335. - PMC - PubMed
    1. Heath WR, Carbone FR. Dendritic cell subsets in primary and secondary T cell responses at body surfaces. Nat Immunol. 2009;10:1237–1244. - PubMed
    1. Steinman RM, Idoyaga J. Features of the dendritic cell lineage. Immunol Rev. 2010;234:5–17. - PubMed
    1. Schraml BU, van Blijswijk J, Zelenay S, Whitney PG, Filby A, Acton SE, Rogers NC, Moncaut N, Carvajal JJ, Reis e Sousa C. Genetic tracing via DNGR-1 expression history defines dendritic cells as a hematopoietic lineage. Cell. 2013;154:843–858. - PubMed

Publication types

MeSH terms