. 2014 Oct;6(10):788-819.
doi: 10.18632/aging.100695.

Eryptosis as a marker of Parkinson's disease

Affiliations

Eryptosis as a marker of Parkinson's disease

Etheresia Pretorius et al. Aging (Albany NY). 2014 Oct.

Abstract

A major trend in recent Parkinson's disease (PD) research is the investigation of biological markers that could help in identifying at-risk individuals or to track disease progression and response to therapies. Central to this is the knowledge that inflammation is a known hallmark of PD and of many other degenerative diseases. In the current work, we focus on inflammatory signalling in PD, using a systems approach that allows us to look at the disease in a more holistic way. We discuss cyclooxygenases, prostaglandins, thromboxanes and also iron in PD. These particular signalling molecules are involved in PD pathophysiology, but are also very important in an aberrant coagulation/hematology system. We present and discuss a hypothesis regarding the possible interaction of these aberrant signalling molecules implicated in PD, and suggest that these molecules may affect the erythrocytes of PD patients. This would be observable as changes in the morphology of the RBCs and of PD patients relative to healthy controls. We then show that the RBCs of PD patients are indeed rather dramatically deranged in their morphology, exhibiting eryptosis (a kind of programmed cell death). This morphological indicator may have useful diagnostic and prognostic significance.


Conflict of interest statement

Conflict of interest statement

None of the authors has any conflict of interest to declare.

Figures

Figure 1
Figure 1
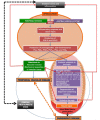
An overview figure summarizing the contents of this manuscript.
Figure 2
Figure 2
A simplified diagram on how inflammatory signalling contribu tes to both cardiovascular disease and Parkinson's disease.
Figure 3
Figure 3
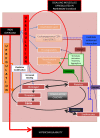
Signalling molecules, their role in the coagulation and hematological system, and their involvement in Parkinson's disease.
Figure 4
Figure 4
Eryptosis and its signalling molecules: the changes it effects on erythrocytes. Prominent triggers are hyperosmotic shock and oxidative stress. These triggers result in three morphologically visible changes to RBCs and these are phospholipid membrane scrambling (1); cell shrinkage (2) and membrane blebbing (3); when any of these changes are noted in RBCs, the phenomenon is collectively known as eryptosis.
Figure 5
Figure 5
Representative erythrocytes of healthy individuals prepared from whole blood smears. Serum ferritin = 48 ng.mL−1 (A) Erythrocyte prepared from whole blood without thrombin; scale = 1μm; (B) Erythrocyte prepared from whole blood with added thrombin to create extensive fibrin fibre network around erythrocytes; scale = 1μm; (C) High machine magnification of 150,000x showing erythrocyte membrane, scale bar = 100 nm.
Figure 6
Figure 6
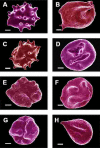
Erythrocytes of Parkinson's disease patients prepared from whole blood smears. Serum ferritin levels: (A) 80 ng.mL‐1 (B) 194 ng.mL‐1 (C) 90 ng.mL‐1 (D) 90 ng.mL−1 (E) 145 ng.mL‐1 (F) 358 ng.mL‐1 (G) 145 ng.mL‐1 (H) 21 ng.mL−1 Scale bar = 1μm.
Figure 7
Figure 7
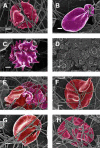
Erythrocytes of Parkinson's disease patients prepared from whole blood with added thrombin. Serum ferritin levels: (A) 118 ng.mL−1 (B) 194 ng.mL-1 (C) 21 ng.mL-1 (D) 107 ng.mL−1 (lower machine magnification to show general SEM view of erythrocytes) (E) 145 ng.mL−1 (F) 358 ng.mL-1 (G) 372 ng.mL-1 (H) 90 ng.mL-1 Scale bar = 1μm.
Figure 8
Figure 8
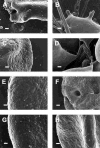
High magnification (100,000x machine magnification) of erythrocyte membranes of Parkinson's disease patients prepared from whole blood. Serum ferritin levels: (A) 194 ng.mL−1 (B) 118 ng.mL−1 (C) 90 ng.mL−1 (D) 21 ng.mL−1 (E) 281 ng.mL−1 (F) 145 ng.mL−1 (G) 372 ng.mL−1 (H) 358 ng.mL−1 Scale bar = 200 nm.
Figure 9
Figure 9
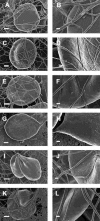
Whole blood of Parkinson's disease patients treated with desferal with added thrombin. All micrographs in left column are low magnifications while the micrographs in the right columns are the respective 100,000x machine magnification of the same individual's erythrocyte membranes. Serum ferritin levels: (A) and (B) 107 ng.mL−1 (C and D) 36 ng.mL-1 (E and F) 90 ng.mL−1 (G and H) 145 ng.mL−1 (I and J) 156 ng.mL−1 (K and L) 358 ng.mL−1 Low magnification scale bar = 1μm; high magnification scale bar is 200 nm.
Figure 10
Figure 10
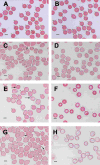
Light microscopy micrograph of whole blood smears from (A) a healthy individual (serum ferritin: 13 ng.mL-1) and (B) a healthy individual, (serum ferritin: 48 ng.mL−1) (C) a female PD individual (serum ferritin: 152 ng.mL−1) and (D) the same PD individual after treatment with desferal; (E) a male PD individual (serum ferritin: 21 ng.mL−1) and (F) the same PD individual after treatment with desferal; (G) a female PD individual (serum ferritin: 568 ng.mL−1) and (H) the same PD individual after treatment with desferal. Major and minor axes indicated on the RBCs, as determined by the C# program written for the analysis. Scale bar = 5 μm.
Figure 11
Figure 11
Relationship for all cases and controls between 3ratio and Hoehn-Yahr grade. No desferal was added. “Empty” means that these data on years with disease were not recorded.
Figure 12
Figure 12
Representative force-distance curves obtained on erythrocytes from healthy individuals, individuals suffering from Parkinson's disease, individuals suffering from Parkinson's disease with high serum ferritin and the same individuals suffering from Parkinson's disease with high serum ferritin after treatment with desferal.
Figure 13
Figure 13
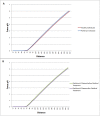
Representative force-distance curves showing the difference between: (A) Healthy individuals and individuals suffering from Parkinson's disease. (B) Individuals suffering from Parkinson's disease with high serum ferritin and the same individuals suffering from Parkinson's disease with high serum ferritin after treatment with Desferal. Force-Distance curves show the atomic force microscope (AFM) cantilever deflection range on the cell surface.

References

    1. Saracchi E, Fermi S, Brighina L. Emerging candidate biomarkers for Parkinson's disease: a review. Aging and disease. 2014;5:27–34. - PMC - PubMed
    1. Xu J, Gong DD, Man CF, Fan Y. Parkinson's disease and risk of mortality: meta-analysis and systematic review. Acta neurologica Scandinavica. 2014;129:71–79. - PubMed
    1. Reeve A, Simcox E, Turnbull D. Ageing and Parkinson's disease: Why is advancing age the biggest risk factor? Ageing research reviews. 2014;14C:19–30. - PMC - PubMed
    1. Isaya G. Mitochondrial iron-sulfur cluster dysfunction in neurodegenerative disease. Frontiers in pharmacology. 2014;5:29. - PMC - PubMed
    1. Romero-Ramos M, von Euler Chelpin M, Sanchez-Guajardo V. Vaccination strategies for Parkinson disease: Induction of a swift attack or raising tolerance? Human vaccines & immunotherapeutics. 2014;10 - PMC - PubMed

Publication types