. 2015 Jan 16;290(3):1522-35.
doi: 10.1074/jbc.M114.603902. Epub 2014 Nov 19.

Crystal structure of snake venom acetylcholinesterase in complex with inhibitory antibody fragment Fab410 bound at the peripheral site: evidence for open and closed states of a back door channel

Affiliations

Crystal structure of snake venom acetylcholinesterase in complex with inhibitory antibody fragment Fab410 bound at the peripheral site: evidence for open and closed states of a back door channel

Yves Bourne et al. J Biol Chem. .

Abstract

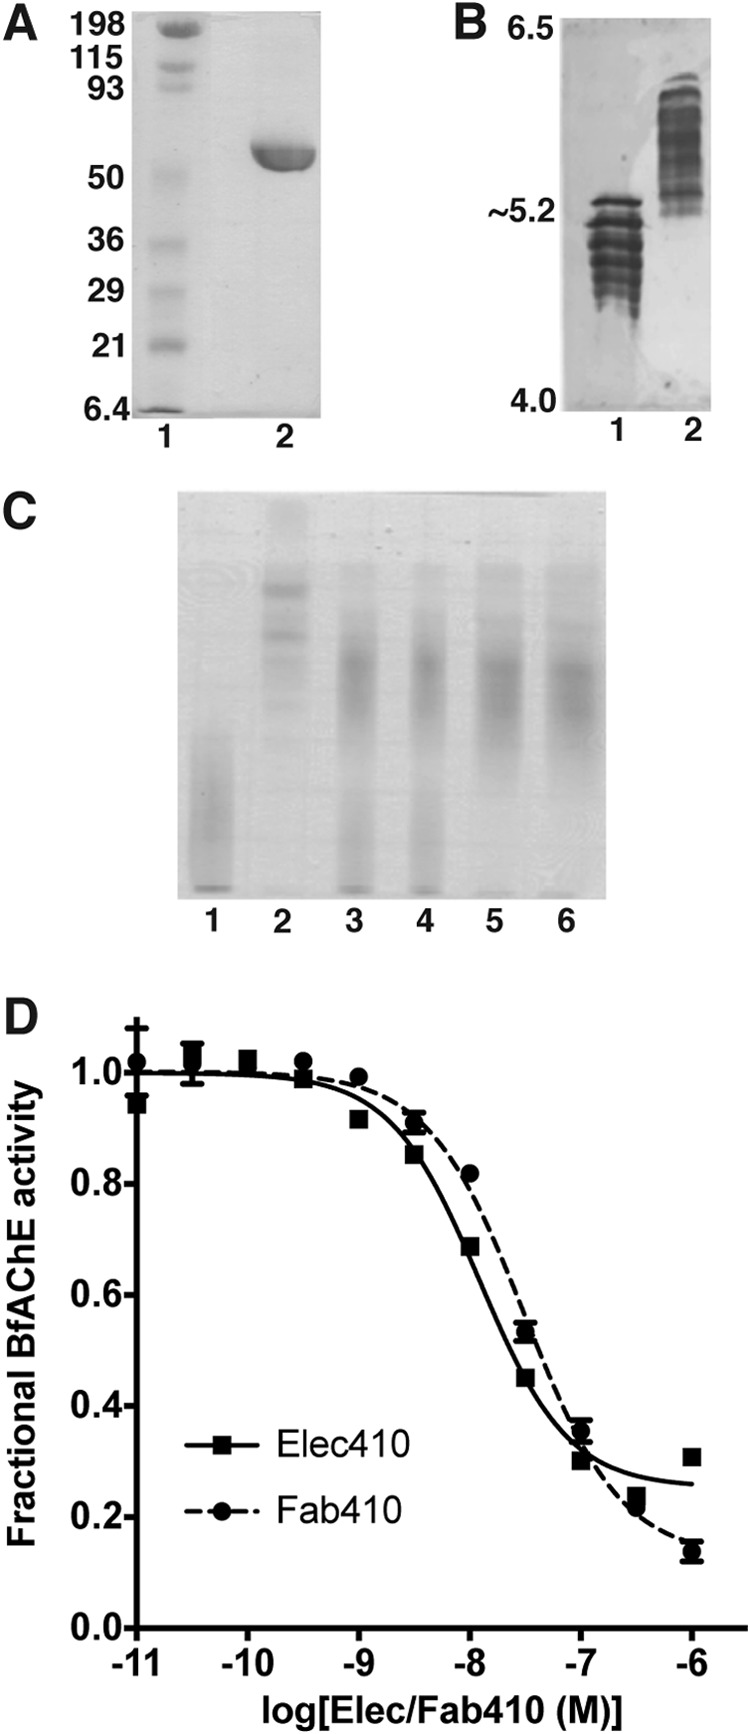
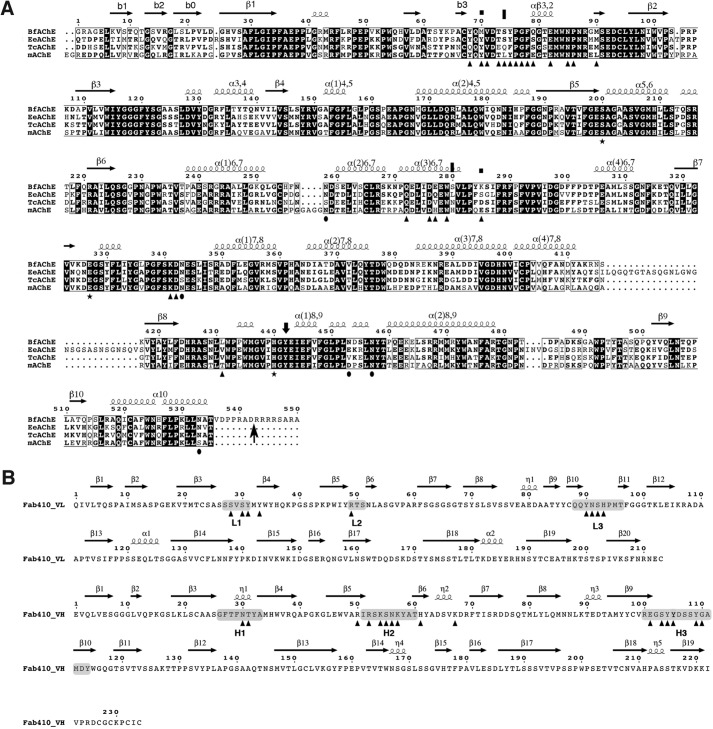
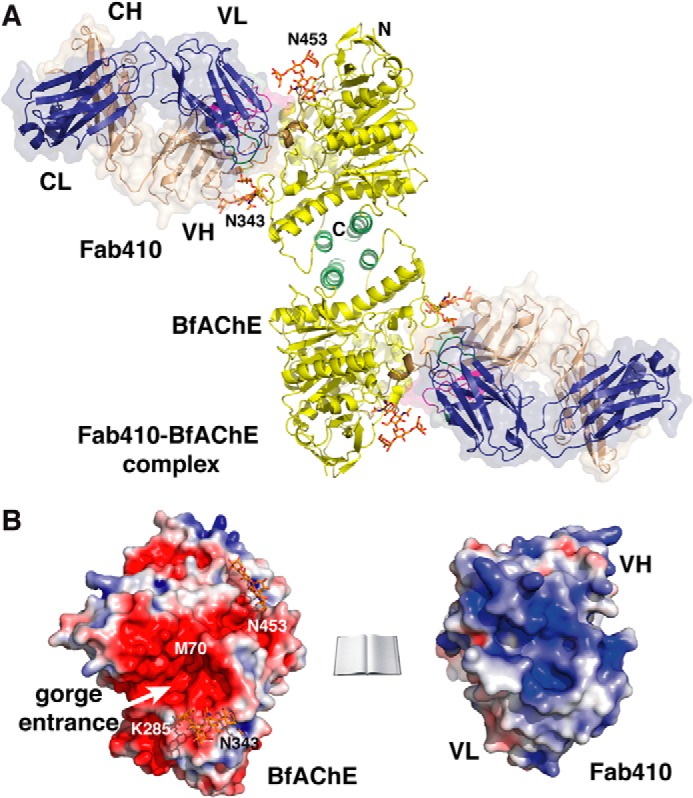
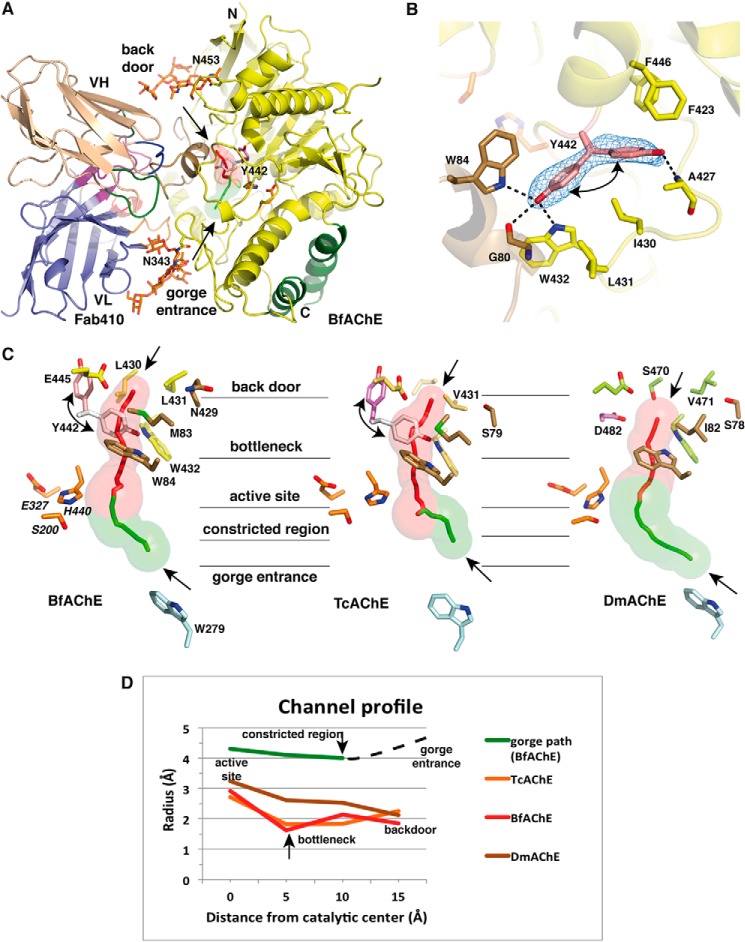
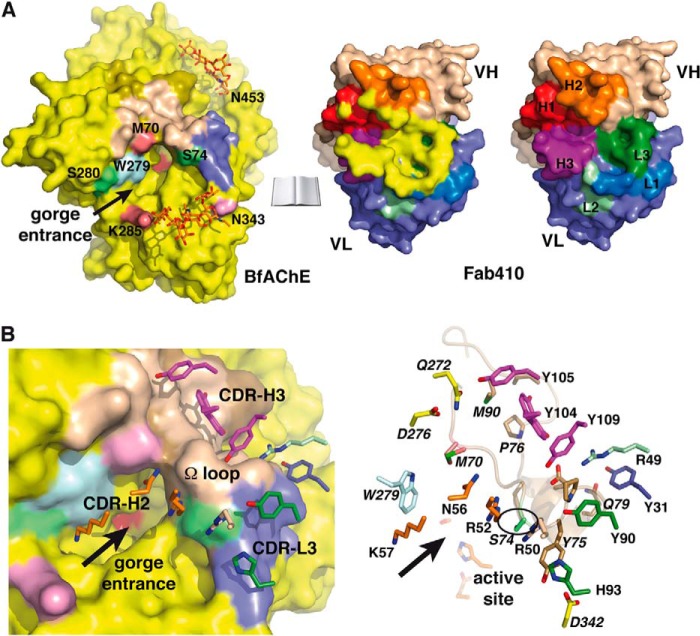
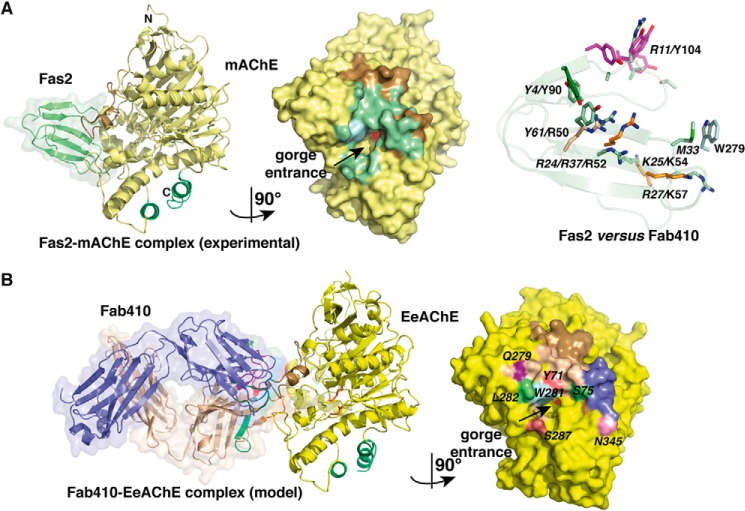
The acetylcholinesterase found in the venom of Bungarus fasciatus (BfAChE) is produced as a soluble, non-amphiphilic monomer with a canonical catalytic domain but a distinct C terminus compared with the other vertebrate enzymes. Moreover, the peripheral anionic site of BfAChE, a surface site located at the active site gorge entrance, bears two substitutions altering sensitivity to cationic inhibitors. Antibody Elec410, generated against Electrophorus electricus acetylcholinesterase (EeAChE), inhibits EeAChE and BfAChE by binding to their peripheral sites. However, both complexes retain significant residual catalytic activity, suggesting incomplete gorge occlusion by bound antibody and/or high frequency back door opening. To explore a novel acetylcholinesterase species, ascertain the molecular bases of inhibition by Elec410, and document the determinants and mechanisms for back door opening, we solved a 2.7-Å resolution crystal structure of natural BfAChE in complex with antibody fragment Fab410. Crystalline BfAChE forms the canonical dimer found in all acetylcholinesterase structures. Equally represented open and closed states of a back door channel, associated with alternate positions of a tyrosine phenol ring at the active site base, coexist in each subunit. At the BfAChE molecular surface, Fab410 is seated on the long Ω-loop between two N-glycan chains and partially occludes the gorge entrance, a position that fully reflects the available mutagenesis and biochemical data. Experimentally based flexible molecular docking supports a similar Fab410 binding mode onto the EeAChE antigen. These data document the molecular and dynamic peculiarities of BfAChE with high frequency back door opening, and the mode of action of Elec410 as one of the largest peptidic inhibitors targeting the acetylcholinesterase peripheral site.

Keywords: Acetylcholinesterase (AChE); Back Door Channel; Enzyme Mechanism; Homology Modeling; Monoclonal Antibody; Peripheral Anionic Site; Regulation of Catalysis; Snake Venom; X-ray Crystallography.


Figures

FIGURE 1.
FIGURE 1.
Functional and electrophoretic characterization of BfAChE and its Elec410 and Fab410 complexes. A, SDS-PAGE of BfAChE (non-reducing conditions; 12.5% PhastGel). The molecular weight markers are displayed and labeled. B, comparative isoelectric focusing analysis of mAChE (lane 1) and BfAChE (lane 2) (pI 4.0–6.5 PhastGel). The pI limits of the gel are indicated. BfAChE is as heterogeneous in charge as mAChE, but it displays higher overall pI value. C, native PAGE (7.5% PhastGel) of BfAChE (lane 1), Fab410 (lane 2), and pre-incubated Fab410/BfAChE mixtures in a 0.75:1, 0.9:1, 1:1, and 1.2:1 molar ratio (lanes 3–6) with migration from the cathode (top) toward the anode (bottom). The cationic character of Fab410 is evident. Both BfAChE and Fab410 are homogenous in mass but not in charge, due to heterogeneous N-glycosylation of natural BfAChE (38, 67) and nonspecific C-terminal processing of Fab410 by papain (32); however, all isoforms form complexes as assessed by the inhibition curves (D; below) and further verified by analytical gel filtration (not shown). D, inhibition of BfAChE by Elec410 and Fab410 at equilibrium (individual experiments). Data points correspond to the average ± variation of duplicates. Non-linear fitting used a sigmoidal equation. The slight difference in the IgG (squares) and Fab (circles) affinities for BfAChE may reflect their relative avidity. The significant residual (fractional) activity of BfAChE at near saturating concentrations of Elec410 or Fab410 is evident. Mean IC50 and residual activity values from three to four independent experiments are reported in Table 1 as are those for the inhibition of EeAChE.
FIGURE 2.
FIGURE 2.
Sequences of the AChE species mentioned in this study and of Fab410. A, the sequences of BfAChE from snake venom, TcAChE and EeAChE from electric fishes, and mAChE from mouse are displayed (38, 45, 78, 79). The residue numbering and secondary structure elements displayed above the alignment are those of BfAChE. Conserved residues are shown on a black background, and non-conserved residues are shown on a white background. The symbols above the alignment point to BfAChE-specific PAS residues Met70 and Lys285 (squares) and to EeAChE residues whose substitution by rat AChE residues abolished (S75L for BfAChE Ser74) or reduced (L282H for BfAChE Ser280) Elec410 binding (45) (vertical bars). The symbols below the alignment point to the conserved catalytic triad residues (stars), to BfAChE residues buried at the Fab410 complex interface (triangles), and to BfAChE Asn residues within consensus N-glycosylation sequences (38) (closed circles). The arrow at the BfAChE C terminus denotes the end of the mature protein (38). B, sequences of the Fab410 L (top) and H (bottom) chains showing the CDR positions (shaded) and secondary structure elements. Fab410 residues buried at the BfAChE complex interface are indicated by triangles. In the structure, a Trp was found at position 200 of the H chain instead of an Arg as published previously (32). For an alignment of Fab410 with Fab403 and Fab408, see Fig. 1 in Bourne et al. (32).
FIGURE 3.
FIGURE 3.
Overall structure of the Fab410-BfAChE complex and electrostatic properties of the binding surfaces. A, two BfAChE subunits related by a 2-fold symmetry axis and linked through a tightly packed four-helix bundle made of their α37,8 and α10 helices assemble as a non-covalent antiparallel dimer. Two Fab410 molecules are bound on opposite faces of the dimer with their CDRs tightly apposed to the PAS regions. The BfAChE subunits are displayed in yellow with labeled N and C termini, a green four-helix bundle at the dimer interface, a brown long Ω loop at the complex interface, red catalytic residues at the center of the subunits, and orange N-glycan moieties linked to Asn343 and Asn453 (labeled). The Fab410 L and H chains and their molecular surfaces are displayed in dark blue and wheat, respectively. CDRs L1, L2, and L3 are displayed in blue, light green, and dark green, and CDRs H1, H2, and H3 are displayed in red, orange, and purple, respectively, with a clearly visible extended CDR H2 (see also Figs. 4A and 5A, right panel). B, distribution of the electrostatic potentials mapped onto the molecular surfaces of BfAChE (left) and Fab410 (right) at −3kT/e (red) to +3kT/e (blue) (molecules not on scale). The charge complementarity of the electronegative binding surface on BfAChE, which is centered on the gorge entrance (white arrow), versus the electropositive combining site in Fab410, which is centered on the H chain CDRs, is evident. The N and C termini of the BfAChE subunit, key residues Met70 and Lys285, and the N-glycosylated Asn453 and Asn343 are labeled.
FIGURE 4.
FIGURE 4.
The back door region in Fab410-bound BfAChE and comparison with other AChEs. A, overall view of the Fab410-BfAChE complex (one subunit only) slightly rotated from Fig. 3A (top subunit) to better show the solvent-accessible paths in BfAChE. The lining walls of the active site gorge and back door channel are shown as transparent green and red surfaces, and their pathways are shown as green and red center lines, respectively (other color codes are as in Fig. 3A). B, omit electron density maps contoured at 3.0σ of the back door region in BfAChE showing the two equally represented alternate conformations of Tyr442 and their respective interactions with neighboring residues stabilized by H-bonds (dashed lines). C, close-up views of the continued path from the PAS at the gorge entrance to the back door region in BfAChE (left), TcAChE (center) (PDB code 2XI4) and DmAChE (right) (PDB code 1DX4) in the same orientation with green and red lining walls for the active site gorge and back door channel (see A). BfAChE and TcAChE Tyr442 in the rotated conformation and DmAChE Asp482 are displayed in pink, whereas BfAChE and TcAChE Tyr442 in the usual conformation are in white. Key side chains from the long Ω loop are in brown, and those lining the channel are in yellow for BfAChE, light orange for TcAChE, and green for DmAChE. In BfAChE and TcAChE, Tyr442 in the rotated conformation points toward a neighboring hydrophobic pocket and leaves the back door channel open, whereas in DmAChE, Asp482 is too small to occlude the channel. D, profiles of the back door channel in BfAChE (red line), TcAChE (orange line), and DmAChE (brown line) and of the gorge path in BfAChE up the constricted region midway in the gorge (green line) as calculated by CAVER. (The dotted line denotes the gorge path between the constricted region and the gorge entrance that was ignored by the program.)
FIGURE 5.
FIGURE 5.
The Fab410-BfAChE complex interface. A, overall views of the buried interfaces at the molecular surfaces of BfAChE (left) (same color codes as in Figs. 3A and 4A) and Fab410 (center) (yellow buried surface overlaid onto the CDRs colored as in Figs. 3A and 4A and in the right panel) in the complex (molecules oriented 90° from each other; not drawn on scale). The positions for Met70 and Lys285, which distinguish the PAS of BfAChE from those of other AChEs, are shown in violet; that for Trp279 (Trp279/280/286 in TcAChE/EeAChE/mAChE) is in light blue; those for Ser74 and Ser280, corresponding to EeAChE Ser75 and Leu282 whose substitution by rat AChE residues alters Fab410 binding, are in green; and that for Asn343, corresponding to EeAChE Asn345 whose deglycosylation enhances Fab410 binding, is in pink. Right, the Fab410 combining surface with only the colored CDRs. B, close-up views of the Fab410-BfAChE complex interface with (left) and without (right) the molecular surface of BfAChE showing the key BfAChE residues (italicized labels; encircled Ser74) and Fab410 CDR residues (same orientation and color codes as in A with red oxygen and blue nitrogen atoms). The arrows point to the BfAChE active site gorge entrance.
FIGURE 6.
FIGURE 6.
Comparison of the Fab410-BfAChE complex with other peptidic inhibitor-AChE complexes. A, overall views of the crystalline Fas2-mAChE complex (left) (PDB code 1KU6) and the 1029-Å2 buried interface at the mAChE surface in this complex (center) (left and right mAChE molecules are oriented 90° from each other). Fas2 is displayed in light green, and mAChE Trp286 is in light blue (other color codes as in Fig. 3A). Right, spatial alignment of the key interacting aromatic and positively charged side chains in BfAChE-bound Fab410 (plain labels; color codes as in Fig. 5) and mAChE-bound Fas2 (italicized labels; green side chains) overlaid onto the Fas2 backbone (light green ribbon). Their similar positioning along with the absence of a Fab410 residue mimicking Fas2 Met33 in its interaction with Trp279 (displayed in light blue on the right) is evident. B, overall views of the theoretical model of the Fab410-EeAChE complex (left) and the 1017-Å2 buried interface at the EeAChE surface in this complex (right) (left and right EeAChE molecules are oriented 90° from each other). In the right panel, the buried EeAChE surface is colored according to the L chain and H chain CDRs in bound Fab410 (see Fig. 5A), and EeAChE Ser75, Leu282, and Asn345 are color-coded as in Fig. 5.

References

    1. Massoulié J., Pezzementi L., Bon S., Krejci E., Vallette F. M. (1993) Molecular and cellular biology of cholinesterases. Prog. Neurobiol. 41, 31–91 - PubMed
    1. Taylor P., Radić Z. (1994) The cholinesterases: from genes to proteins. Annu. Rev. Pharmacol. Toxicol. 34, 281–320 - PubMed
    1. Silman I., Sussman J. L. (2008) Acetylcholinesterase: how is structure related to function? Chem. Biol. Interact. 175, 3–10 - PubMed
    1. Sussman J. L., Harel M., Frolow F., Oefner C., Goldman A., Toker L., Silman I. (1991) Atomic structure of acetylcholinesterase from Torpedo californica: a prototypic acetylcholine-binding protein. Science 253, 872–889 - PubMed
    1. Quinn D. M. (1987) Acetylcholinesterase: enzyme structure, reaction dynamics, and virtual transition states. Chem. Rev. 87, 955–979

Publication types

LinkOut - more resources