

Pathway connectivity and signaling coordination in the yeast stress-activated signaling network
- PMID: 25411400
- PMCID: PMC4299600
- DOI: 10.15252/msb.20145120
Pathway connectivity and signaling coordination in the yeast stress-activated signaling network
Abstract
Stressed cells coordinate a multi-faceted response spanning many levels of physiology. Yet knowledge of the complete stress-activated regulatory network as well as design principles for signal integration remains incomplete. We developed an experimental and computational approach to integrate available protein interaction data with gene fitness contributions, mutant transcriptome profiles, and phospho-proteome changes in cells responding to salt stress, to infer the salt-responsive signaling network in yeast. The inferred subnetwork presented many novel predictions by implicating new regulators, uncovering unrecognized crosstalk between known pathways, and pointing to previously unknown 'hubs' of signal integration. We exploited these predictions to show that Cdc14 phosphatase is a central hub in the network and that modification of RNA polymerase II coordinates induction of stress-defense genes with reduction of growth-related transcripts. We find that the orthologous human network is enriched for cancer-causing genes, underscoring the importance of the subnetwork's predictions in understanding stress biology.
Keywords: environmental stress; integer programming; proteomics; signal transduction; transcriptomics.
© 2014 The Authors. Published under the terms of the CC BY 4.0 license.
Figures


The input to the method includes a background network of yeast interactions combined with experimental data that describes the yeast salt stress response, including proteins with phospho-changes (yellow), fitness contribution (blue), or two known upstream regulators (pink), as described in the key.
The three different types of paths that we enumerate using the background network and experimental data, where ‘hit’ refers to proteins identified in the original fitness screen or with significant changes in phosphorylation.
The IP for subnetwork inference and the output ensemble of inferred subnetworks.
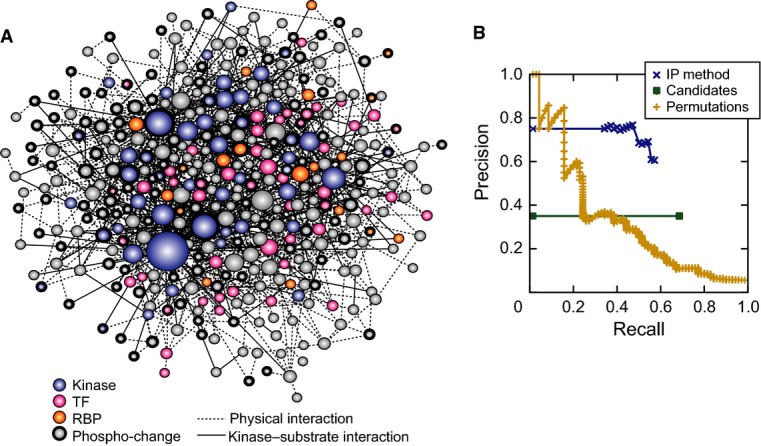
Inferred consensus subnetwork at 75% confidence, where node size indicates degree (number of connections) and color is according to the key. Nodes representing proteins with phospho-changes are outlined in bold.
Precision–recall of the inferred consensus network was calculated using a list of true positives from the literature and a list of likely negatives, after excluding proteins with phospho-changes and those required for fitness (see Materials and Methods). Precision is the fraction of predicted nodes known to be involved in the osmo response, and recall is the fraction of true positives that are above the threshold. The curves represent the performance of the IP method on the real data (blue), of the method on randomized permutations of the input network (yellow), and of the candidate enumerated pathways used as input (green, see Materials and Methods).

A subregion of the inferred subnetwork, highlighting proteins in known pathways according to the key. Hexagons represent interrogated ‘source’ regulators, nodes outlined in bold indicate validated players in the NaCl response, and asterisks represent proteins with phospho-changes upon NaCl treatment. Dashed edges represent physical interactions and solid arrows indicate kinase–substrate relationships. Edge directionality is as predicted by the inference, and edge color is according to the edge's source node. Inhibitory edges were taken from the literature.
Connectivity between known pathways, where blue boxes represent the number of interactions between any members of two pathways. Pathway membership is indicated in parentheses.
The top 15-ranked ‘integrator’ nodes with connections to the greatest number of different pathways, as shown in (B).
A purified CTD peptide was incubated with Hrr25-TAP or Hog1-TAP purified from cells with and without NaCl treatment for 10 min, incubated with and without the reversible p38-specific inhibitor SB203580 (INH) added in vitro. Reactions with buffer or yeast whole-cell extract (WCE) served as negative and positive controls, respectively. CTD phosphorylated on serine 2 (Ser2) or Ser5 was detected by immunoblotting (see Materials and Methods). TAP-tagged proteins were subsequently quantified on the same blot with the anti-TAP antibody. Quantification of Hog1 phosphorylation, shown to the right, was normalized to Hog1-TAP abundance and then to the corresponding unstressed sample.

A Wild-type (WT) and cdc14-3 cells were shifted to 35°C for 90 min and then exposed to 0.7 M NaCl for up to 20 min. Images represent nuclear DNA (DAPI, left) and Hog1-GFP (right) before and at 10 min after NaCl treatment. The plot below quantifies the fraction of cells (n ≥ 75) with nuclear Hog1-GFP signal that overlapped the DAPI signal, in WT and cdc14-3 cells.
B Levels of phospho-Hog1 normalized to total Hog1 in WT and cdc14-3 cells responding to NaCl at 35°C. Data represent the average of biological duplicates (paired t-test).
C, D GST-tagged Cka2 (C) or GST-tagged Cka1 (D) were immunoprecipitated and blotted for Cdc14 and total or phospho-Hog1.
E The average log2 fold-change of 67 Hot1 targets in replicated WT, hog1Δ, cdc14-3, and cka2Δ strains responding to NaCl. Data for each mutant and its paired WT were scaled to the plotted WT so as to accurately represent the mutant defect. Asterisks represent a significant difference in the mutant versus its paired WT (paired t-test).
F Expression data in WT or cdc14-3 cells responding to NaCl at the non-permissive temperature and in cdc14-3 cells versus WT at the non-permissive temperature before NaCl addition. Each column represents one of three triplicated expression responses, and each row represents one of 131 cell cycle genes aberrantly induced in cdc14-3 after NaCl treatment (FDR < 0.05). Red represents higher and green represents lower expression in response to NaCl (or in the cdc14-3 mutant in the case of the last columns), according to the key. Cell cycle classification of the genes (Spellman et al, 1998) is shown to the right; cyclins are annotated to the left.
G Average log2 expression change of genes shown in (F), as described in (E).

Regulators predicted to lie upstream of iESR, RP, and/or RiBi ESR modules are color-coded according to the key and sized according to degree (number of connections). Diamonds and triangles represent TFs and RBPs, respectively.
Average log2 expression changes of iESR, RP, or RiBi genes in mutants responding to salt. Wild-type (WT) levels are highlighted by shaded areas; genes with a significant defect (P < 1e-6, paired t-test) are indicated with an asterisk.
Same as (A) but organized by ESR regulatory potential. Top-ranked bifurcation nodes discussed in the text are colored white. Nested orange nodes represent iESR TFs that are also predicted to lie upstream of RP paths.

Relative abundance of bulk Ser5P (left) and Ser2P (right) normalized to an internal Rpb3 loading control, from yeast cells treated with NaCl for the denoted times. Data are representative of several replicates.
The average log2 fold-change expression of iESR, RP, and RiBi genes is shown for paired wild-type and hog1Δ strains (as in Fig 7) and paired wild-type, S2A, and S5 strains. There was little expression difference in the S2A and S5A mutants versus wild-type before stress (right bars).
Average log2 fold-change in Rpb3 occupancy 20 min after NaCl treatment at ± 500 bp around the transcription start site (TSS) of iESR (left), RiBi (middle), and RP (right) genes. Profiles were reproducible across biological replicates (see Supplementary Fig S7).
References
-
- Abdulrehman D, Monteiro PT, Teixeira MC, Mira NP, Lourenço AB, dos Santos SC, Cabrito TR, Francisco AP, Madeira SC, Aires RS, Oliveira AL, Sá-Correia I, Freitas AT. YEASTRACT: providing a programmatic access to curated transcriptional regulatory associations in Saccharomyces cerevisiae through a web services interface. Nucleic Acids Res. 2011;39:D136–D140. - PMC - PubMed
-
- Adrover MA, Zi Z, Duch A, Schaber J, Gonzalez-Novo A, Jimenez J, Nadal-Ribelles M, Clotet J, Klipp E, Posas F. Time-dependent quantitative multicomponent control of the G(1)-S network by the stress-activated protein kinase Hog1 upon osmostress. Sci Signal. 2011;4:ra63. - PubMed
Publication types
MeSH terms
Substances
Grants and funding
LinkOut - more resources
Full Text Sources
Other Literature Sources
Molecular Biology Databases
