Review
. 2015 Jan 6;12(102):20141117.
doi: 10.1098/rsif.2014.1117.

Multi-haem cytochromes in Shewanella oneidensis MR-1: structures, functions and opportunities

Affiliations
Review

Multi-haem cytochromes in Shewanella oneidensis MR-1: structures, functions and opportunities

Marian Breuer et al. J R Soc Interface. .

Abstract

Multi-haem cytochromes are employed by a range of microorganisms to transport electrons over distances of up to tens of nanometres. Perhaps the most spectacular utilization of these proteins is in the reduction of extracellular solid substrates, including electrodes and insoluble mineral oxides of Fe(III) and Mn(III/IV), by species of Shewanella and Geobacter. However, multi-haem cytochromes are found in numerous and phylogenetically diverse prokaryotes where they participate in electron transfer and redox catalysis that contributes to biogeochemical cycling of N, S and Fe on the global scale. These properties of multi-haem cytochromes have attracted much interest and contributed to advances in bioenergy applications and bioremediation of contaminated soils. Looking forward, there are opportunities to engage multi-haem cytochromes for biological photovoltaic cells, microbial electrosynthesis and developing bespoke molecular devices. As a consequence, it is timely to review our present understanding of these proteins and we do this here with a focus on the multitude of functionally diverse multi-haem cytochromes in Shewanella oneidensis MR-1. We draw on findings from experimental and computational approaches which ideally complement each other in the study of these systems: computational methods can interpret experimentally determined properties in terms of molecular structure to cast light on the relation between structure and function. We show how this synergy has contributed to our understanding of multi-haem cytochromes and can be expected to continue to do so for greater insight into natural processes and their informed exploitation in biotechnologies.

Keywords: Marcus theory; cytochrome; electron transfer; haem; redox potential; respiration.


Figures

Figure 1.
Figure 1.
(a) Two different haem types found in biological systems. The structure of haem c includes covalent thioether linkages to the protein. (b) Binding of haem c via the C-X1-X2-CH-binding motif (providing the proximal axial histidine ligand) and with histidine as the distal axial ligand.
Figure 2.
Figure 2.
Overview of strategies for respiratory electron transport during the anaerobic growth of S. oneidensis. The oxidation of organic molecules releases electrons to the IM. From the IM electrons may pass to soluble terminal electron acceptors (black circle) that enter the periplasm. Alternatively, the electrons may cross the periplasm and the OM to be delivered to extracellular terminal electron acceptors. ET from the cell surface may be mediated by flavin (F) (a), occur directly from an extracellular cytochrome (b) or involve cellular appendages called nanowires (c). OM spanning complexes homologous to MtrAB are represented by the blue rectangle with a red stripe. Extracellular cytochromes homologous to MtrC are represented by the red rectangle.
Figure 3.
Figure 3.
Multi-haem cytochromes from S. oneidensis illustrated schematically to indicate their cellular location and roles. High-resolution structures are presented for proteins from S. oneidensis STC (pdb entry: 2K3V), NrfA (3UBR), OTR (1SP3), FccA (1QJD), MtrF (3PMQ) and OmcA (4LMH) and their homologues NapAB (1OGY), CymA (2J7A), TorC (2J7A) and TorA (1TMO). Cartoons illustrate the OM spanning porin : cytochrome complex for which no structures are available and the IM associated processes that generate ATP and pass electrons to Q in the IM. The arrangement of cofactors in DmsAB is based on that in the homologue NarGH (1R27). Haems (orange), FeS clusters (yellow/green), FAD (cyan) and molybdopterin (purple).
Figure 4.
Figure 4.
Haem packing motifs found in multi-haem cytochromes. (a) ‘Stacked’; (b) perpendicular or ‘T-shaped’; (c) ‘coplanar’. In each panel the lower images show the haems rotated by 90° relative to the upper images.
Figure 5.
Figure 5.
Haem chains in tetra-haem cytochromes from S. oneidensis. (a) The quinol oxidase CymA (haem chain from the homologous NrfH from D. vulgaris shown in lieu of resolved structure for CymA). (b) The periplasmic electron shuttle STC. (c) The fumarate reductase FccA, also including the FAD cofactor (cyan). PDB codes as for figure 3.
Figure 6.
Figure 6.
Haems in two periplasmic N/S oxoanion reductases from S. oneidensis: (a) NrfA and (b) OTR. The catalytic haem is highlighted in green for each cytochrome. PDB codes as for figure 3.
Figure 7.
Figure 7.
Haems in OM-associated deca-haem cytochromes from S. oneidensis. (a) The staggered cross from the OM cytochrome MtrF (pdb entry: 3PMQ). (b) Model for the haem arrangement in MtrA (associated with the periplasmic side of the OM) based on two NrfB units (2OZY).
Figure 8.
Figure 8.
Protein film electrochemistry of multi-haem cytochromes from S. oneidensis. Cyclic voltammetry of CymA (solid line) adsorbed on an 8-mercaptoctanol modified template stripped gold electrode at a 10 mV s−1 scan rate, pH 7.4 is compared to a voltammogram recorded in the absence of CymA (broken line) (redrawn from [34]). Baseline-subtracted cyclic voltammograms are presented for MtrCAB, MtrA, MtrC and MtrF adsorbed on graphite electrodes. Voltammetry was recorded at 30 mV s−1, pH 7 and the peaks are presented as normalized to their respective peak currents (redrawn from [42,72]). For MtrF, a single n = 1 response with average Em of −312 mV accounts for one-tenth of the peak area and describes the low-potential flanks of the peaks.
Figure 9.
Figure 9.
Comparison of cofactor arrangements and free energy landscapes for MtrF (microscopic redox potentials), a bacterial photosynthetic reaction centre and mitochondrial complex I (both macroscopic potentials). (ac) Present free energy landscapes for each system; see corresponding in (df) for the respective cofactor arrangement. (a) Free energy landscape for the 10 haems in MtrF [91]. The red bars along the vertical axis represent (unassigned) macroscopic potentials derived from the protein film voltammetry presented in [72]. (Adapted from [91].) (b) Free energy landscape for the four haems and the bacteriochlorophyll dimer (BChl2) in the photosynthetic reaction centre of Rps. viridis [92]. (c) Free energy landscape for the FeS cluster ET chain in bovine mitochondrial complex I [93,94], including estimates for the three low-potential clusters (below −0.4 V) [88]. (d) Visualization of the free energy landscape within the molecular structure of MtrF: haems are coloured according to their redox potential, with lighter colours corresponding to lower redox potentials and thus a higher position in the free energy landscape. The two proprionates exerting a strong influence on the potentials of haems 4 and 9, respectively, are highlighted in red. (Adapted from [91].) (e) The haem chain+BChl2 dimer in the photosynthetic reaction centre of Rps. viridis (pdb entry 1PRC [95]). (f) The FeS cluster chain in bovine mitochondrial complex I of (pdb entry 4UQ8 [96]).
Figure 10.
Figure 10.
Marcus free energy parabolas for ET through MtrF [106] as obtained from redox potentials and reorganization free energies [106]. Haem arrangement as in figure 9. (Adapted from [106].)
Figure 11.
Figure 11.
Thermally sampled couplings (|Hab|, left vertical axis) and resulting maximal ET rates (right vertical axis) for the nine haem pairs in MtrF plotted versus the respective haems' edge-to-edge distance. The colour code corresponds to the three haem pair motifs described in §3: stacked (blue), T-shaped (red) and coplanar (green). Triangles represent couplings obtained for the crystal structure; black circles represent RMS bin averages; black solid lines show exponential fits to the bins; and the dotted and dashed line represent the Moser–Dutton ruler with the default (dotted) and a reduced packing density (dashed), respectively. (Adapted from [115].)
Figure 12.
Figure 12.
Kinetics of ET through MtrF as obtained via equation (4.1), and juxtaposition of constituent quantities. (a) Individual ET rates for each pair in forward (left → right, dark bars) and backward direction (right → left, light bars). (b) The free energy landscape for ET through MtrF (as in figure 9) together with the RMS coupling formula image 
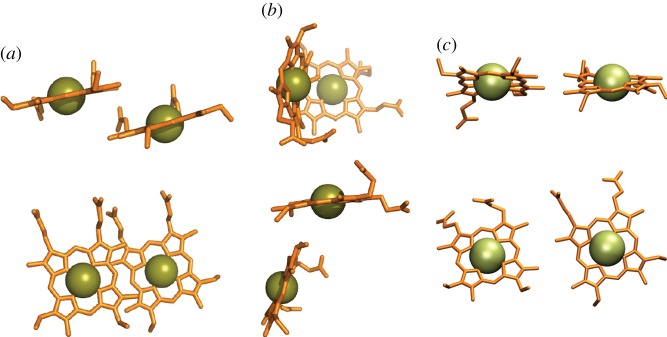
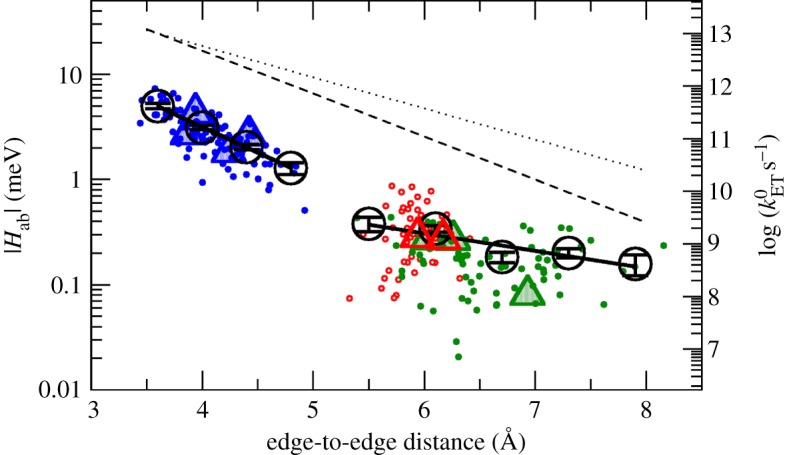
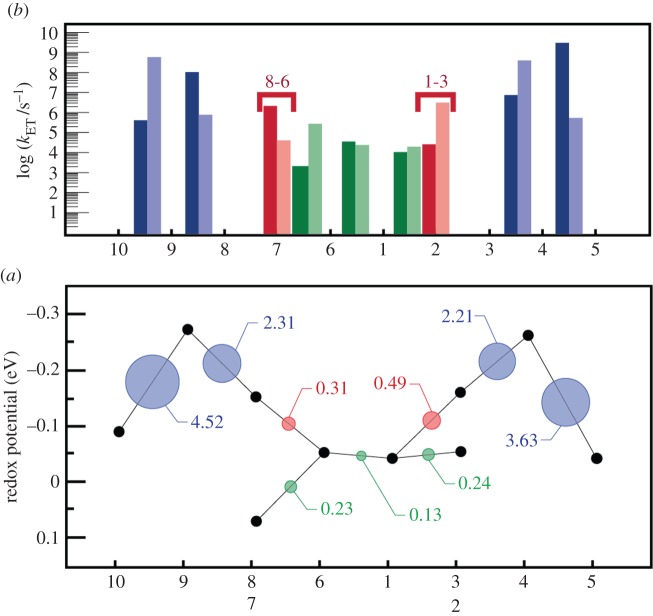
for each pair (circles, area proportional to the coupling). The colour code of the circles corresponds to the three haem pair motifs as in figure 11. (Adapted from [115].)
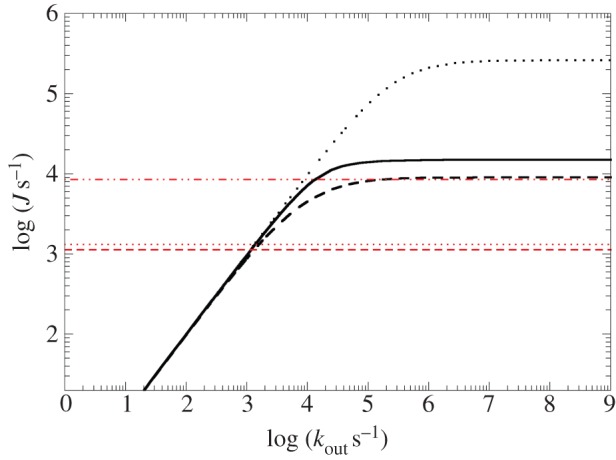
Figure 13.
Figure 13.
Modelling of steady-state electron flow J through MtrF based on the individual haem-to-haem ET rates in figure 11 (and as a function of the terminal heterogeneous rate, kout). Black solid line: 10 → 5; black dashed line: 10 → 2; black dotted line: 10 → 7. The red horizontal lines represent experimentally measured electron fluxes through MtrCAB towards different iron oxides (lepidocrocite (dashed dotted), hematite (dotted) and goethite (dashed)). (Adapted from [115].)
Figure 14.
Figure 14.
UndA with soluble substrates bound. (a) Fe(III)-NTA and (b) Fe(III)-citrate trimer. The close-by haem (7 in UndA's numbering) is emphasized.
Figure 15.
Figure 15.
TS experiments. (a) IV tunnelling conductance spectra of OmcA (red) and MtrC (blue) single molecules within monolayers (inset) on Au(111) (black) showing deviations from the smoothly varying exponential dependence of the tunnelling probability for MtrC. Redrawn from [150]. (b) The normalized differential conductance from these deviations comprises peaks in the densities of states (DOS) of MtrC at the tip, that can be fit with a vibrationally incoherent electron tunnelling model consistent with participation of haem cofactors assisting the electron conductance. (Adapted from [151].)
Figure 16.
Figure 16.
Solvent accessibilities of haems in MtrF and possibilities for flavin-binding sites. Haems are coloured according to estimated solvent accessibilities [72], with lighter colour corresponding to higher solvent accessibility. Four FMN molecules are shown: the yellow ones next to haems 4 and 9 as the thermodynamically favourable reduction sites and the orange ones next to haems 2 and 7 as the sites with possible binding motifs [72].

Similar articles

Cited by

References

    1. Bertini I, Cavallaro G, Rosato A. 2006. Cytochrome c: occurrence and functions. Chem. Rev. 106, 90–115. (10.1021/cr050241v) - DOI - PubMed
    1. Smith LJ, Kahraman A, Thornton JM. 2010. Heme proteins—diversity in structural characteristics, function, and folding. Proteins Struct. Funct. Bioinform. 78, 2349–2368. (10.1002/prot.22747) - DOI - PubMed
    1. Sharma S, Cavallaro G, Rosato A. 2010. A systematic investigation of multiheme c-type cytochromes in prokaryotes. J. Biol. Inorg. Chem. 15, 559–571. (10.1007/s00775-010-0623-4) - DOI - PubMed
    1. Moser CC, Farid TA, Chobot SE, Dutton PL. 2006. Electron tunneling chains of mitochondria. Biochim. Biophys. Acta 1757, 1096–1109. (10.1016/j.bbabio.2006.04.015) - DOI - PubMed
    1. Volbeda A, Charon MH, Piras C, Hatchikian EC, Frey M, Fontecilla-Camps JC. 1995. Crystal structure of the nickel–iron hydrogenase from Desulfovibrio gigas. Nature 373, 580–587. (10.1038/373580a0) - DOI - PubMed

Publication types

LinkOut - more resources