. 2015 Feb 15;113(4):1249-59.
doi: 10.1152/jn.00691.2014. Epub 2014 Nov 19.

Single-trial imaging of spikes and synaptic potentials in single neurons in brain slices with genetically encoded hybrid voltage sensor

Affiliations

Single-trial imaging of spikes and synaptic potentials in single neurons in brain slices with genetically encoded hybrid voltage sensor

Nima Ghitani et al. J Neurophysiol. .

Abstract

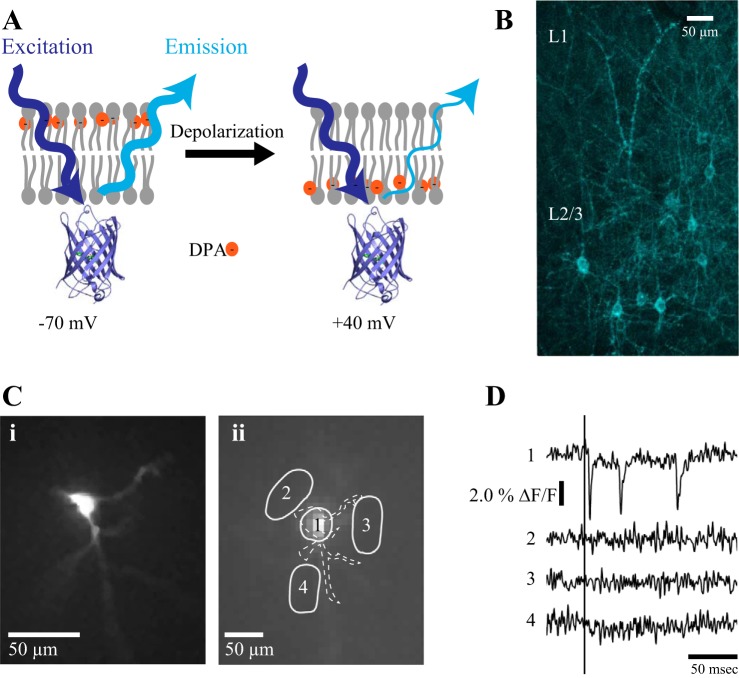
Genetically encoded voltage sensors expand the optogenetics toolkit into the important realm of electrical recording, enabling researchers to study the dynamic activity of complex neural circuits in real time. However, these probes have thus far performed poorly when tested in intact neural circuits. Hybrid voltage sensors (hVOS) enable the imaging of voltage by harnessing the resonant energy transfer that occurs between a genetically encoded component, a membrane-tethered fluorescent protein that serves as a donor, and a small charged molecule, dipicrylamine, which serves as an acceptor. hVOS generates optical signals as a result of voltage-induced changes in donor-acceptor distance. We expressed the hVOS probe in mouse brain by in utero electroporation and in transgenic mice with a neuronal promoter. Under conditions favoring sparse labeling we could visualize single-labeled neurons. hVOS imaging reported electrically evoked fluorescence changes from individual neurons in slices from entorhinal cortex, somatosensory cortex, and hippocampus. These fluorescence signals tracked action potentials in individual neurons in a single trial with excellent temporal fidelity, producing changes that exceeded background noise by as much as 16-fold. Subthreshold synaptic potentials were detected in single trials in multiple distinct cells simultaneously. We followed signal propagation between different cells within one field of view and between dendrites and somata of the same cell. hVOS imaging thus provides a tool for high-resolution recording of electrical activity from genetically targeted cells in intact neuronal circuits.

Keywords: neural circuitry; optogenetics; synaptic integration; voltage imaging.


Figures

Fig. 1.
Fig. 1.
Hybrid voltage sensor (hVOS) expression and imaging. A: illustration of the hVOS mechanism. The probe (hVOS 1.5) cerulean fluorescent protein (CeFP) is tethered to the inner leaflet of the plasma membrane by a truncated farnesylation motif (Wang et al. 2010). Negatively charged lipophilic dipicrylamine (DPA) is bath applied and partitions into the lipid bilayer. Depolarization drives DPA towards the inner leaflet where it interacts with CeFP by fluorescence resonance energy transfer (FRET) and decreases fluorescence emission. B: cortical slice from an 11-day-old mouse expressing probe by in utero electroporation. Collapsed z-series of images from a 2-photon microscope reveals sparsely distributed hVOS probe-expressing neurons in layer 2/3 of the somatosensory cortex. Ci: resting light intensity (RLI) image of a single neuron in a slice from the somatosensory cortex taken with the CCD-SMQ camera used for voltage imaging. The resolution of this image was enhanced off-line with a fractal algorithm in Perfect Resize 8 (onOne Software). Cii: same neuron at a lower magnification, with soma and surrounding regions of interest (ROI) outlined in solid white. The dashed white contour outlines the cell and its main processes. D: single trial fluorescence responses from 4 ROI in Cii containing the soma (trace 1) and 3 surrounding ROI (traces 2–4). Stimulation with a single current pulse (200 μA) applied at the time indicated by the vertical line from an electrode positioned off column and out of view in L2/3 evoked a series of 3 voltage changes. The first event followed the stimulation within a few milliseconds, and the subsequent events reflect either circuit or repetitive activity. Traces from neighboring ROI showed no fluorescence changes.
Fig. 2.
Fig. 2.
Simultaneous patch-clamp and hVOS recording. A: fluorescence image shows hVOS expression in the hippocampus and entorhinal cortex in a slice from a 2-wk-old thy1-hVOS 1.5 transgenic mouse. B: high-resolution fluorescence image of an hVOS labeled neuron in entorhinal cortex. C: CCD-SMQ RLI image of the neuron in B, with simultaneous whole cell patch-clamp recording indicated. D: depolarizing 200-ms current pulses of increasing amplitude (300, 500, 600, and 700 pA) elicited voltage changes visible in single trials. The smallest current pulse elicited a subthreshold voltage change and the larger pulses also elicited spikes. E: hVOS trace from the 2nd column of D was inverted, normalized, and superimposed on the simultaneously recorded voltage trace.
Fig. 3.
Fig. 3.
hVOS recording from 10 labeled neurons. A: layer 2/3 of a slice of somatosensory cortex from an animal expressing hVOS probe by in utero electroporation, 10 labeled neurons were visible in a fluorescence image. B: superimposing fluorescence and DIC shows the labeled cells, the surrounding slice, and the stimulating electrode in layer 4. C: RLI image with the CCD-SMQ showed the 10 neurons with their somata circled and numbered. D: single-trial hVOS recordings from the neurons indicated in C show optical responses to 100- and 200-μA stimuli applied at the vertical lines.
Fig. 4.
Fig. 4.
Spike thresholds in somatosensory cortex neurons. A: fluorescence image from a slice of somatosensory cortex from an animal expressing hVOS probe by in utero electroporation with 2 labeled neurons in layer 2/3. B: fluorescence-DIC image shows the labeled neurons, surrounding tissue, and stimulating electrode in layer 4. C: CCD-SMQ RLI image of the 2 labeled neurons in A and B with ROI containing their somata outlined and numbered. D: graded increases in stimulus current revealed the thresholds for action potentials in the 2 neurons. The stimulus currents are on the left, and time of stimulation is indicated by the vertical lines. E: 5 trial averages of responses to 260 an 310 μA from the soma of cell 1 were superimposed to show the subthreshold and suprathreshold responses.
Fig. 5.
Fig. 5.
Spike thresholds in hippocampal CA3 pyramidal cells. A: CCD-SMQ RLI image (i) revealed labeled pyramidal cells in the pyramidal cell layer of a hippocampal slice from a 13 day old thy1-hVOS 1.5 transgenic mouse. ROI containing cell somata were outlined (ii). B: single-trial hVOS responses to 30-, 33-, and 35-μA pulses applied to the mossy fibers from an electrode out of the field of view at times indicated by vertical lines. Individual cells had distinct thresholds.
Fig. 6.
Fig. 6.
Propagation between compartments. A: CCD-SMQ RLI image of a labeled neuron in the somatosensory cortex (expressing probe by in utero electroporation). B: hVOS imaging revealed a burst of activity evoked by stimulation (140 μA, at the arrow). Each event propagated from the soma (black trace) to the dendritic branch (red trace) (ROI labeled in A). C: later events in the soma and dendritic branch were averaged and superimposed to reveal initiation in the soma and propagation to the dendritic compartment with a delay of 1.5 ms between times to half-maximum. D: CCD-SMQ RLI image of a neuron in the somatosensory cortex with several clear dendritic branches. E: dendritic branches were demarcated in ROI and labeled. White arrows indicate direction of propagation used for the x-axis in G. F: stimulus evoked fluorescence responses from ROI indicated in E. Ten trial averages were superimposed to show variable delays in dendrites following onset in the soma. Traces normalized to RLI are plotted above and traces normalized to their maxima are plotted below. G: spatiotemporal map of responses from dendritic branches numbered in E, with the horizontal axis representing increasing distance from the soma (along corresponding white arrows in E) and the vertical axis representing time. Color scale encodes response amplitude from dark blue (zero) to yellow (maximum), normalized to the maximal signal from the soma. The horizontal red dashed line represents t = 0, and the diagonal red dashed lines highlight the propagation front to indicate velocity.
Fig. 7.
Fig. 7.
Spike initiation in dendrites. A: CCD-SMQ RLI image of a labeled neuron in somatosensory cortex (in utero electroporation). B: ROI containing soma and 5 dendritic branches. C: hVOS traces (5 trial averages) in colors corresponding to the ROI in B. Traces normalized to RLI are presented on the left, and traces normalized to their maxima are presented on the right. The spike initiated in dendritic compartment d3 (light blue).
Fig. 8.
Fig. 8.
Propagation through a network. A, left: RLI image with the CCD-SMQ camera showing four labeled neurons indicated by colored arrowheads. A, right: high-resolution fluorescence image of the same field shows the neurons more clearly. B: hVOS traces from 4 ROI containing the somata show the temporal sequence of voltage changes in the 4 neurons highlighted in A; colors correspond to the arrowheads in A. Traces normalized to RLI are at left, and traces normalized to their maxima are at right. The red-labeled and orange-labeled neurons responded almost simultaneously, followed by the blue-labeled and the green-labeled neurons. The green-labeled neuron spiked ∼2 ms after the synaptic response. C: schematic representation of the sequence of responses in the 4 labeled neurons. Ci: stimulation from beyond the bottom left corner activated the red- and orange-labeled neurons at almost the same time. Cii: red-labeled and orange-labeled neurons responded with a delay of ∼1.5 ms. Ciii: blue-labeled and green-labeled neurons responded ∼2 ms later. Civ: green-labeled neuron spiked ∼2.5 ms after its initial synaptic response. The arrows indicate the sequence of activation and a hypothetical circuit that could include the labeled neurons along with unlabeled members of the populations represented by the labeled neurons.

References

    1. Akemann W, Mutoh H, Perron A, Park YK, Iwamoto Y, Knopfel T. Imaging neural circuit dynamics with a voltage-sensitive fluorescent protein. J Neurophysiol 108: 2323–2337, 2012. - PubMed
    1. Akemann W, Mutoh H, Perron A, Rossier J, Knopfel T. Imaging brain electric signals with genetically targeted voltage-sensitive fluorescent proteins. Nat Methods 7: 643–649, 2010. - PubMed
    1. Antic S, Zecevic D. Optical signals from neurons with internally applied voltage-sensitive dyes. J Neurosci 15: 1392–1405, 1995. - PMC - PubMed
    1. Barth AL. Visualizing circuits and systems using transgenic reporters of neural activity. Curr Opin Neurobiol 17: 567–571, 2007. - PMC - PubMed
    1. Bradley J, Luo R, Otis TS, DiGregorio DA. Submillisecond optical reporting of membrane potential in situ using a neuronal tracer dye. J Neurosci 29: 9197–9209, 2009. - PMC - PubMed

Publication types