. 2014 Nov 19;34(47):15779-92.
doi: 10.1523/JNEUROSCI.1141-14.2014.

Netrin-G/NGL complexes encode functional synaptic diversification

Affiliations

Netrin-G/NGL complexes encode functional synaptic diversification

Hiroshi Matsukawa et al. J Neurosci. .

Abstract

Synaptic cell adhesion molecules are increasingly gaining attention for conferring specific properties to individual synapses. Netrin-G1 and netrin-G2 are trans-synaptic adhesion molecules that distribute on distinct axons, and their presence restricts the expression of their cognate receptors, NGL1 and NGL2, respectively, to specific subdendritic segments of target neurons. However, the neural circuits and functional roles of netrin-G isoform complexes remain unclear. Here, we use netrin-G-KO and NGL-KO mice to reveal that netrin-G1/NGL1 and netrin-G2/NGL2 interactions specify excitatory synapses in independent hippocampal pathways. In the hippocampal CA1 area, netrin-G1/NGL1 and netrin-G2/NGL2 were expressed in the temporoammonic and Schaffer collateral pathways, respectively. The lack of presynaptic netrin-Gs led to the dispersion of NGLs from postsynaptic membranes. In accord, netrin-G mutant synapses displayed opposing phenotypes in long-term and short-term plasticity through discrete biochemical pathways. The plasticity phenotypes in netrin-G-KOs were phenocopied in NGL-KOs, with a corresponding loss of netrin-Gs from presynaptic membranes. Our findings show that netrin-G/NGL interactions differentially control synaptic plasticity in distinct circuits via retrograde signaling mechanisms and explain how synaptic inputs are diversified to control neuronal activity.

Keywords: excitatory synapse; mice; netrin-G1; netrin-G2; pathway specificity; trans-synaptic adhesion molecule.


Figures

Figure 1.
Figure 1.
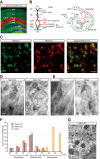
Presynaptic localization of netrin-G proteins and postsynaptic localization of NGL proteins in distinct hippocampal layers. A, Double-staining fluorescence image showing layer-selective distributions of netrin-G subtypes in the hippocampal CA1 and DG regions. SO, stratum oriens. B, Schematics of entorhino-hippocampal/intrahippocampal projections expressing netrin-Gs (right) and the local synaptic connections (left). In the hippocampus, CA1 pyramidal and DG granule cells (PC and GC) receive netrin-G1 (red)-expressing and netrin-G2 (green)-expressing inputs originating from entorhinal cortex (EC) layers II/III and CA3 areas. C, Confocal images showing double immunostaining for Bassoon and netrin-G1. Scale bar, 1 μm. D, E, Electron micrographs show immune signals for netrin-G1, netrin-G2, NGL1, and NGL2, as detected using a post-embedding immunogold technique. D, Immunogold particles (arrows) for netrin-G1 and netrin-G2 were detected mainly along the presynaptic axon terminals (at) making excitatory synapses on dendritic spines (s) of the pyramidal cells in SLM and SR, respectively. E, Immunoparticles for NGL1 and NGL2 were mostly detected postsynaptically in the vicinity of the postsynaptic density of dendritic spines in SLM and SR, respectively. Scale bars, 200 nm. F, Relative distance of the immune particles to presynaptic membrane structure was allocated to 10 nm wide bins and expressed as counts. Positive location was defined as extracellular face from presynaptic terminal (at 0 nm). Frequencies of particle distribution for netrin-G1 and netrin-G2 peaked within the synaptic cleft, while that of NGL1 nestled postsynaptically. The mean synaptic cleft size was 19.16 nm, as determined by 17 representative synapses. G, A pre-embedding immunogold technique showed multiple immunoparticles for netrin-G1 (arrows) exclusively along the longitudinally running axon structure in SLM. Scale bar, 200 nm.
Figure 2.
Figure 2.
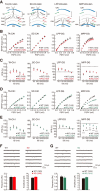
Deficiency of netrin-G2 attenuated synaptic transmission in the specific pathway. A, Schematics of field recording. Basal synaptic properties were examined in hippocampal CA1 and DG synapses. AMPAR-mediated fEPSPs were recorded by stimulating axon fibers: TA, SC, LPP, and MPP. Recording and bipolar stimulating electrodes were placed in the middle of each layer. B, Relative postsynaptic responsiveness to presynaptic activity was not significantly different between netrin-G1-KO and WT control mice. The average slopes of fEPSPs (10 consecutive recordings) were plotted as a function of the average amplitude of PSFV. C, The paired-pulse ratio (PPR; percentage) was not statistically different between netrin-G1-KO and WT mice. The slope ratios were obtained by average fEPSPs (10 consecutive recordings) and plotted as a function of the interstimulus interval (ISI). D, Basal synaptic transmission was significantly reduced only at MPP-DG synapses, but normal at the SC-CA1 synapses of netrin-G2-KO mice. E, MPP-DG synapses of netrin-G2-KO mice showed significantly increased PPR at all interstimulus intervals, while the SC-CA1 synapses showed comparable PPR to WT mice. Absence of netrin-G1 or netrin-G2 did not affect the basal synaptic properties of the neighboring pathways. F, G, Representative sample traces of mEPSC events recorded from DG granule cells of netrin-G1-KO (F) and netrin-G2-KO (G) slices. No significant differences were observed in frequency and amplitude. The numbers of slices/granule neurons (left) and mice (right) used in each experiment are shown in parentheses. All bar graphs are represented as mean ± SEM. Student's t test, ***P < 0.001.
Figure 3.
Figure 3.
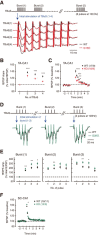
Altered PTP in netrin-G1-KO and netrin-G2-KO caused by distinct signaling deficits. A, B, PTP at the TA-CA1 synapses was impaired in netrin-G1-KO. In contrast, PTP at the SC-CA1 synapses was facilitated in netrin-G2-KO SC-CA1. C, D, fEPSP potentiation by PDBu (0.4 μm) was reduced at TA-CA1 synapses in netrin-G1-KO, but normal at SC-CA1 synapses in netrin-G2-KO. The slope of fEPSP was normalized to the average value before the onset of PDBu application. Insets show superimposed average traces (during 2 min) before and after the treatment at the times indicated by the numbers. The average of potentiation during the last 5 min of recording was statistically compared between genotypes (WT vs netrin-G1-KO, **p < 0.005; WT vs netrin-G2-KO, p = 0.86). E, F, fEPSP potentiation induced by combination of forskolin (20 μm) and IBMX (50 μm) was not statistically different between netrin-G mutant and WT mice (the average of potentiation during the last 5 min of recording; WT vs netrin-G1-KO, p = 0.19; WT vs netrin-G2-KO, p = 0.16). G, Treatment of slices with PKC inhibitor, Bis (2 μm) attenuated PTP generation in both WT and netrin-G1-KO mice. H, Comparison of TA-CA1 PTP magnitudes at 20 and 40 s (left and right, respectively), following tetanic stimulation in the absence or presence of Bis. Values of bar graphs were extracted from A and G. I, fEPSP potentiation by PDBu was indistinguishable in the presence of Bis between netrin-G1-KO and WT (the average of potentiation during the last 5 min of recording; p = 0.80). Insets show superimposed average traces (during 2 min) before and after the treatment at the times indicated by the numbers. J, Comparison of the PDBu-induced synaptic potentiation in the absence (left) and presence (right) of Bis. Values are averages of the last 5 min of recording in C and I. K, After forskolin treatment, SC-CA1 synapses showed significantly greater (PPR) at 50 ms ISI in netrin-G2-KO, compared with WT control mice. L, In contrast, forskolin abolished PPD phenotype at MPP-DG synapses of netrin-G2-KO. fEPSPs were recorded at the indicated pathway shown above each part. Slices were treated with drug(s) as indicated by the solid line in each experiment. The numbers of slices (left) and mice (right) used in each experiment are shown in parentheses. Data are shown as mean ± SEM. Student's t test; *P < 0.05, **P < 0.01, ***P < 0.001, and absolute P values.
Figure 4.
Figure 4.
Altered hippocampal LTP in netrin-G-KO mice. A, TBuS-induced LTP at the TA-CA1 synapses was attenuated in netrin-G1-KO (top). The slope of fEPSP was normalized to the average value during the 50 min before the initial TBuS. TA-CA1 synapses were electrically conditioned four times with TBuS at 0, 40, 60, and 80 min. Insets show superimposed average traces (10 consecutive fEPSPs) before TBuS and in the last 5 min of each recording, as indicated by the numbers. Absence of netrin-G1 from SLM did not affect LTP capability at proximal neighboring SC-CA1 synapses (bottom). Bar graphs show a comparison of the graded increase of LTP with the number of TBuSs between netrin-G1-KO and WT mice. Calibration: 0.2 mV, 10 ms. B, TBuS-induced LTP at SC-CA1 synapses was increased in netrin-G2-KO mice (bottom). Conditioning timing was the same as A. Insets show superimposed average traces of the 5 min before the initial TBuS and in the last 5 min of each recording, as indicated by the numbers. Absence of netrin-G2 from SR did not affect LTP capability at distal neighboring TA-CA1 synapses (top). Bar graphs show a comparison of the graded increase of LTP with the number of TBuSs between netrin-G2-KO and WT mice. Calibration: 0.2 mV, 10 ms. C, D, AMPAR-ESPCs and NMDAR-EPSCs were recorded from CA1 pyramidal neurons. Superimposed traces are representative average traces (10 consecutive responses) of AMPAR-EPSC recorded at −70 mV and NMDAR-EPSC at −20 mV (for TA-stimulation, top) or at +50 mV (for SC-stimulation, bottom). The amplitude ratio (NMDA/AMPA) was not statistically different between KO and WT mice. Numbers of slices/pyramidal neurons (left) and mice (right) used in each experiment are shown in parentheses. Data are shown as mean ± SEM. Student's t test, *P < 0.05, and **P < 0.01.
Figure 5.
Figure 5.
Impaired short-term plasticity induced by TBuS in netrin-Gs-KO mice. A, TBuS train used for TA-CA1 LTP induction. Each TBuS composes five bursts (1–5, 5 Hz) of eight pulses (100 Hz). Development of TA-CA1 fEPSP by the consecutive four trains of TBuS (1–4), in the presence of d-AP5 (50 μm), was impaired in netrin-G1-KO, compared with the WT mice. Superimposed are representative TA-CA1 fEPSPs traces during the burst (1) of each TBuS (blue arrow), scaling with the peak amplitude of fEPSP evoked by initial stimulus of TBuS (1). B, Relative slope of TA-CA1 fEPSP in multiple TBuS conditionings in A was plotted with the number of TBuS. C, Synaptic potentiation following consecutive four TBuS trains (PTBuP) was decreased in netrin-G1-KO, compared with WT mice. D, TBuS train used for SC-CA1 LTP induction, which composes three bursts (1–3, 5 Hz) of four pulses (100 Hz). Superimposed are representative fEPSP traces elicited by three bursts (1–3) in the presence of d-AP5 (50 μm), scaling with the peak amplitude of fEPSP evoked by initial stimulus of burst (1). Intraburst synaptic facilitation was aberrantly enhanced in netrin-G2-KO, when compared with WT mice. E, Relative amplitude of SC-CA1 fEPSP during each burst in D was plotted with the number of stimulus pulse (1–4). F, PTBuP was slightly but significantly enhanced in netrin-G2-KO, compared with WT mice. The numbers of slices (left) and mice (right) used in each experiment are shown in parentheses. Data are represented as mean ± SEM. Student's t test, *P < 0.05, **P < 0.01, ***P < 0.001.
Figure 6.
Figure 6.
Presynaptic abnormalities in NGL-KO mice and normal dendritic morphologies of netrin-G2-KO and NGL2-KO mice. A–C, Synaptic phenotypes in TA-CA1 pathway of adult NGL1-KO mice. A, Normal basal synaptic transmission. B, Normal paired-pulse ratio (PPR). C, Impaired PTP. D, E, Synaptic phenotypes of adult NGL2-KO mice. Normal basal synaptic transmission in SC-CA1 pathway (D) and reduced PPD in the MPP-DG pathway (E). F, G, Morphologic analyses of dendrites of CA1 pyramidal neurons at P14 (F) and adults (G). Densities of spiny protrusions of dendrites in SR of netrin-G2-KO (top) and NGL2-KO (bottom) are shown together with their WT littermates. Scale bars: 2 μm. Numbers of slices (left) and mice (right) used in each experiment are shown in parentheses for AE. Numbers of dendritic segments (left) and mice (right) are shown in parentheses for F and G. Data are shown as mean ± SEM. Student's t test, shown are *P < 0.05, **P < 0.01, ***P < 0.001 and absolute values.
Figure 7.
Figure 7.
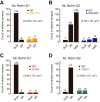
Disappearance of presynaptic netrin-Gs in NGL-KO mice. A, B, Subregional iEM analyses for netrin-Gs in NGL-KO mice. Ultrathin sections from NGL1-KO and NGL2-KO mice were immunoreacted with antibodies against netrin-G1 and netrin-G2, respectively. C, D, Similar iEM analyses for netrin-Gs in netrin-G-KO mice revealed specificity of immune signals. Counts of synapses labeled with one or more immunogold(s) are shown on top of each bar. Searched area for each immunoreaction is shown in parentheses. Equivalent semiquantitative results were duplicated with blocks prepared from another set of WT and mutant mice (data not shown).
Figure 8.
Figure 8.
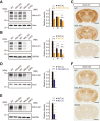
Synaptic localization and surface expression levels of netrin-Gs regulated by postsynaptic NGLs. Amounts of netrin-Gs were compared between NGL-KO and WT mice, in both P2 and SPM fractions from forebrains. A, WB of P2-proteins probed with antibodies against netrin-G1 and actin in WT, NGL1-KO, and netrin-G1-KO mice. Relative amounts of netrin-G1 isoforms were normalized with the long form of WT. P2-netrin-G1 was downregulated in NGL1-KO for long isoform (L) and short isoform (S), but not middle isoform (M). B, WB of SPM-proteins probed with antibodies against netrin-G1 and GAPDH in WT, NGL1-KO, and netrin-G1-KO mice. All SPM-netrin-G1 isoforms including M were further downregulated in NGL1-KO. C, Immunohistochemistry with antibody against netrin-G1 revealed downregulation of netrin-G1 in NGL1-KO mice. Netrin-G1-KO mouse brain revealed the specificity of immune signals. D, WB of P2-proteins probed with antibodies for netrin-G2 and actin in WT, NGL2-KO, and netrin-G2-KO mice. P2-netrin-G2 was downregulated in NGL2-KO. E, WB of SPM-proteins probed with antibodies for netrin-G2 and GAPDH in WT, NGL2-KO, and netrin-G2-KO mice. SPM-netrin-G2 was further downregulated in NGL2-KO. F, Immunohistochemistry with netrin-G2 antibody showed no differences between WT and NGL2-KO mice. Netrin-G2-KO mouse brain revealed the specificity of immune signals. The number of animals used in each WB is shown in parentheses. Data are shown as mean ± SEM. Student's t test, ***p < 0.001. Scale bars: 2 mm.
Figure 9.
Figure 9.
Model for reciprocal localization of netrin-Gs and NGLs at synaptic contacts and their contribution to neural pathway-specific synaptic diversification. A, Schematic depiction of the localization of netrin-Gs and NGLs in mutant mice lacking netrin-G1, netrin-G2, NGL1, and NGL2, respectively. In netrin-G1 and netrin-G2 mutant mice, NGL1 and NGL2, respectively, diffuse from postsynaptic membranes. Likewise, in the absence of NGL1 and NGL2, respectively, netrin-G1 and netrin-G2 diffuse to axonal membranes. B, Trans-synaptic netrin-G1/NGL1 and netrin-G2/NGL2 interactions differentially control synaptic plasticity in a pathway-specific manner. Loss of the netrin-G1/NGL1 interaction attenuates synaptic plasticity (red/orange arrows). In contrast, loss of netrin-G2/NGL2 interaction enhances synaptic plasticity (green/blue arrows). Altered presynaptic function (PPR, and PTP) due to deletion of NGLs suggests their roles in retrograde signaling (postsynaptic NGLs → presynaptic netrin-Gs). Postsynaptic function(s) may be also regulated by forward signaling (presynaptic netrin-Gs → postsynaptic NGLs). Thus, netrin-G and NGLs interactions control the balance of excitatory inputs in distinct cortical layers for pathway-specific neuronal computation.

References

    1. Abbott LF, Regehr WG. Synaptic computation. Nature. 2004;431:796–803. doi: 10.1038/nature03010. - DOI - PubMed
    1. Aoki-Suzuki M, Yamada K, Meerabux J, Iwayama-Shigeno Y, Ohba H, Iwamoto K, Takao H, Toyota T, Suto Y, Nakatani N, Dean B, Nishimura S, Seki K, Kato T, Itohara S, Nishikawa T, Yoshikawa T. A family-based association study and gene expression analyses of netrin-G1 and -G2 genes in schizophrenia. Biol Psychiatry. 2005;57:382–393. doi: 10.1016/j.biopsych.2004.11.022. - DOI - PubMed
    1. Beierlein M, Fioravante D, Regehr WG. Differential expression of posttetanic potentiation and retrograde signaling mediate target-dependent short-term synaptic plasticity. Neuron. 2007;54:949–959. doi: 10.1016/j.neuron.2007.06.002. - DOI - PMC - PubMed
    1. Béïque JC, Lin DT, Kang MG, Aizawa H, Takamiya K, Huganir RL. Synapse-specific regulation of AMPA receptor function by PSD-95. Proc Natl Acad Sci U S A. 2006;103:19535–19540. doi: 10.1073/pnas.0608492103. - DOI - PMC - PubMed
    1. Blundell J, Blaiss CA, Etherton MR, Espinosa F, Tabuchi K, Walz C, Bolliger MF, Südhof TC, Powell CM. Neuroligin-1 deletion results in impaired spatial memory and increased repetitive behavior. J Neurosci. 2010;30:2115–2129. doi: 10.1523/JNEUROSCI.4517-09.2010. - DOI - PMC - PubMed

Publication types