. 2015 Feb 6;14(2):1299-307.
doi: 10.1021/pr500886y. Epub 2014 Dec 2.

Wavelet-based peak detection and a new charge inference procedure for MS/MS implemented in ProteoWizard's msConvert

Affiliations

Wavelet-based peak detection and a new charge inference procedure for MS/MS implemented in ProteoWizard's msConvert

William R French et al. J Proteome Res. .

Abstract

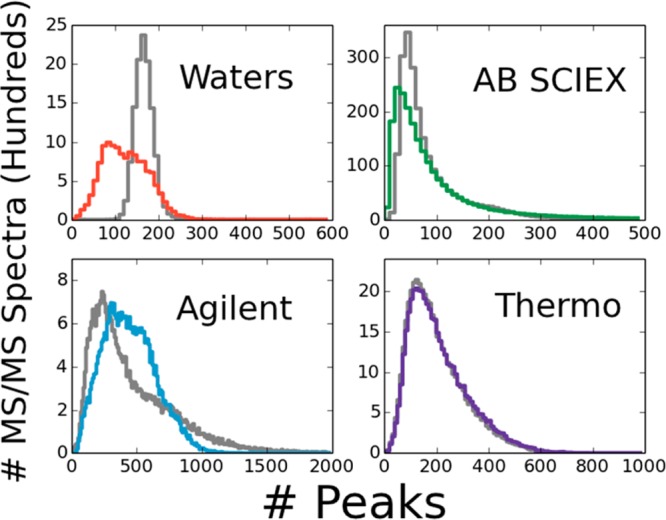
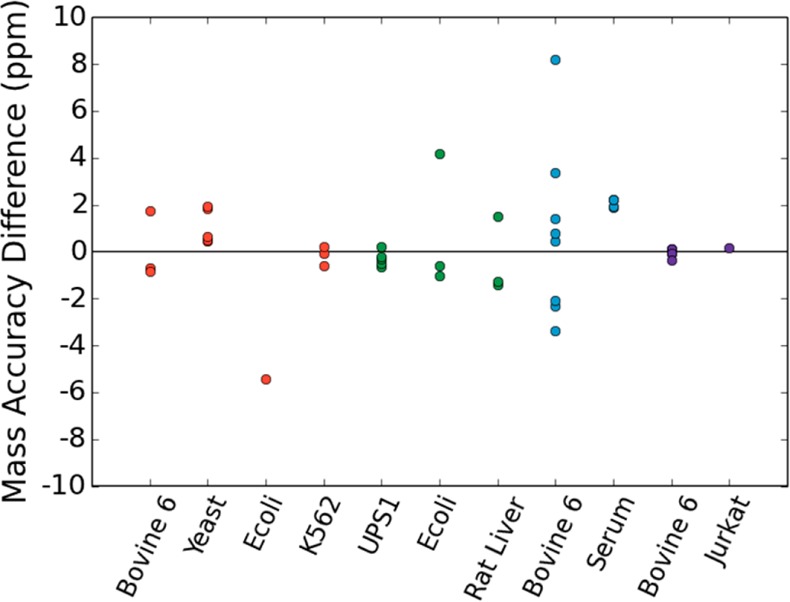
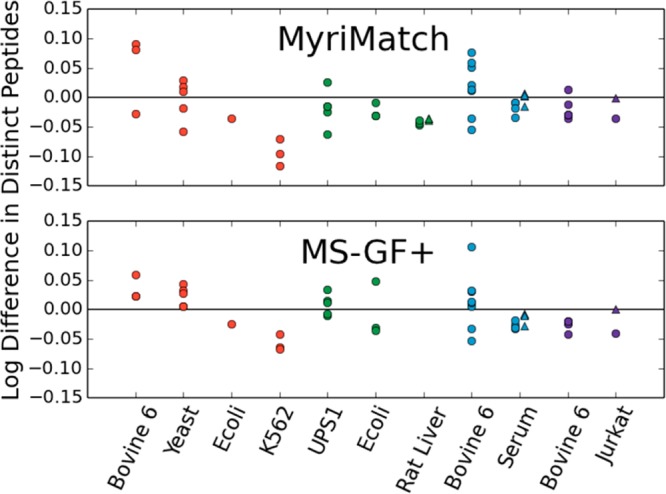
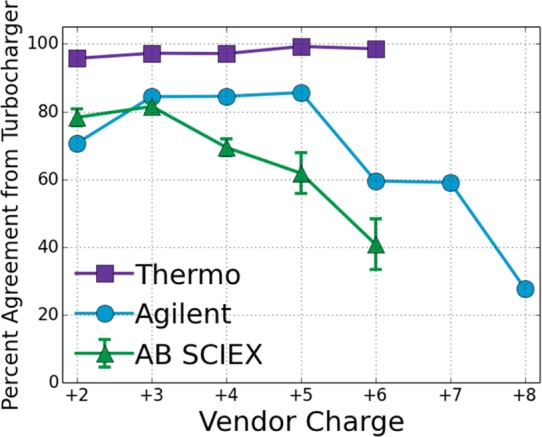
We report the implementation of high-quality signal processing algorithms into ProteoWizard, an efficient, open-source software package designed for analyzing proteomics tandem mass spectrometry data. Specifically, a new wavelet-based peak-picker (CantWaiT) and a precursor charge determination algorithm (Turbocharger) have been implemented. These additions into ProteoWizard provide universal tools that are independent of vendor platform for tandem mass spectrometry analyses and have particular utility for intralaboratory studies requiring the advantages of different platforms convergent on a particular workflow or for interlaboratory investigations spanning multiple platforms. We compared results from these tools to those obtained using vendor and commercial software, finding that in all cases our algorithms resulted in a comparable number of identified peptides for simple and complex samples measured on Waters, Agilent, and AB SCIEX quadrupole time-of-flight and Thermo Q-Exactive mass spectrometers. The mass accuracy of matched precursor ions also compared favorably with vendor and commercial tools. Additionally, typical analysis runtimes (∼1-100 ms per MS/MS spectrum) were short enough to enable the practical use of these high-quality signal processing tools for large clinical and research data sets.

Keywords: Continuous wavelet transformation; deisotoping; mass spectrometry; open-source software; peak-picking; precursor charge determination; signal deconvolution.


Figures

Figure 1
Figure 1
Comparison of peak list size distributions for the most complex samples analyzed on four instruments. The x axis represents the number of peaks in an individual MS/MS spectrum. Gray curves correspond to results from vendor or commercial software, and colored curves correspond to results produced by CantWaiT peak-picking. Note that the samples used for each platform are different and therefore comparisons should be made only within each individual panel.
Figure 2
Figure 2
Median precursor mass accuracy difference between precursors matched from ProteoWizard vs vendor/commercial software. Positive values indicate that ProteoWizard’s median mass accuracy is better (i.e., smaller on an absolute scale) than the median mass accuracy of vendor/commercial software (value on y axis = |MAvendor| – |MAPwiz|, where MA is the median mass accuracy). Red data correspond to Waters Synapt G2/G2-S; green, AB SCIEX Triple TOF 5600; blue, Agilent 6530/6550 QqTOF; and purple, Thermo Q-Exactive. Sample complexity increases for each vendor moving from left to right.
Figure 3
Figure 3
Logarithm of the ratio of the number of distinct peptides identified by ProteoWizard to the number of peptides identified by vendor/commercial software and searched using (Top) MyriMatch and (Bottom) MS-GF+. Positive values indicate that identifications were higher with ProteoWizard signal processing. Circles indicate that all signal processing was performed within ProteoWizard, and triangles correspond to cases where ProteoWizard peak lists were combined with vendor-reported precursor charges and monoisotopic m/z values. The symbol colors indicate the vendor; see the caption to Figure 2 for details. Note that rat liver data analyzed by MS-GF+ were removed due to suspected software errors.
Figure 4
Figure 4
Percent of vendor-assigned precursor charges that were assigned the same charge from Turbocharger for the most complex sample analyzed from each vendor (except for Waters). Error bars span ±1 SD and are visible when greater than the symbol size. For each charge state, a sample size of at least 200 was required for inclusion. Note that comparisons should not be inferred between vendors, as each data set is different in sample and size, but should be made only to the agreement of Turbocharger with the vendor charge state assignments.

References

    1. Angel T. E.; Aryal U. K.; Hengel S. M.; et al. Mass spectrometry-based proteomics: existing capabilities and future directions. Chem. Soc. Rev. 2012, 41, 3912–28. - PMC - PubMed
    1. Nesvizhskii A. I.; Vitek O.; Aebersold R. Analysis and validation of proteomic data generated by tandem mass spectrometry. Nat. Methods. 2007, 4, 787–797. - PubMed
    1. Bantscheff M.; Lemeer S.; Savitski M. M.; Kuster B. Quantitative mass spectrometry in proteomics: critical review update from 2007 to the present. Anal. Bioanal. Chem. 2012, 404, 939–65. - PubMed
    1. Mantini D.; Petrucci F.; Pieragostino D.; et al. LIMPIC: a computational method for the separation of protein MALDI-TOF-MS signals from noise. BMC Bioinf. 2007, 8, 101. - PMC - PubMed
    1. Cox J.; Mann M. MaxQuant enables high peptide identification rates, individualized p.p.b.-range mass accuracies and proteome-wide protein quantification. Nat. Biotechnol. 2008, 26, 1367–72. - PubMed

Publication types

LinkOut - more resources