

Metabolomics evaluation of serum markers for cachexia and their intra-day variation in patients with advanced pancreatic cancer
- PMID: 25411961
- PMCID: PMC4239056
- DOI: 10.1371/journal.pone.0113259
Metabolomics evaluation of serum markers for cachexia and their intra-day variation in patients with advanced pancreatic cancer
Abstract
Purpose: Cancer cachexia is a multifactorial syndrome characterized by progressive loss of weight and muscle atrophy. Using metabolomics, we investigated serum markers and their intra-day variation in advanced pancreatic cancer patients with cachexia.
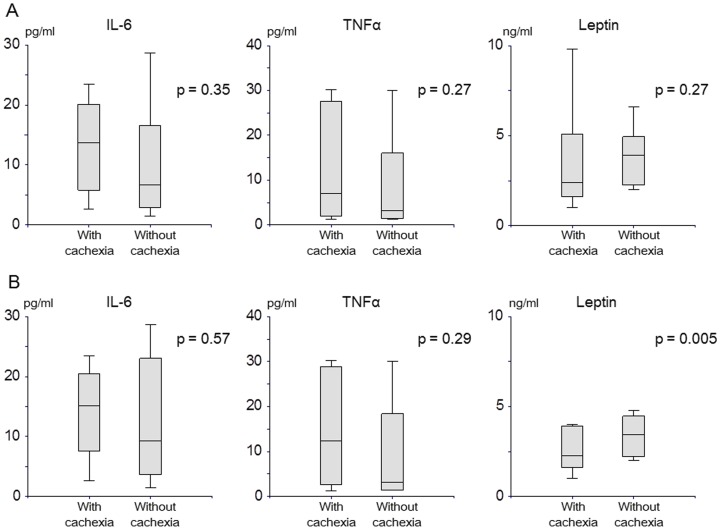
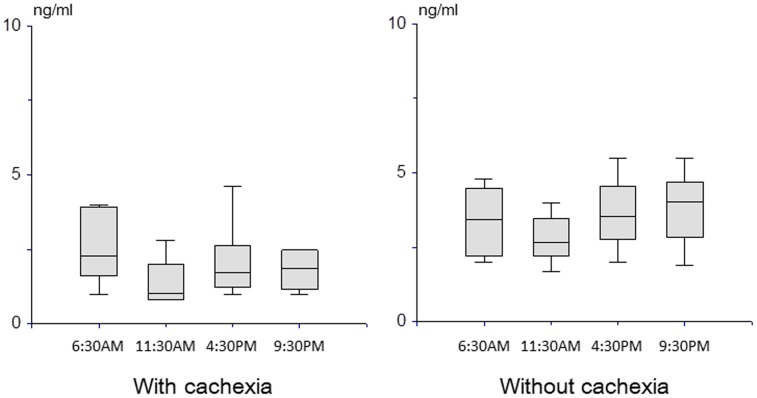
Methods: Patients were enrolled in two groups: those with or without cachexia. Blood samples collected at 6:30 AM, 11:30 AM, 4:30 PM, and 9:30 PM were analyzed using metabolomics, and serum levels of IL-6, TNF-α, and leptin were measured and compared between the two groups. Intra-day variation was then evaluated.
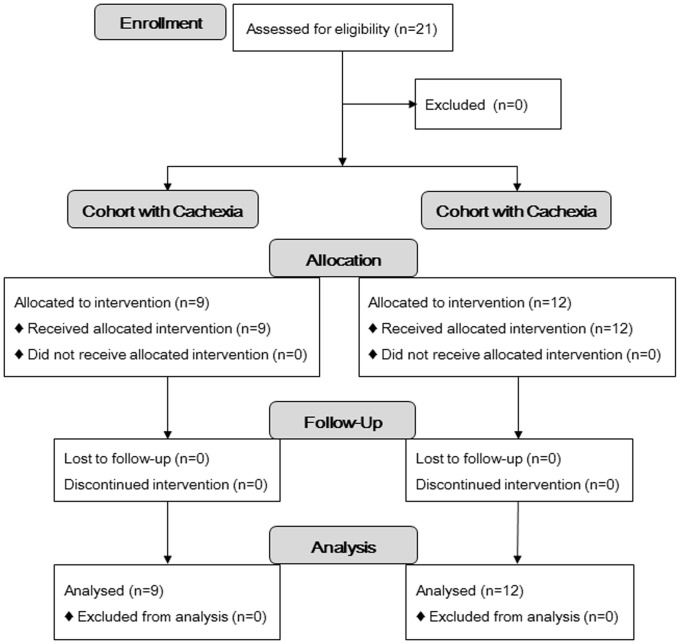
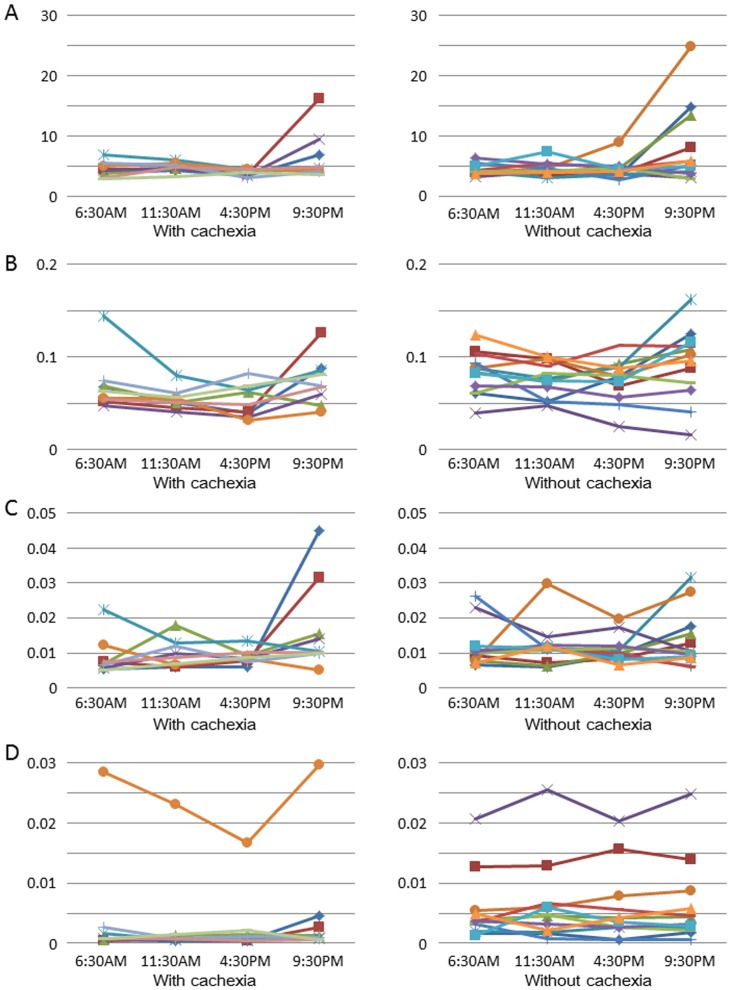
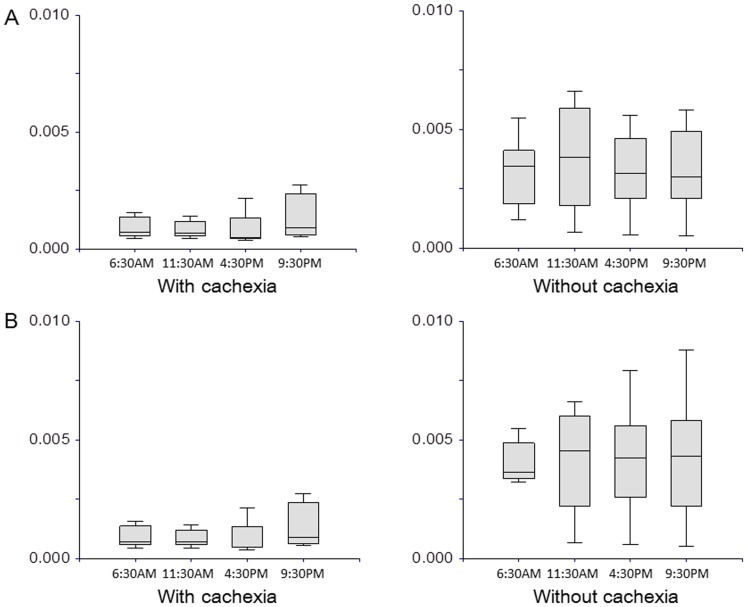
Results: Twenty-one patients were enrolled in total. In the cachexia group (n = 9), median body weight loss rate over 6 months was greater, performance status was poorer, and anorexia was more severe than in the non-cachexia group (n = 12). Each metabolites level showed substantial intra-day variation, and some of them displayed significant differences between the two groups. Levels of paraxanthine remained markedly lower in the cohort with cachexia at all measurement points. Besides, median IL-6 and TNF-α levels appeared higher and leptin concentration appeared lower in the cachexia group, albeit without statistical significance.
Conclusion: Some metabolites and some serological marker levels were affected by cancer cachexia. Although paraxanthine levels were consistently lower in patients with cachexia, we identified that many metabolites indicated large intra- and inter-day variation and that it might be necessary to pay attention to intra-day variation in metabolomics research.
Conflict of interest statement
Figures
References
-
- Tisdale MJ (2009) Mechanisms of cancer cachexia. Physiol Rev 89: 381–410. - PubMed
-
- Fearon K, Strasser F, Anker SD, Bosaeus I, Bruera E, et al. (2011) Definition and classification of cancer cachexia: an international consensus. Lancet Oncol 12: 489–495. - PubMed
-
- Fearon KC, Moses AG (2002) Cancer cachexia. Int J Cardiol 85: 73–81. - PubMed
-
- Davidson W, Ash S, Capra S, Bauer J, Cancer Cachexia Study G (2004) Weight stabilisation is associated with improved survival duration and quality of life in unresectable pancreatic cancer. Clin Nutr 23: 239–247. - PubMed
-
- Bachmann J, Heiligensetzer M, Krakowski-Roosen H, Buchler MW, Friess H, et al. (2008) Cachexia worsens prognosis in patients with resectable pancreatic cancer. J Gastrointest Surg 12: 1193–1201. - PubMed
Publication types
MeSH terms
Substances
LinkOut - more resources
Full Text Sources
Other Literature Sources
Medical
