. 2014 Nov 20;9(11):e113054.
doi: 10.1371/journal.pone.0113054. eCollection 2014.

Kawasaki disease-specific molecules in the sera are linked to microbe-associated molecular patterns in the biofilms

Affiliations

Kawasaki disease-specific molecules in the sera are linked to microbe-associated molecular patterns in the biofilms

Takeshi Kusuda et al. PLoS One. .

Abstract

Background: Kawasaki disease (KD) is a systemic vasculitis of unknown etiology. The innate immune system is involved in its pathophysiology at the acute phase. We have recently established a novel murine model of KD coronary arteritis by oral administration of a synthetic microbe-associated molecular pattern (MAMP). On the hypothesis that specific MAMPs exist in KD sera, we have searched them to identify KD-specific molecules and to assess the pathogenesis.

Methods: We performed liquid chromatography-mass spectrometry (LC-MS) analysis of fractionated serum samples from 117 patients with KD and 106 controls. Microbiological and LC-MS evaluation of biofilm samples were also performed.

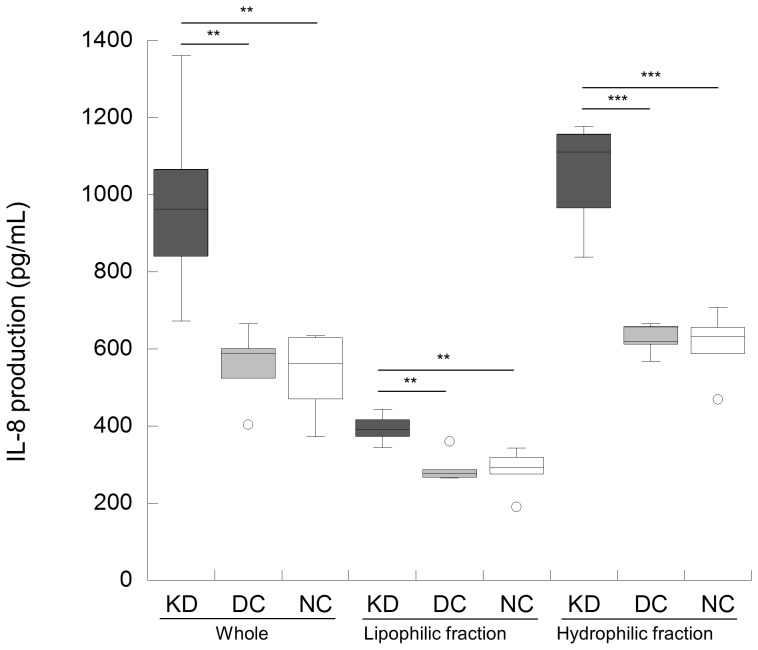
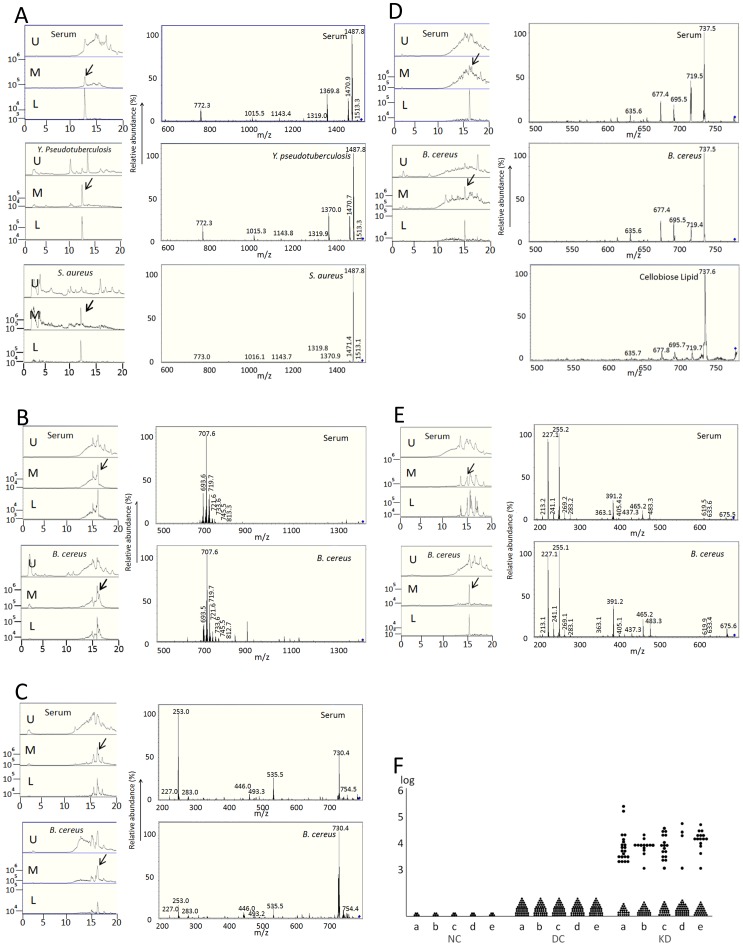
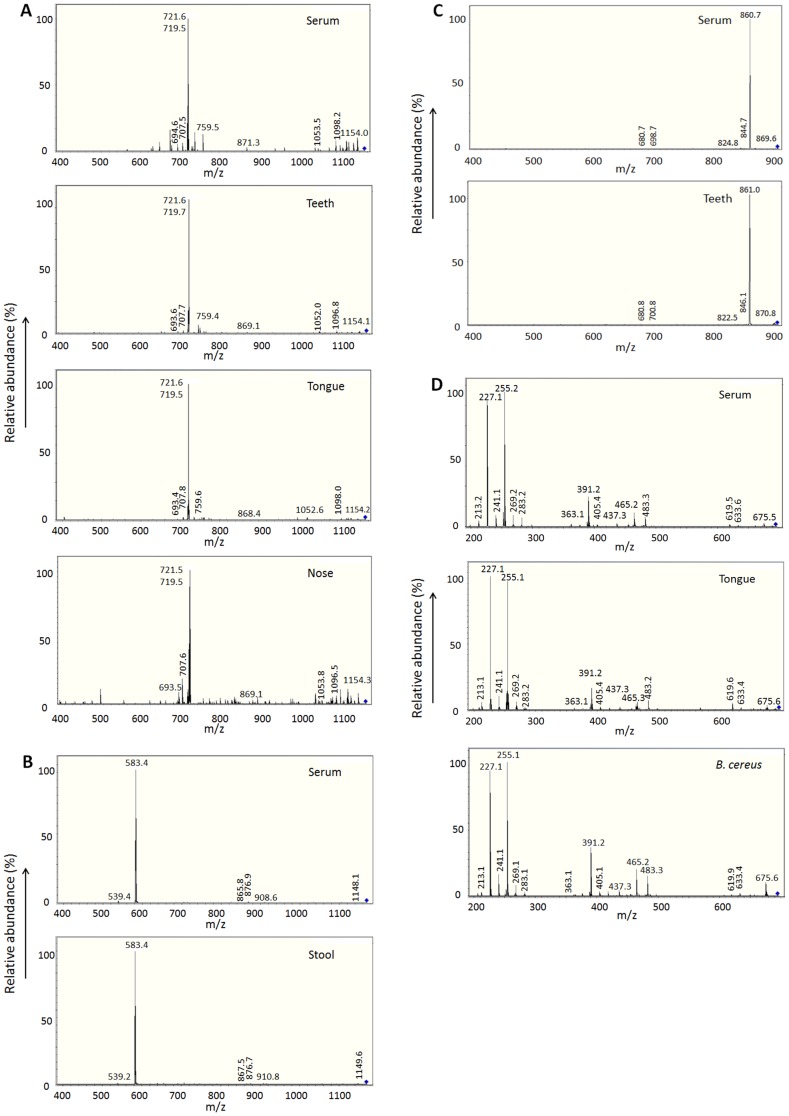
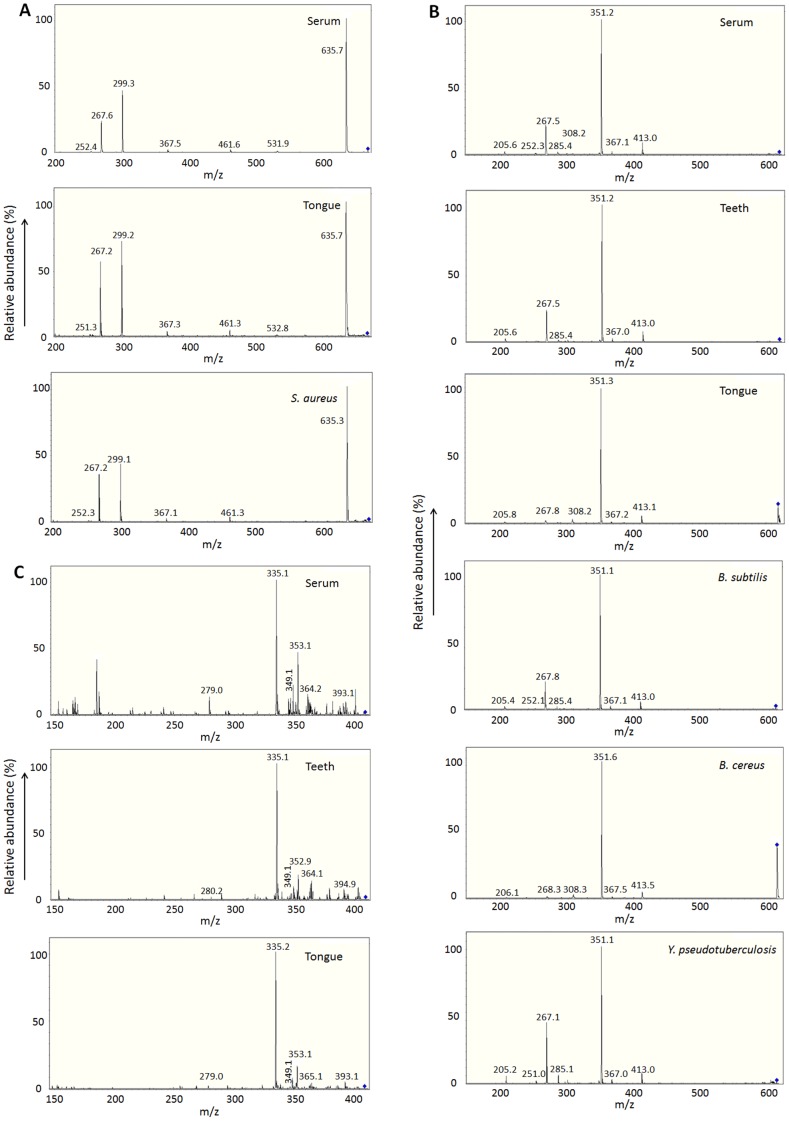
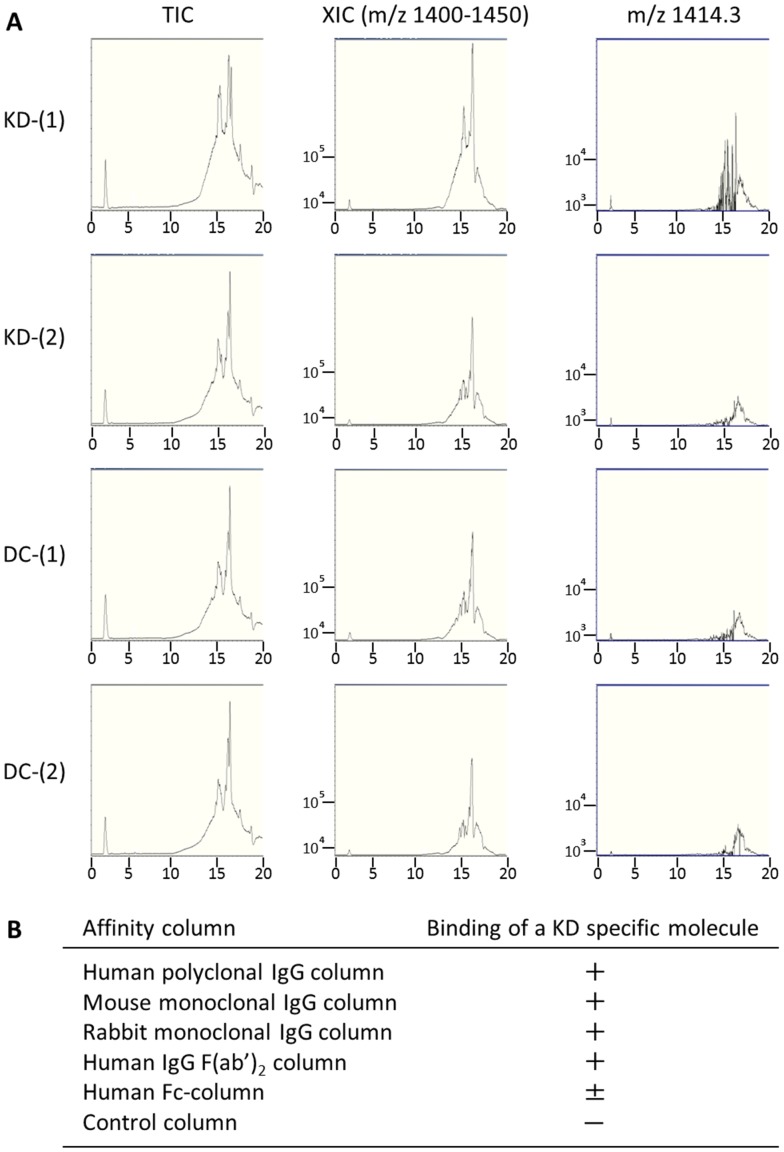
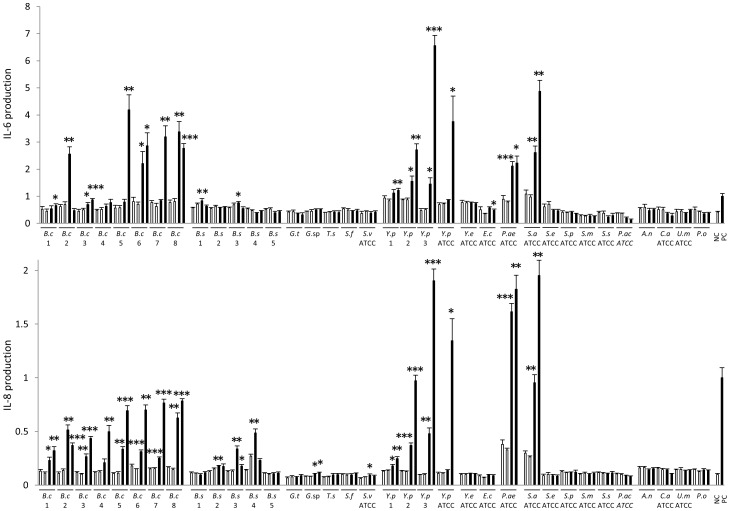
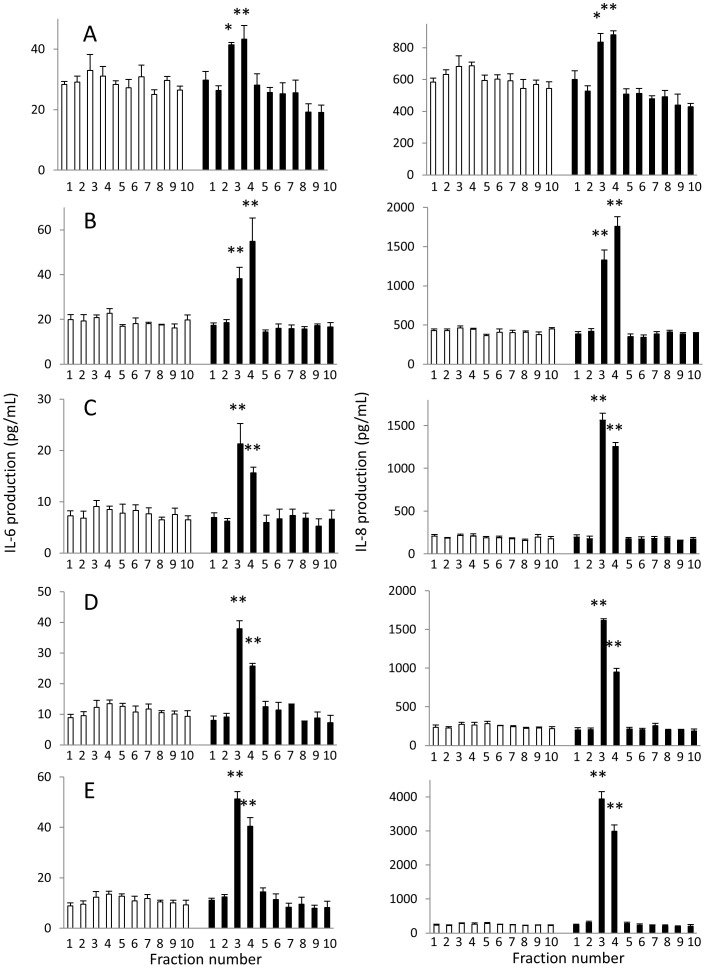
Results: KD samples elicited proinflammatory cytokine responses from human coronary artery endothelial cells (HCAECs). By LC-MS analysis of KD serum samples collected at 3 different periods, we detected a variety of KD-specific molecules in the lipophilic fractions that showed distinct m/z and MS/MS fragmentation patterns in each cluster. Serum KD-specific molecules showed m/z and MS/MS fragmentation patterns almost identical to those of MAMPs obtained from the biofilms formed in vitro (common MAMPs from Bacillus cereus, Yersinia pseudotuberculosis and Staphylococcus aureus) at the 1st study period, and from the biofilms formed in vivo (common MAMPs from Bacillus cereus, Bacillus subtilis/Bacillus cereus/Yersinia pseudotuberculosis and Staphylococcus aureus) at the 2nd and 3rd periods. The biofilm extracts from Bacillus cereus, Bacillus subtilis, Yersinia pseudotuberculosis and Staphylococcus aureus also induced proinflammatory cytokines by HCAECs. By the experiments with IgG affinity chromatography, some of these serum KD-specific molecules bound to IgG.

Conclusions: We herein conclude that serum KD-specific molecules were mostly derived from biofilms and possessed molecular structures common to MAMPs from Bacillus cereus, Bacillus subtilis, Yersinia pseudotuberculosis and Staphylococcus aureus. Discovery of these KD-specific molecules might offer novel insight into the diagnosis and management of KD as well as its pathogenesis.


Conflict of interest statement

Competing Interests: The authors have declared that no competing interests exist.

Figures

Figure 1
Figure 1. Whole and fractionated serum samples from KD patients induce cytokine production in HCAECs.
The production of IL-8 by HCAECs was measured in triplicate after 24-hour stimulation with whole sera or lipophilic and hydrophilic fractions from KD patients (n = 6), DC controls (n = 5; pneumonia; n = 2, influenza A virus infection; n = 1, adenovirus infection; n = 1 and urinary tract infection; n = 1), or NC subjects (n = 5). Lipophilic and hydrophilic fractions were separated by ethyl acetate extraction. The bottom and top edges of the box plot correspond to the 25th and 75th percentiles, respectively. The horizontal line inside the box represents the median of the distribution. The whiskers indicate the 10th and 90th percentiles. **P<0.01; ***P<0.001 (Welch's t-test).
Figure 2
Figure 2. LC-MS chromatograms and MS/MS fragmentation patterns of serum KD-specific molecules at the 1st study period.
A–E: Each left upper panel: LC-MS chromatograms of KD-specific molecules (A: m/z 1531.8, B: m/z 1414.3, C: m/z 790.9, D: m/z 779.8, and E: m/z 695.0), Each left lower panel: LC-MS chromatograms of biofilm extracts (or initial culture supernatants) from Y. pseudotuberculosis and S. aureus (A) and B. cereus (B–E). U: Total ion current chromatograms, M: Extracted-ion chromatograms at m/z 1500–1600 (A), m/z 1400–1500 (B), m/z 700–800 (C and D), and m/z 600–700 (E), L: Extracted-ion chromatograms at m/z 1531.8 (A), m/z 1414.3 (B), m/z 790.9 (C), m/z 779.8 (D), and m/z 695.0 (E). Arrows indicate peaks of target molecules. Each right upper panel: MS/MS fragmentation patterns of KD-specific molecules (A: m/z 1531.8, B: m/z 1414.3, C: m/z 790.9, D: m/z 779.8, and E: m/z 695.0), Each right lower panel: MS/MS fragmentation patterns of biofilm extracts (or initial culture supernatants) from Y. pseudotuberculosis and S. aureus (A) and B. cereus (B–E). As for the molecule at m/z 779.8, cellobiose lipid shows a MS/MS fragmentation pattern similar to that of KD sera (D, right lowest panel). The intensity is shown by relative abundance. F: The detection rates of each molecule in NC (N = 5), DC (N = 41) or KD (N = 43) sera are shown. Twenty-one (48.8%) of 43 are positive at m/z 1531.8 (a), 13 (30.2%) of 43 at m/z 1414.3 (b), 17 (39.5%) of 43 at m/z 790.9 (c), 4 (9.3%) of 43 at m/z 779.8 (d) and 15 (34.9%) of 43 at m/z 695.0 (e) when the intensity above 1×10³ is considered to be significant. The overall detection rate was 76.7% (33 of 43). P<0.0001 (a, b, c and e); P = 0.0364 (d) (Fisher's exact test).
Figure 3
Figure 3. KD in vivo biofilms contain MAMPs common to serum KD-specific molecules (2nd study period).
Extensive search for common molecules in the in vivo biofilms and sera from KD patients or DC controls revealed that 4 KD-specific molecules (m/z 1171.4, 1169.4, 906.8, and 695.0) showed similar MS/MS fragmentation patterns between the two in KD patients (Table S3 in File S1). A: The molecule at m/z 1171.4 was common in KD serum and biofilm extracts from teeth, tongue, or nose. B: The molecule at m/z 1169.4 was common in KD serum and stool biofilm extracts. C: The molecule at m/z 906.8 was common in KD serum and teeth biofilm extracts. D: The molecule at m/z 695.0 was common in KD serum and tongue biofilm extracts and in vitro biofilm extracts from B. cereus.
Figure 4
Figure 4. KD in vivo biofilms contain MAMPs common to serum KD-specific molecules (3rd study period).
Three serum KD-specific molecules (m/z 667.4, 619.4 and 409.3) at the 3rd study showed the same m/z with MS/MS fragmentation patterns similar to MAMPs from in vivo biofilm extracts (Table S4 in File S1) and in vitro bacterial biofilm extracts. A: The molecule at m/z 667.4 was common in KD serum, tongue biofilm extracts and in vitro biofilm extracts from S. aureus. B: The molecule at m/z 619.4 was common in KD serum, teeth and tongue biofilm extracts, and in vitro biofilm extracts from B. subtilis, B. cereus and Y. pseudotuberculosis. C: The molecule at m/z 409.3 was common in KD serum, and teeth and tongue biofilm extracts.
Figure 5
Figure 5. LC-MS chromatograms of IgG sepharose-binding molecules.
A. Representative LC-MS chromatograms of a IgG sepharose-binding molecule (m/z 1414.3) are shown in a KD patient and a DC control. TIC: Total ion current chromatograms, XIC: Extracted-ion chromatograms at m/z 1400–1500, and extracted-ion chromatograms at m/z 1414.3. (1) Human polyclonal IgG-conjugated sepharose 6 Fast (2) Inactivated CNBr Sepharose 4B control column. B. Binding of a KD-specific molecule to various affinity columns: Columns used are described in ONLINE METHODS. +: The binding quantities of a KD-specific molecule analyzed by LC-MS were equal or larger than those to human polyclonal IgG column, ±: smaller than 20% of those to human polyclonal IgG column, -: no binding. We performed the experiments 3 times.
Figure 6
Figure 6. Activation of HCAECs by biofilm lipid extracts from various microbes.
The production of IL-6 and IL-8 by HCAECs was measured after 24-h culture in the presence or absence of a microbial stimulant. Each microbe was cultured in the presence or absence of biofilm-forming glass slides with or without butter. As a microbial stimulant, an extract from a culture supernatant (□) or a biofilm (▪) of a microbe cultured in the presence (right column) or absence (left column) of butter was used. Medium alone, ethyl acetate alone or ethyl acetate extract from glass slides cultured in the absence of a microbe was used as a negative control (NC). FK 565 (10 µg/mL) was used as a positive control (PC). B.c: Bacillus cereus, B.s: Bacillus subtilis, G.t: Gordonia terrae, T.s: Terribacillus saccharophilus, S.f: Streptomyces flavogriseus, S.v: Streptomyces violaceus, Y.p: Yersinia pseudotuberculosis, Y.e: Yersinia enterocolitica, E.c: Escherichia coli, P.ae: Pseudomonas aeruginosa, S.a: Staphylococcus aureus, S.e: Staphylococcus epidermidis, S.p: Streptococcus pyogenes, S.m: Streptococcus mitis, S.s: Streptococcus sanguinis, P.ac: Propionibacterium acnes, A.n: Aspergillus niger, C.a: Candida albicans, U.m: Ustilago maydis, P.o: Penicillium oxalicum. Numbers under bacteria indicate those of KD patients. Data are expressed as the fold change induction of IL-8 or IL-6 compared to the PC levels. We performed the experiments 3 times. Biofilms were compared with supernatant control considering presence or absence of butter. *P<0.01, **P<0.001 and ***P<0.0001 (Welch's t-test).
Figure 7
Figure 7. Fractionation of HCAEC-activating biofilm lipid extracts by HPLC.
Each biofilm lipid extract from Y. pseudotuberculosis (A), B. cereus (B), B. subtilis (C), S. aureus (D) or P. aeruginosa (E) was separated into 10 fractions by HPLC and assayed for the stimulatory activity of HCAECs (▪). Fractions 3 and 4 from each biofilm lipid extract induced high cytokine production by HCAECs. Ethyl acetate lipid extracts from glass slides in the absence of microbes served as negative controls (□). Results are representative of 3 independent experiments. The stimulatory effects of fractionated biofilm samples were compared with those of corresponding controls. *P<0.05, **P<0.01 (Welch's t-test).

Similar articles

Cited by

References

    1. Uehara R, Belay ED (2012) Epidemiology of Kawasaki disease in Asia, Europe, and the United States. J Epidemiol 22: 79–85. - PMC - PubMed
    1. Newburger JW, Takahashi M, Gerber MA, Gewits MH, Tani LY, et al. (2004) Diagnosis, treatment, and long-term management of Kawasaki disease: a statement for health professionals from the Committee on Rheumatic Fever, Endocarditis and Kawasaki Disease, Council on Cardiovascular Disease in the Young, American Heart Association. Circulation 110: 2747–2771. - PubMed
    1. Burns JC (2007) The riddle of Kawasaki disease. N Engl J Med 356: 659–661. - PubMed
    1. Rodó X, Ballester J, Cayan D, Melish ME, Nakamura Y, et al. (2011) Association of Kawasaki disease with tropospheric wind patterns. Sci Rep 1: 152. - PMC - PubMed
    1. Foell D, Ichida F, Vogl T, Yu X, Chen R, et al. (2003) S100A12 (EN-RAGE) in monitoring Kawasaki disease. Lancet 361: 1270–1272. - PubMed

Publication types

MeSH terms