. 2014 Nov 20;10(11):e1004777.
doi: 10.1371/journal.pgen.1004777. eCollection 2014 Nov.

SAS-1 is a C2 domain protein critical for centriole integrity in C. elegans

Affiliations

SAS-1 is a C2 domain protein critical for centriole integrity in C. elegans

Lukas von Tobel et al. PLoS Genet. .

Abstract

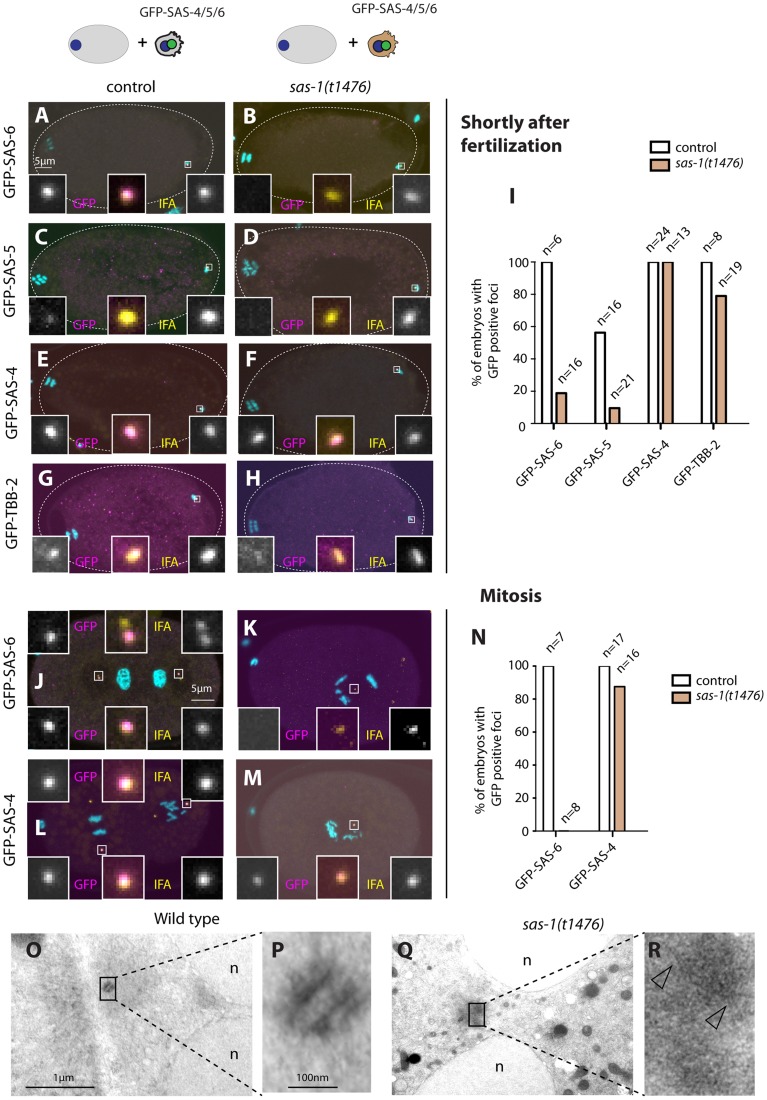
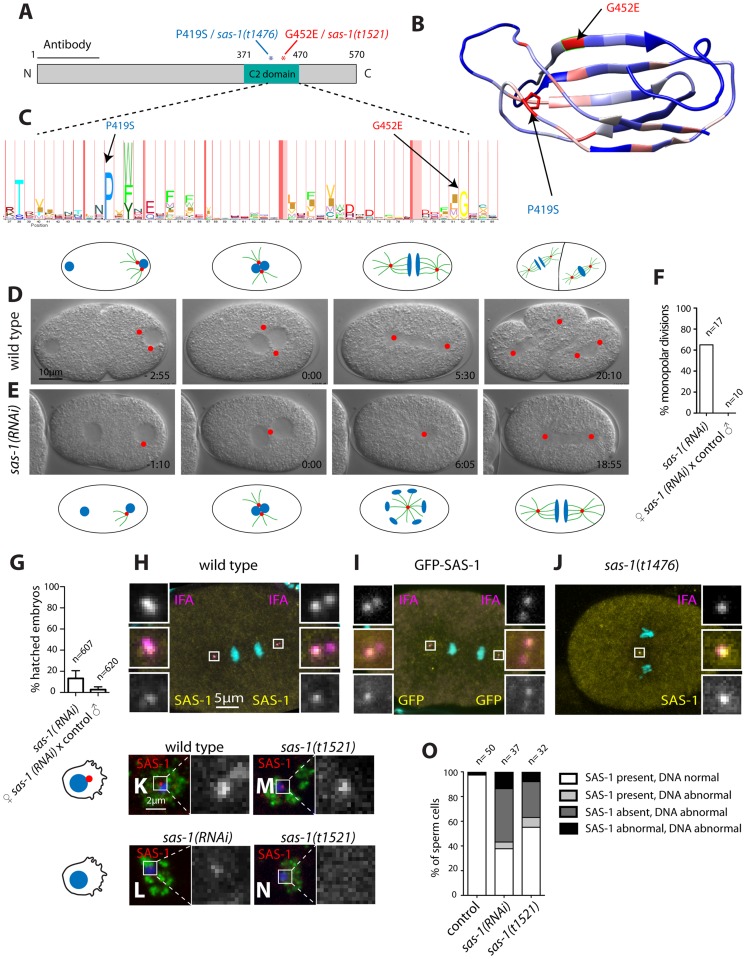
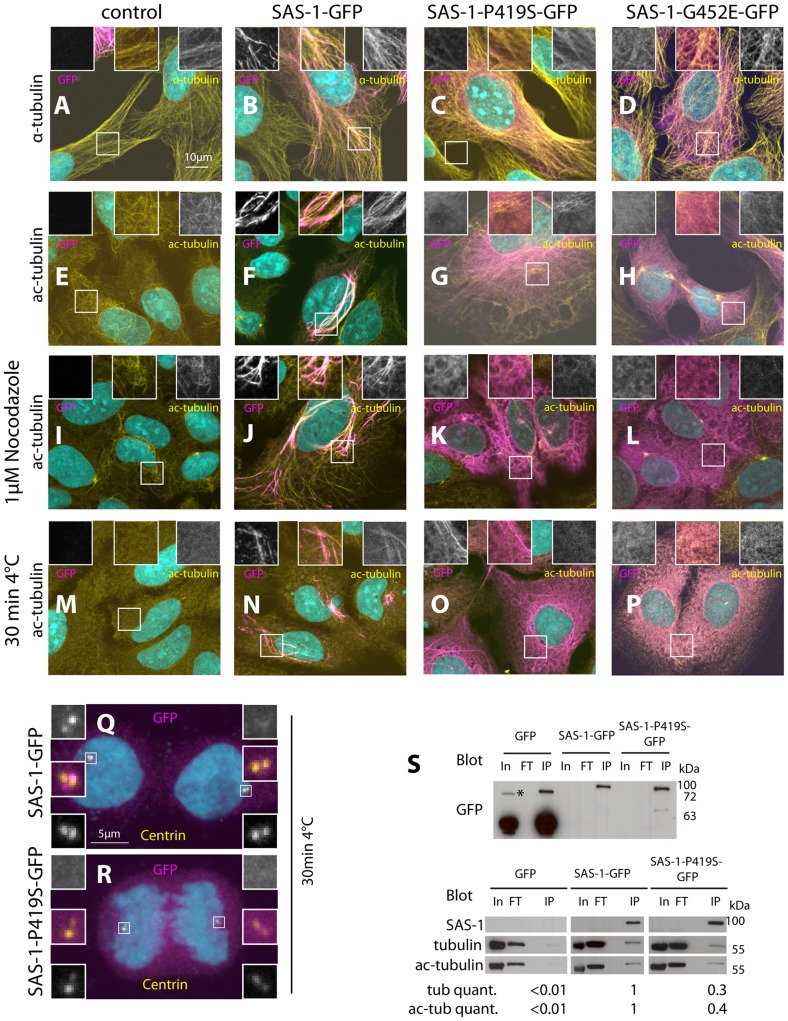
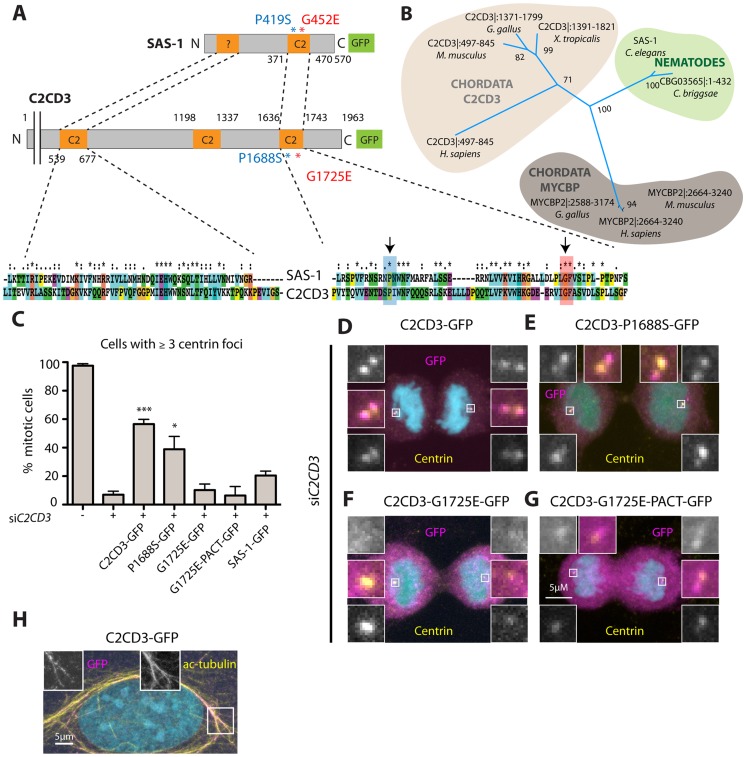
Centrioles are microtubule-based organelles important for the formation of cilia, flagella and centrosomes. Despite progress in understanding the underlying assembly mechanisms, how centriole integrity is ensured is incompletely understood, including in sperm cells, where such integrity is particularly critical. We identified C. elegans sas-1 in a genetic screen as a locus required for bipolar spindle assembly in the early embryo. Our analysis reveals that sperm-derived sas-1 mutant centrioles lose their integrity shortly after fertilization, and that a related defect occurs when maternal sas-1 function is lacking. We establish that sas-1 encodes a C2 domain containing protein that localizes to centrioles in C. elegans, and which can bind and stabilize microtubules when expressed in human cells. Moreover, we uncover that SAS-1 is related to C2CD3, a protein required for complete centriole formation in human cells and affected in a type of oral-facial-digital (OFD) syndrome.


Conflict of interest statement

The authors have declared that no competing interests exist.

Figures

Figure 1
Figure 1. sas-1 is a paternal-effect mutation required for bipolar spindle assembly in the embryo.
(A–B) Images from DIC time-lapse recording of wild type (A) or sas-1(t1476) (B) embryo. In this and other panels, time is indicated in min and sec, with t = 0:00 corresponding to pronuclear meeting. Red dots indicate MTOCs. See Movies S1 and S2. Schematics are shown to help interpret the corresponding DIC images. (C) Percentage of embryos of the indicated genotypes exhibiting monopolar spindle assembly in the first cell cycle. Note that the wild type was only imaged at 24°C. (D) Schematic representing the typical phenotype of one-cell stage embryos resulting from the joining of the indicated gametes. (E) Progeny test of indicated conditions. Although heterozygote sas-1(t1476) are not 100% viable, this likely reflects experimental variability, as the effect is weaker at the restrictive temperature. See also Table S1 and Fig. S1–S3.
Figure 2
Figure 2. sas-1 is required paternally for centriole integrity in the embryo.
(A–H, J–M) sas-1(t1476) heterozygote (control, A, C, E, G, J, L) or sas-1(t1476) homozygote (B, D, F, H, K, M) males expressing the indicated GFP fusion proteins were mated to control animals and the resulting embryos analyzed just after fertilization (A–H) or during mitosis (J–M), staining for GFP (magenta) and IFA (yellow). DNA is shown in cyan. In this and other figures, insets are ∼6 fold magnified views of boxed regions unless stated otherwise. (I, N) Quantification of experiments shown in A–H (I) and J–M (N). (O–R) Electron micrograph of a wild type centriole (O–P) and of a serially-sectioned sas-1(t1476) mutant embryo at pronuclear meeting (Q–R). Note electron dense material in the sas-1 mutant embryo, with no recognizable centriolar cylinder. 3 sas-1(t1476) embryos were analyzed and no centrioles were found. Note also microtubules emanating from this area (arrowheads). See also Fig. S4–S5.
Figure 3
Figure 3. sas-1 is required maternally for centriole integrity.
(A–E) Images from DIC time-lapse recordings of a wild type embryo (A) and of four embryos resulting from the fertilization of a sas-1(t1476) oocyte by control sperm (B–E). See Movies S1 and S6. Note that in some instances tripolar spindles were observed, presumably because centrioles disintegrate during mitosis (see main text). (F) Schematic showing centriole duplication in the first two cell cycles. C0  =  centrioles contributed by sperm (red), C1  =  centrioles formed next to C0 centrioles (yellow), C2  =  centrioles formed next to C1 centrioles (blue). Blue lines in C1 centrioles indicate formation during the second cell cycle. See also (G–H). (G–H) Visualization of the actual division patterns (G, n = 40 movies) and model 2 (H), with 50’000 simulated embryos. Green  =  Bipolar division, red  =  mono- or tripolar division, black  =  not relevant (descendant of failed division), grey  =  not determined. Insets in (H): a mathematical model of centriole disintegration. This model 2 assumes a probability for the disintegration one cell cycle after C1 formation ( = PD1) and a different probability for disintegration two cell cycles after C1 formation ( = PD2). The most likely probabilities given the experimental data (see F) are PD1 = 0.0625 (0.0253–0.1385, 95% CI) and PD2 = 0.3028 (0.1465–0.4768, 95% CI). The data is from both sas-1(t1476) (N = 16, 6 at 24°C, 10 at 20°C) and sas-1(t1521) (N = 24, 14 at 24°C, 10 at 20°C) mated to either fog-2 or plg-1 males. (I) Progeny test revealing sas-1 maternal requirement. (J) A sas-1 mutant oocyte fertilized by wild type sperm carrying GFP-SAS-6- labeled centrioles, stained for tubulin (cyan), GFP (yellow) and IFA (magenta). DNA is shown in red. Shown are the top 10/20 planes and bottom 10/20 Z-planes; arrows point to the poles of the tripolar figures (note that one MTOC in ABp is present in both bottom and top planes and only indicated once). Note that whereas the tripolar figures are in ABp and EMS, the paternal GFP-SAS-6 positive centrioles are in ABa and P2; N = 8 embryos at the four-cell stage that exhibit a phenotype in at the least one blastomere. Given that there are 32 blastomeres in total and that 10 of them exhibited abnormal spindle assembly (6 embryos with one abnormal blastomere, 2 embryos with two abnormal blastomeres –ABp and EMS in one case, ABa and EMS in the other) and assuming that paternally contributed centrioles have a 50% chance of ending up in any blastomere, it follows that the likelihood that the absence of paternal centrioles in those blastomeres that exhibit abnormal spindle assembly is purely due to chance is 0.510 = 9.7×10⁻⁴.
Figure 4
Figure 4. SAS-1 is a C2 domain containing protein that localizes to centrioles.
(A) Schematic of SAS-1 protein architecture with an indication of the single amino acid substitutions in the two sas-1 alleles, and the part against which the antibody was raised. (B) 3D model of the predicted C2 domain of SAS-1 (aa 371–470). Coloring of the residues is according to conservation (blue least, red most). The two amino acids mutated in the sas-1 alleles are indicated. (C) Hidden Markov Model (HMM) representation of the C2 domain, obtained from Pfam (PF00168) . (D–E) Images from DIC time-lapse recordings of wild type (D) and sas-1(RNAi) (E) embryo. (F) Quantification of sas-1(RNAi) phenotype by time-lapse DIC microscopy. (G) Progeny test revealing the paternal requirement for sas-1(RNAi). The two experiments were not from the same batch of RNAi plates, likely explaining the lower viability in the progeny of the mated animals. (H–J) Immunostainings of a GFP-SAS-1 embryo for GFP (yellow) and IFA (magenta) (I), as well as of a wild type (H) or sas-1(t1476) (J) embryo stained for SAS-1 (yellow) and IFA (magenta). DNA is in cyan in all panels. (K–N) Wild type (K), sas-1(RNAi) (L) and sas-1(t1521) (M–N) sperm cells stained with the sperm marker SP-56 (green) and SAS-1 (red and shown alone in magnified panels). DNA is in blue. Note that a signal is present in (M), while it is absent in (N). Note that in (O), SAS-1 abnormal indicates that SAS-1 is either absent or, alternatively, present in too many foci, which we interpret to reflect meiotic defects and/or centrioles in the process of disintegrating. Note also that in sas-1(RNAi), ∼6% of sperm cells do not harbor SAS-6, indicating that under those conditions, some sperm cells may be without centrioles altogether. Note that these experiments were performed with sas-1(t1521). (O) Quantification of experiments shown in (K–N). See also Fig. S6.
Figure 5
Figure 5. SAS-1 is a stable centriolar component recruited very early after fertilization independently of other centriolar proteins.
(A, D, F, I) Schematics of experiments performed in the corresponding figures. (B, G) Embryos stained for GFP to reveal GFP-SAS-1 (yellow) and IFA (magenta). DNA is in cyan. Note that a GFP focus was not detected in some embryos, perhaps due to a very weak signal. However, some embryos exhibit just one very bright signal, supporting a bona fide asymmetry of SAS-1 distribution between the two sperm centrioles. Note that the embryo in B is in telophase of the one-cell stage. (E) Quantification of FRAP experiments performed with sas-1(t1476) GFP-SAS-1 embryos bleached at indicated time points. Centriolar signal intensity was quantified as depicted in (D). A schematic of an experiment performed at pronuclear meeting is shown in (D). (C, H) Quantification of experiments shown in B and G. Note that in C, embryos from the 1- until the 4-cell stage were scored. (J–N) Indicated components were inactivated using RNAi in GFP-SAS-1 hermaphrodites, which were mated with control males that contributed unlabeled paternal centrioles. Embryos were stained for SAS-1 (yellow) and GFP (magenta), except (N), where IFA was used instead of SAS-1 (yellow). DNA is in cyan. N = 10 for each condition.
Figure 6
Figure 6. Overexpression of SAS-1 in human cells reveals microtubule binding and stabilization activities.
(A–R) U2OS cells not expressing (control, A, E, I, M) or expressing wild type SAS-1-GFP (B, F, J, N, Q), SAS-1-P419S GFP (C, G, K, O, R) or SAS-1-G452E GFP (D, H, L, P) stained for GFP (magenta), as well as α-tubulin (A–D), acetylated tubulin (E–P) or centrin (Q–R) (yellow). DNA is in cyan. Insets in (A–P) are 2 fold magnified views, those in (Q–R) 3 fold magnified views. In (M–R), microtubules were depolymerized by placing cells 30 min on ice cold lead blocks, in (I–L), by treating them with 1 µM nocodazole for 1 h. (S) Immunoprecipitation using the GFP nanotrap of the indicated cell lysates probed with the indicated antibodies. In  =  Input  = 140 µg, FT  =  flow through  = 140 µg, IP  =  immunoprecipitation  = 20% of input. We used 2 mg of protein lysate for GFP, 10 mg for SAS-1-P419S-GFP, and 22 mg for SAS-1-GFP to obtain sufficient material. The tubulin and acetylated tubulin intensity was normalized with the SAS-1 band in SAS-1-GFP and SAS-1-P419S-GFP, and with the GFP band for GFP. Note that the upper blot is from a different membrane than the lower one. The asterisk indicates a probably dimeric form of GFP. N = 3 for the wild type and the mutant; representative blots are shown.
Figure 7
Figure 7. The human SAS-1 homolog C2CD3 is impaired by mutations important for SAS-1 function.
(A) Schematics and alignment of the most homologous regions of C. elegans SAS-1 and human C2CD3. The arrows indicate the two sas-1 mutations. Asterisks in the alignment indicate identity, colons strongly similar properties, dots weakly similar properties. Among the two proteins, the N-terminal C2 domain (C2CD3) and related region (SAS-1) share ∼30% identity, the C-terminal C2 domains ∼33% identity. (B) Phylogenetic tree based on PSI-BLAST analysis performed with full length SAS-1. The numbers indicate support values for the respective tree branches. Only selected species are shown; note that although widely present across metazoan evolution, a homolog was not identified in Drosophila. Note that we also identified a homology with MYCBP. However, when performing PSI-BLAST analysis with the N-terminus only, MYCBP did not come up, in contrast to C2CD3. (C) U2OS cells expressing the indicated fusion proteins were subjected to siC2CD3, stained for Centrin and GFP; the number of Centrin foci in the resulting mitotic cells expressing GFP were scored. Data from ≥3 experiments;>25 cells were counted in each condition, except for two experiments with G1725E PACT, where only very few cells (7 and 4, respectively) were positive for GFP at centrioles. Error bars indicate SEM, *** p<0.001, * p<0.05. (D–G) Mitotic cells depleted of C2CD3 and expressing C2CD3-GFP (D) or the indicated proteins harboring single amino acid substitutions corresponding to the sas-1 mutant alleles (E–G) stained for GFP (magenta), centrin (yellow). DNA is in cyan. (H) An interphase cell expressing C2CD3-GFP showing microtubule co-localization of GFP (magenta) and acetylated tubulin (yellow).

Similar articles

Cited by

References

    1. Nigg EA, Stearns T (2011) The centrosome cycle: Centriole biogenesis, duplication and inherent asymmetries. Nat Cell Biol 13: 1154–1160. - PMC - PubMed
    1. Gönczy P (2012) Towards a molecular architecture of centriole assembly. Nat Rev Mol Cell Biol 13: 425–435. - PubMed
    1. Kemp CA, Kopish KR, Zipperlen P, Ahringer J, O'Connell KF (2004) Centrosome maturation and duplication in C. elegans require the coiled-coil protein SPD-2. Dev Cell 6: 511–523. - PubMed
    1. Pelletier L, Ozlü N, Hannak E, Cowan C, Habermann B, et al. (2004) The Caenorhabditis elegans centrosomal protein SPD-2 is required for both pericentriolar material recruitment and centriole duplication. Curr Biol 14: 863–873. - PubMed
    1. O'Connell KF, Caron C, Kopish KR, Hurd DD, Kemphues KJ, et al. (2001) The C. elegans zyg-1 gene encodes a regulator of centrosome duplication with distinct maternal and paternal roles in the embryo. Cell 105: 547–558. - PubMed

Publication types

MeSH terms

Substances

LinkOut - more resources