. 2014 Nov 20;5(11):e1536.
doi: 10.1038/cddis.2014.500.

Combination simvastatin and metformin induces G1-phase cell cycle arrest and Ripk1- and Ripk3-dependent necrosis in C4-2B osseous metastatic castration-resistant prostate cancer cells

Affiliations

Combination simvastatin and metformin induces G1-phase cell cycle arrest and Ripk1- and Ripk3-dependent necrosis in C4-2B osseous metastatic castration-resistant prostate cancer cells

M A Babcook et al. Cell Death Dis. .

Abstract

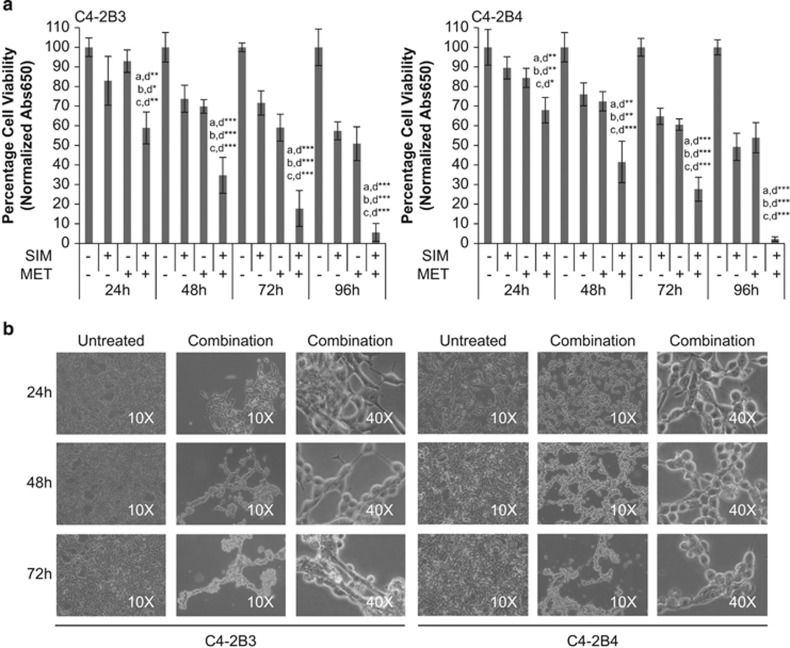
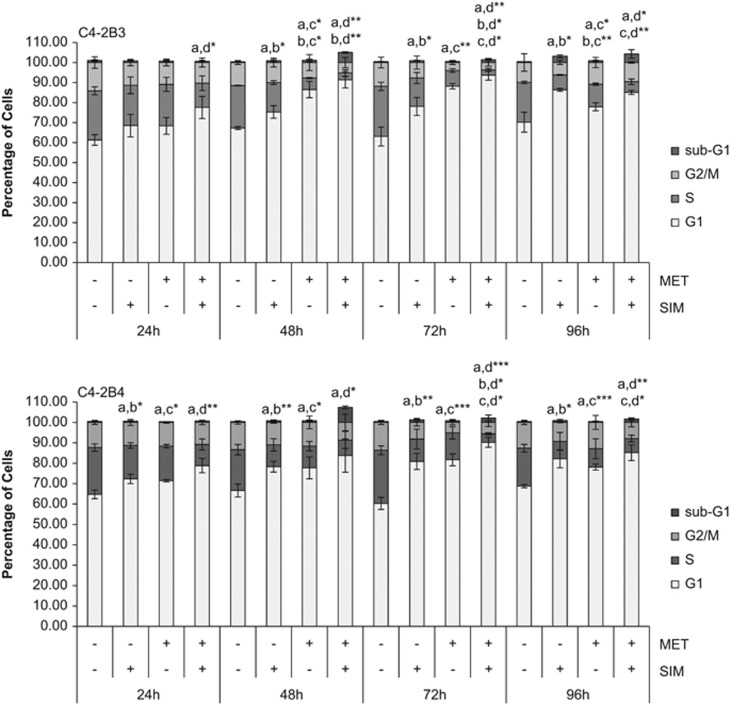
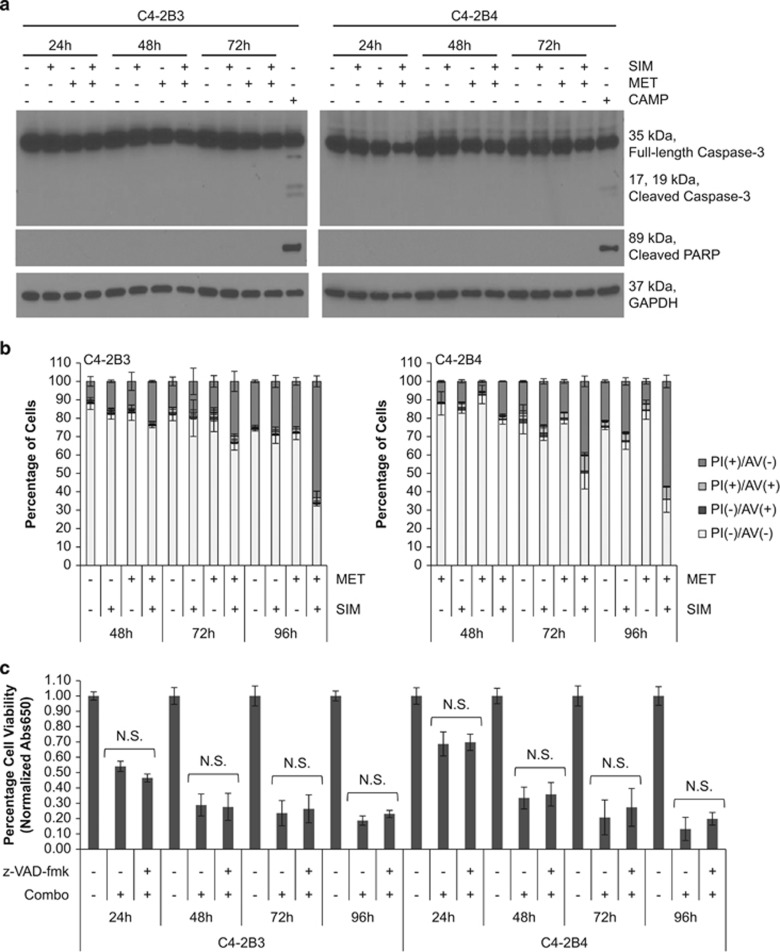
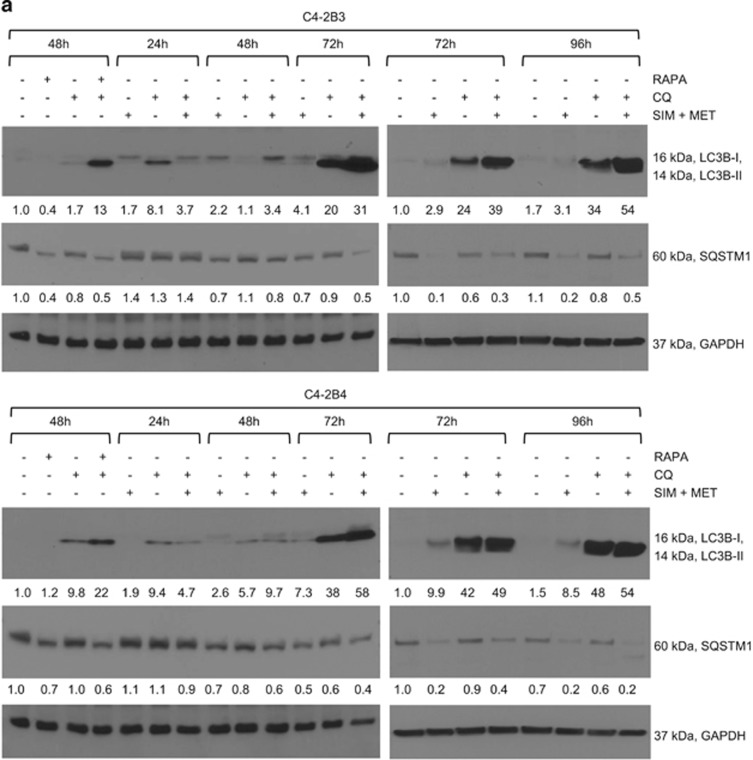
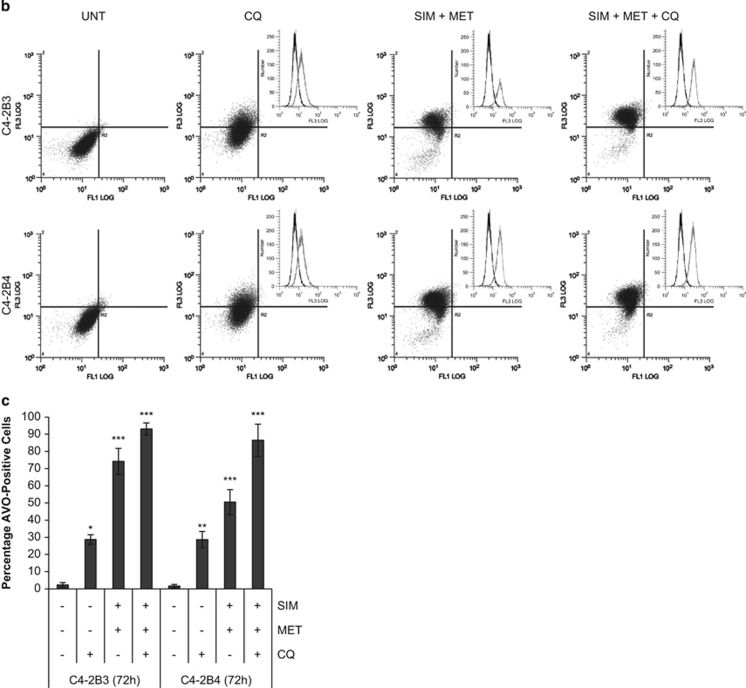
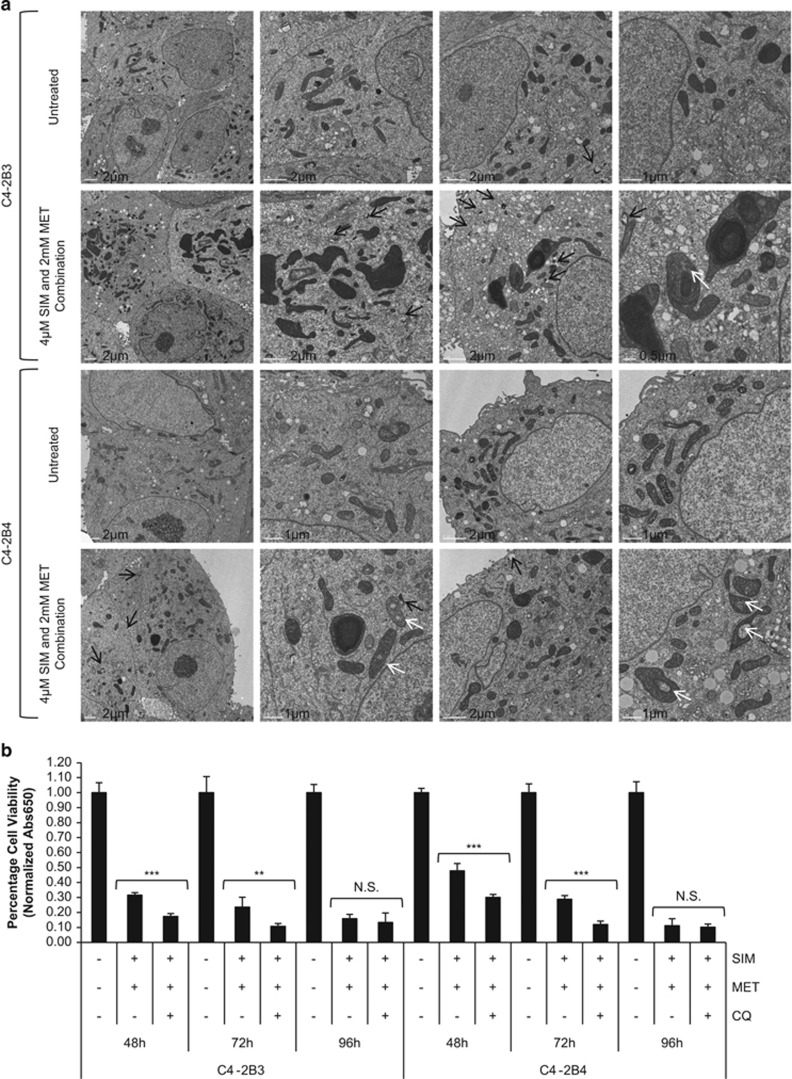
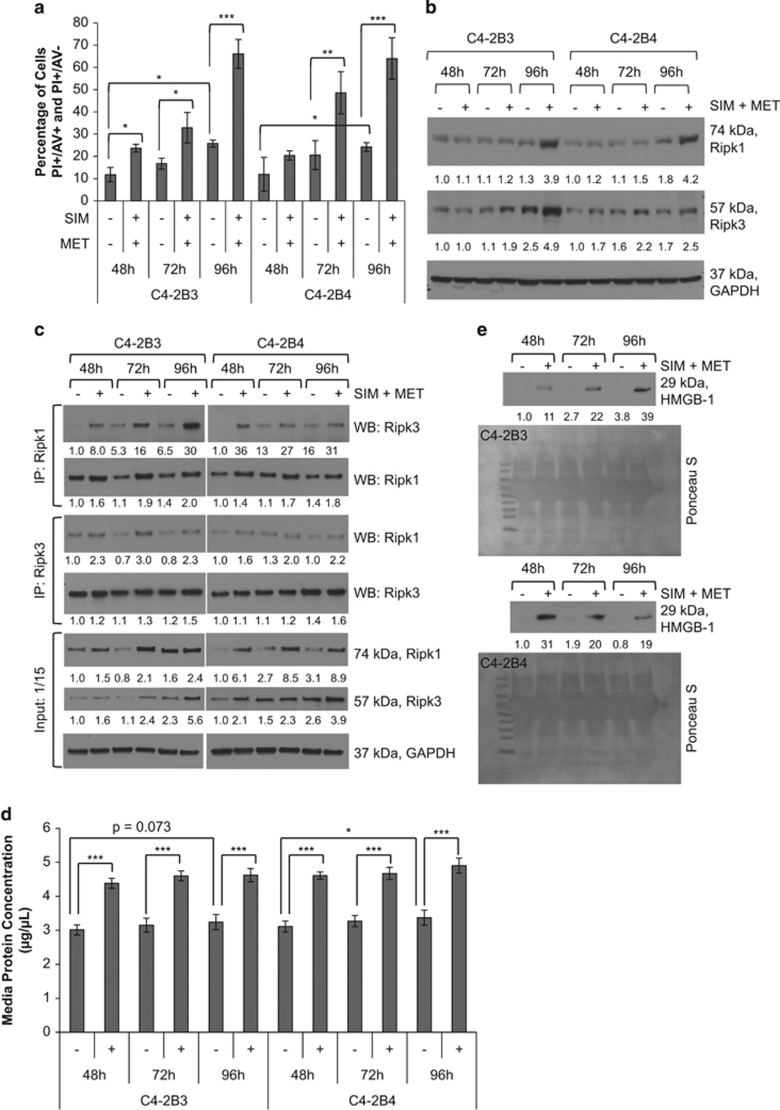
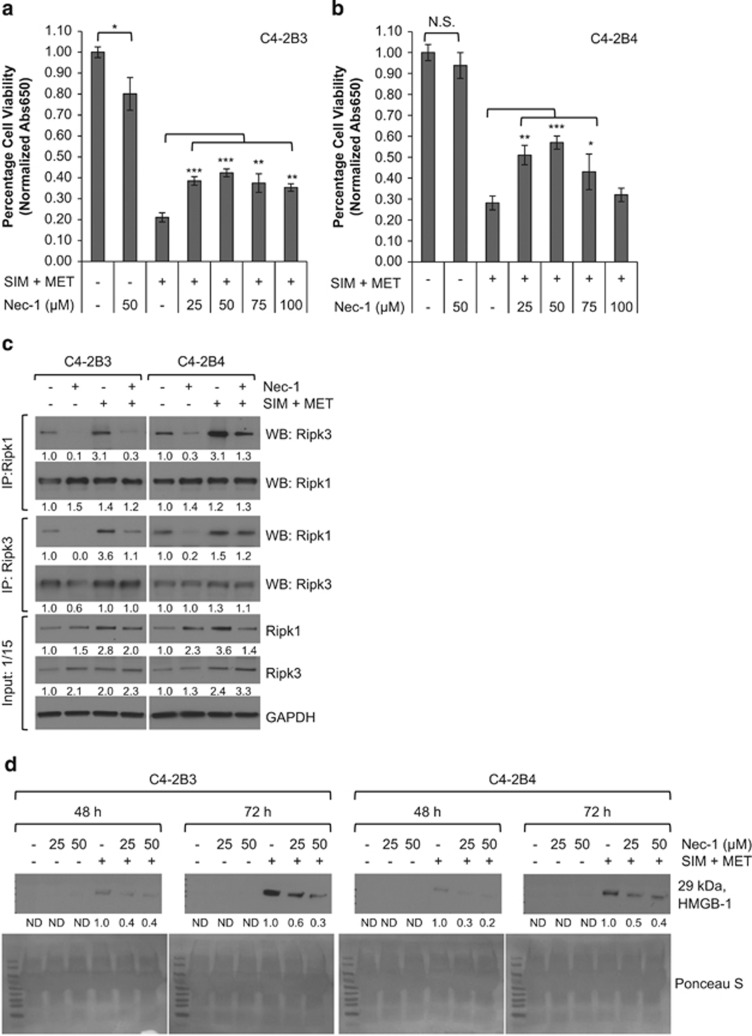
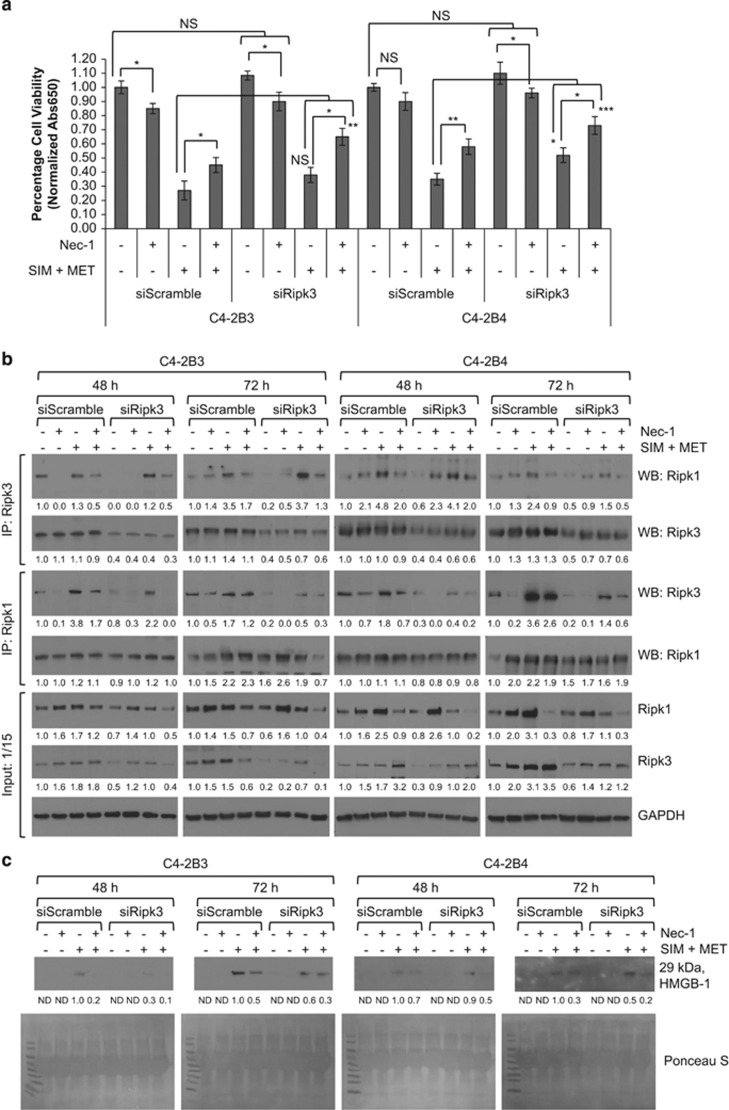
Castration-resistant prostate cancer (CRPC) cells acquire resistance to chemotherapy and apoptosis, in part, due to enhanced aerobic glycolysis and biomass production, known as the Warburg effect. We previously demonstrated that combination simvastatin (SIM) and metformin (MET) ameliorates critical Warburg effect-related metabolic aberrations of C4-2B cells, synergistically and significantly decreases CRPC cell viability and metastatic properties, with minimal effect on normal prostate epithelial cells, and inhibits primary prostate tumor growth, metastasis, and biochemical failure in an orthotopic model of metastatic CRPC, more effectively than docetaxel chemotherapy. Several modes of cell death activated by individual treatment of SIM or MET have been reported; however, the cell death process induced by combination SIM and MET treatment in metastatic CRPC cells remains unknown. This must be determined prior to advancing combination SIM and MET to clinical trial for metastatic CRPC. Treatment of C4-2B cells with combination 4 μM SIM and 2 mM MET (SIM+MET) led to significant G1-phase cell cycle arrest and decrease in the percentage of DNA-replicating cells in the S-phase by 24 h; arrest was sustained throughout the 96-h treatment. SIM+MET treatment led to enhanced autophagic flux in C4-2B cells by 72-96 h, ascertained by increased LC3B-II (further enhanced with lysosomal inhibitor chloroquine) and reduced Sequestosome-1 protein expression, significantly increased percentage of acidic vesicular organelle-positive cells, and increased autophagic structure accumulation assessed by transmission electron microscopy. Chloroquine, however, could not rescue CRPC cell viability, eliminating autophagic cell death; rather, autophagy was upregulated by C4-2B cells in attempt to withstand chemotherapy. Instead, SIM+MET treatment led to Ripk1- and Ripk3-dependent necrosis by 48-96 h, determined by propidium iodide-Annexin V flow cytometry, increase in Ripk1 and Ripk3 protein expression, necrosome formation, HMGB-1 extracellular release, and necrotic induction and viability rescue with necrostatin-1 and Ripk3-targeting siRNA. The necrosis-inducing capacity of SIM+MET may make these drugs a highly-effective treatment for apoptosis- and chemotherapy-resistant metastatic CRPC cells.


Figures

Figure 1
Figure 1
Combination simvastatin and metformin treatment significantly inhibits C4-2B metastatic CRPC cell viability. (a) Percentage cell viability (mean±S.D.) by the methylene blue assay in C4-2B3 and C4-2B4 cells following treatment with 4 μM simvastatin (SIM) and/or 2 mM metformin (MET) for 24−96 h, n=3 per treatment group. *P<0.05, **P<0.01, ***P<0.001 determined by ANOVA followed by the Tukey multiple comparison procedure where a=untreated, b=SIM, c=MET, and d=SIM+MET in comparisons. (b) Light microscope images at × 10 and × 40 magnification of untreated and combination 4 μM SIM and 2 mM MET-treated C4-2B3 and C4-2B4 cells at 24−72 h (96 h not shown as only 2−6% of SIM+MET-treated C4-2B cells remain viable at that time point)
Figure 2
Figure 2
Combination simvastatin and metformin treatment induces significant, sustained G1-phase cell cycle arrest in C4-2B metastatic CRPC cells. C4-2B3 and C4-2B4 cells were treated with 4 μM simvastatin (SIM) and 2 mM metformin (MET) for 24−96 h followed by staining with propidium iodide and analysis by flow cytometry. Percentage of cells (mean±S.D.) in G1, S, and G2/M phases of the cell cycle and sub-G1 represented in bar graphs, n=3 per treatment group. Significance of G1-phase cell cycle arrest, where *P<0.05, **P<0.01, ***P<0.001, determined by ANOVA followed by the Tukey multiple comparison procedure where a=untreated, b=SIM, c=MET, and d=SIM+MET in comparisons
Figure 3
Figure 3
Combination simvastatin and metformin treatment does not induce apoptosis in C4-2B metastatic CRPC cells. (a) Western blot analysis of total and cleaved caspase-3 and cleaved PARP protein expression from total cell lysates of C4-2B3 and C4-2B4 cells following treatment with 4 μM simvastatin (SIM) and/or 2 mM metformin (MET) for 24−72 h. Total cell lysates of C4-2B3 and C4-2B4 cells treated with 2 μM (S)-(+)-camptothecin (CAMP) for 48 h used as apoptosis positive control. GAPDH used as loading control. (b) C4-2B3 and C4-2B4 cells treated with 4 μM SIM and/or 2 mM MET for 48−96 h followed by staining with FITC-conjugated Annexin V (AV) and propidium iodide (PI) and analyzed by flow cytometry. Percentage of PI(−)AV(−), PI(−)AV(+), PI(+)AV(−), and PI(+)AV(+) cells demonstrated in bar graphs of mean±S.D. from triplicate samples. Representative density plots of controls and samples shown in Supplementary Figure S1. (c) Percentage cell viability (mean±S.D.) by methylene blue assay of C4-2B3 and C4-2B4 cells following treatment with combination 4 μM SIM and 2 mM MET±10 μM z-VAD-fmk pan-caspase inhibitor for 24−96 h, n=3 per treatment group. NS denotes not significant difference in cell viability between the treatment groups of SIM+MET in presence or absence of z-VAD-fmk as determined by the two-tailed Student's t-test
Figure 4
Figure 4
Combination simvastatin and metformin treatment increases autophagic flux in C4-2B metastatic CRPC cells. (a) Western blot analysis of LC3B-I and -II and sequestosome 1 (SQSTM1) protein expression in total cell lysates of C4-2B3 and C4-2B4 cells following treatment with combination 4 μM simvastatin (SIM) and 2 mM metformin (MET) and/or 10 μM chloroquine (CQ) lysosomal inhibitor for 24−96 h. Total cell lysates of C4-2B3 and C4-2B4 cells treated with 500nM rapamycin (RAPA) and/or 10 μM CQ used as autophagic flux positive controls. GAPDH used as loading control. (b) Representative density plots of acidic vesicular organelles (AVOs) by acridine orange staining using flow cytometry in C4-2B3 and C4-2B4 cells treated with combination 4 μM SIM and 2 mM MET±10 μM CQ for 72 h. In acridine orange-stained cells, the nucleus fluoresces green (FL1, 525 nm emission, x-axis), whereas acidic compartments fluoresce red (FL3, 620 nm emission, y-axis). The intensity of red fluorescence is proportional to the degree of acidity and to the volume of AVOs, including autophagic vacuoles. Insets show increase in red fluorescence (FL3, x-axis) with treatment compared with untreated control. (c) Quantification (mean±S.D.) of percentages of cells from each treatment group from b with a significant proportion of AVOs, n=3 separate experiments. *P<0.05, **P<0.01, ***P<0.001 determined by a two-tailed Student's t-test compared with untreated control. Representative density plots and quantification of positive controls shown in Supplementary Figure S4
Figure 4
Figure 4
Combination simvastatin and metformin treatment increases autophagic flux in C4-2B metastatic CRPC cells. (a) Western blot analysis of LC3B-I and -II and sequestosome 1 (SQSTM1) protein expression in total cell lysates of C4-2B3 and C4-2B4 cells following treatment with combination 4 μM simvastatin (SIM) and 2 mM metformin (MET) and/or 10 μM chloroquine (CQ) lysosomal inhibitor for 24−96 h. Total cell lysates of C4-2B3 and C4-2B4 cells treated with 500nM rapamycin (RAPA) and/or 10 μM CQ used as autophagic flux positive controls. GAPDH used as loading control. (b) Representative density plots of acidic vesicular organelles (AVOs) by acridine orange staining using flow cytometry in C4-2B3 and C4-2B4 cells treated with combination 4 μM SIM and 2 mM MET±10 μM CQ for 72 h. In acridine orange-stained cells, the nucleus fluoresces green (FL1, 525 nm emission, x-axis), whereas acidic compartments fluoresce red (FL3, 620 nm emission, y-axis). The intensity of red fluorescence is proportional to the degree of acidity and to the volume of AVOs, including autophagic vacuoles. Insets show increase in red fluorescence (FL3, x-axis) with treatment compared with untreated control. (c) Quantification (mean±S.D.) of percentages of cells from each treatment group from b with a significant proportion of AVOs, n=3 separate experiments. *P<0.05, **P<0.01, ***P<0.001 determined by a two-tailed Student's t-test compared with untreated control. Representative density plots and quantification of positive controls shown in Supplementary Figure S4
Figure 5
Figure 5
C4-2B metastatic CRPC cells upregulate autophagy as a protective mechanism against combination simvastatin and metformin treatment. (a) Transmission electron microscopy pictures of untreated and combination 4 μM simvastatin (SIM) and 2 mM metformin (MET)-treated C4-2B3 and C4-2B4 cells at 72 h. Black arrows show double-membrane degradative (i.e., lysosome associated with vesicle) and lucent autophagic vesicles. White arrows show potentially mitoptotic mitochondria. Scale bar noted on images. (b) Percentage cell viability (mean±S.D.) by methylene blue in C4-2B3 and C4-2B4 cells following treatment with combination 4 μM SIM and 2 mM MET±10 μM chloroquine (CQ) lysosomal inhibitor for 48−96 h, n=3 per group. **P<0.01, ***P<0.001, and NS=no significant difference between treatment groups of SIM+MET in presence or absence of CQ, as determined by the two-tailed Student's t-test
Figure 6
Figure 6
Combination simvastatin and metformin treatment induces necrotic cell death in C4-2B metastatic CRPC cells. (a) C4-2B3 and C4-2B4 cells treated with 4 μM simvastatin (SIM) and 2 mM metformin (MET) for 48−96 h followed by staining with FITC-conjugated Annexin V (AV) and propidium iodide (PI) and analyzed by flow cytometry. Percentage of cells (mean±S.D.) staining PI+ (PI(+)AV(+) and PI(+)AV(−)) depicted in bar graphs, n=3 separate cytometric experiments. *P<0.05, **P<0.01, ***P<0.001 determined by ANOVA followed by the Tukey multiple comparison procedure. (b) Western blot analysis of Ripk1 and Ripk3 protein expression in total cell lysates of C4-2B3 and C4-2B4 cells following treatment with combination 4 μM SIM and 2 mM MET for 48−96 h. GAPDH used as loading control. (c) Treatment of C4-2B3 and C4-2B4 cells with combination 4 μM SIM and 2 mM MET for 48−96 h induces association of Ripk1 and Ripk3 in a time-dependent manner. Immunoprecipitation of 600 μg protein from total cell lysates was conducted with Ripk1 and Ripk3 antibodies followed by western blot with Ripk1, Ripk3, and GAPDH antibodies. No GAPDH detected in immunoprecipitates (not shown). Forty μg protein from total cell lysates were also immunoblotted as a control (input). Protein expression was quantified by densitometry normalized to GAPDH loading control (mean from two separate experiments). (d) Protein concentration (mean±S.D.) of conditioned media from C4-2B3 and C4-2B4 cells following treatment with combination 4 μM SIM and 2 mM MET for 48−96 h, n=3 separate experiments. *P<0.05, ***P<0.001 determined by ANOVA followed by the Tukey multiple comparison procedure. (e) Western blot analysis of HMGB-1 protein in 40 μl conditioned media from C4-2B3 and C4-2B4 cells following treatment with combination 4 μM SIM and 2 mM MET for 48−96 h. HMGB-1 protein expression quantified by densitometry (mean from two separate experiments). Ponceau S stain used to demonstrate equal loading
Figure 7
Figure 7
SIM+MET-induced necrosis in C4-2B metastatic CRPC cells is in part Ripk1 dependent. (a,b) Percentage cell viability (mean±S.D.) by the methylene blue assay in C4-2B3 and C4-2B4 cells following treatment with 50 μM Ripk1 inhibitor necrostatin-1 (Nec-1) or combination 4 μM simvastatin (SIM) and 2 mM metformin (MET)±25−100 μM Nec-1 for 72 h, n=3 separate experiments. *P<0.05, **P<0.01, ***P<0.001, NS=not significant, as determined by ANOVA followed by the Tukey multiple comparison procedure. (c) Treatment of C4-2B3 and C4-2B4 cells with 50 μM Nec-1 for 72 h reduces Ripk1–Ripk3 association. Immunoprecipitation of 600 μg protein from total cell lysates of C4-2B3 and C4-2B4 cells treated with 50 μM Nec-1 and/or combination 4 μM SIM and 2 mM MET was conducted with Ripk1 and Ripk3 antibodies followed by western blot with Ripk1, Ripk3, and GAPDH antibodies. No GAPDH detected in immunoprecipitates (not shown). Protein (40 μg) from total cell lysates were also immunoblotted as a control (input). Protein expression was quantified by densitometry normalized to GAPDH loading control (mean from two separate experiments). (d) Western blot analysis of HMGB-1 protein in 40 μl conditioned media from C4-2B3 and C4-2B4 cells following treatment with 25−50 μM Nec-1 or combination 4 μM SIM and 2 mM MET±25−50 μM Nec-1 for 48−72 h. HMGB-1 protein expression quantified by densitometry (mean from two separate experiments). ND, none detected. Ponceau S stain used to demonstrate equal loading
Figure 8
Figure 8
SIM+MET-induced necrosis in C4-2B metastatic CRPC cells is both Ripk1- and Ripk3 dependent. (a) Percentage cell viability (mean±S.D.) by the methylene blue assay in non-targeting (siScramble) and Ripk3-targeting (siRipk3) siRNA transfected C4-2B3 and C4-2B4 cells following treatment with 50 μM Ripk1 inhibitor necrostatin-1 (Nec-1) or combination 4 μM simvastatin (SIM) and 2 mM metformin (MET)±25−100 μM Nec-1 for 72 h, n=3 separate experiments. *P<0.05, **P<0.01, ***P<0.001, NS=not significant, as determined by ANOVA followed by the Tukey multiple comparison procedure. (b) Treatment of C4-2B3 and C4-2B4 cells with 50 μM Nec-1 for 72 h and siRNA knockdown of Ripk3 expression additively reduces Ripk1–Ripk3 association. Immunoprecipitation of 600 μg protein from total cell lysates of non-targeting (siScramble) and Ripk3-targeting (siRipk3) siRNA-transfected C4-2B3 and C4-2B4 cells treated with 50 μM Nec-1 and/or combination 4 μM SIM and 2 mM MET was conducted with Ripk1 and Ripk3 antibodies followed by western blot with Ripk1, Ripk3, and GAPDH antibodies. No GAPDH was detected in immunoprecipitates (not shown). Forty μg protein from total cell lysates were also immunoblotted as a control (input). Protein expression was quantified by densitometry normalized to GAPDH loading control (mean from two separate experiments). Ripk3 siRNA resulted in 62−64% knockdown in Ripk3 protein expression at 48 h and 48−56% knockdown at 72 h. (c) Western blot analysis of HMGB-1 protein in 40 μl conditioned media from non-targeting (siScramble) and Ripk3-targeting (siRipk3) siRNA-transfected C4-2B3 and C4-2B4 cells following treatment with 50 μM Nec-1 and/or combination 4 μM SIM and 2 mM MET for 48−72 h. HMGB-1 protein expression quantified by densitometry (mean from two separate experiments). ND, none detected. Ponceau S stain used to demonstrate equal loading

References

    1. American Cancer Society. Cancer Facts & Figures 2014. American Cancer Society: Atlanta, GA, USA; 2014.
    1. Cookson MS, Roth BJ, Dahm P, Engstrom C, Freedland SJ, Hussain M, et al. Castration-resistant prostate cancer: AUA Guideline. J Urol. 2013;190:429–438. - PubMed
    1. Loblaw DA, Walker-Dilks C, Winquist E, Hotte SJ, Genitourinary Cancer Disease Site Group of Cancer Care Ontario's Program in Evidence-Based Care Systemic therapy in men with metastatic castration-resistant prostate cancer: a systematic review. Clin Oncol (R Coll Radiol) 2013;25:406–430. - PubMed
    1. Tannock IF, de Wit R, Berry WR, Horti J, Pluzanska A, Chi KN, et al. Docetaxel plus prednisone or mitoxantrone plus prednisone for advanced prostate cancer. N Engl J Med. 2004;351:1502–1512. - PubMed
    1. Vander Heiden MG, Cantley LC, Thompson CB. Understanding the Warburg effect: the metabolic requirements of cell proliferation. Science. 2009;324:1029–1033. - PMC - PubMed

Publication types

MeSH terms

LinkOut - more resources