

Centrosome-declustering drugs mediate a two-pronged attack on interphase and mitosis in supercentrosomal cancer cells
- PMID: 25412316
- PMCID: PMC4260758
- DOI: 10.1038/cddis.2014.505
Centrosome-declustering drugs mediate a two-pronged attack on interphase and mitosis in supercentrosomal cancer cells
Abstract
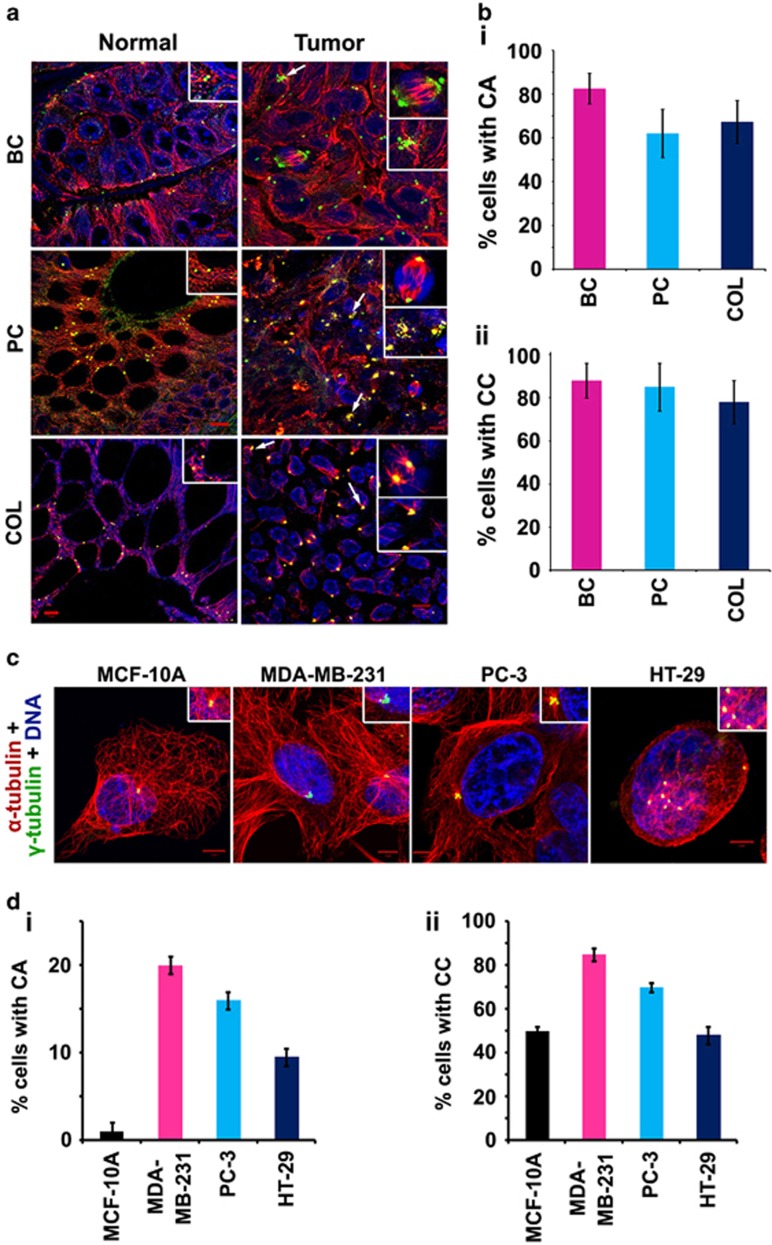
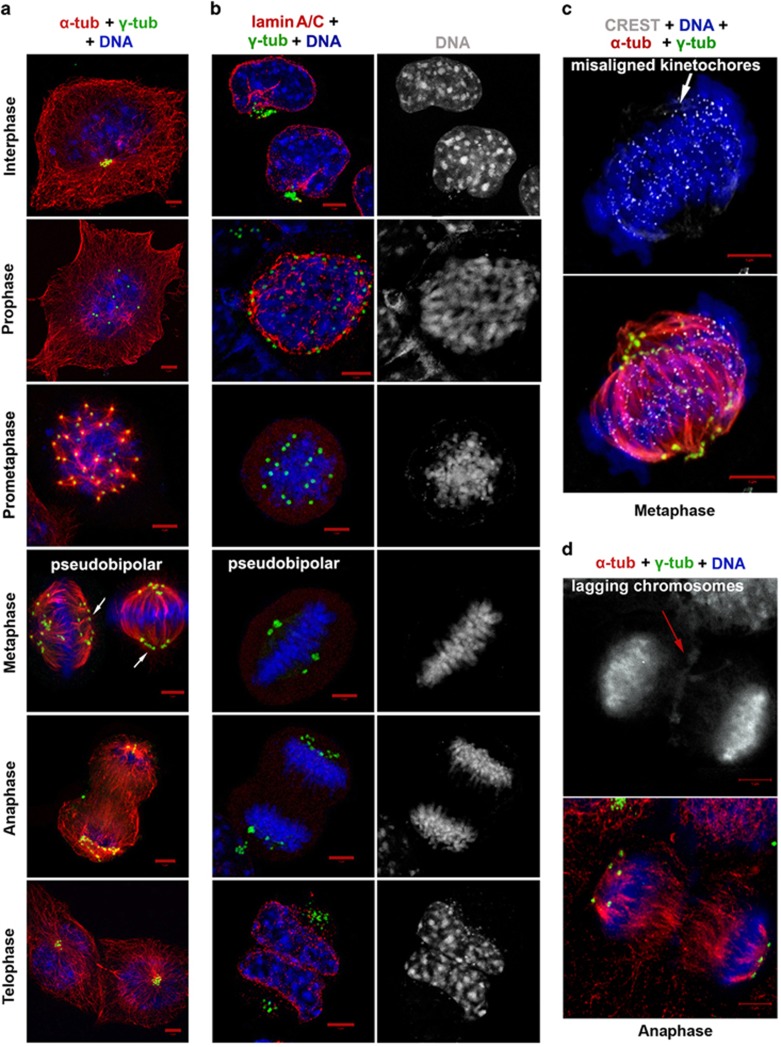
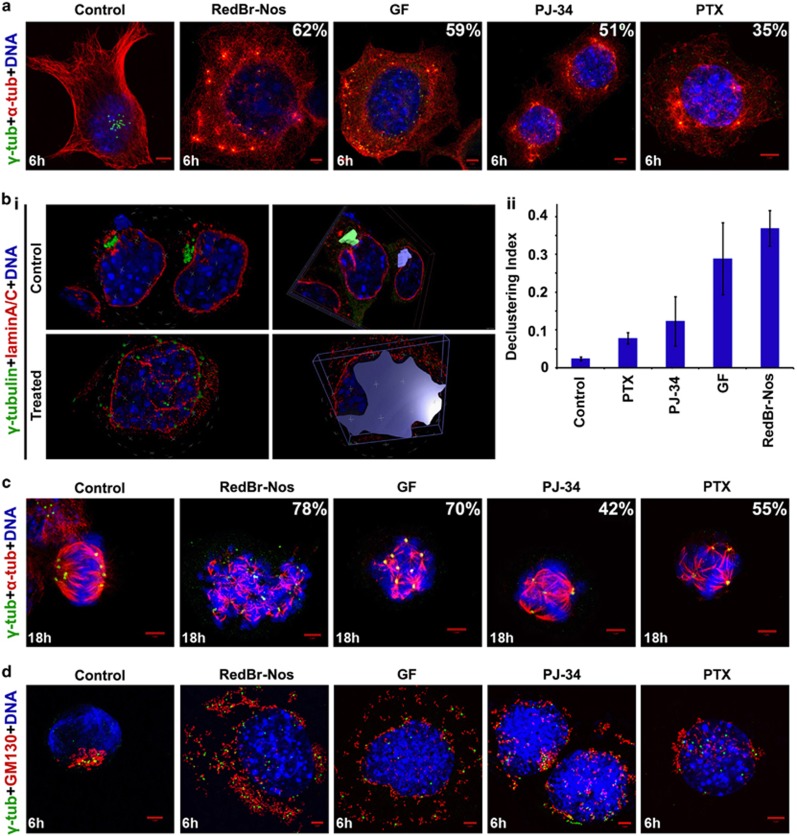
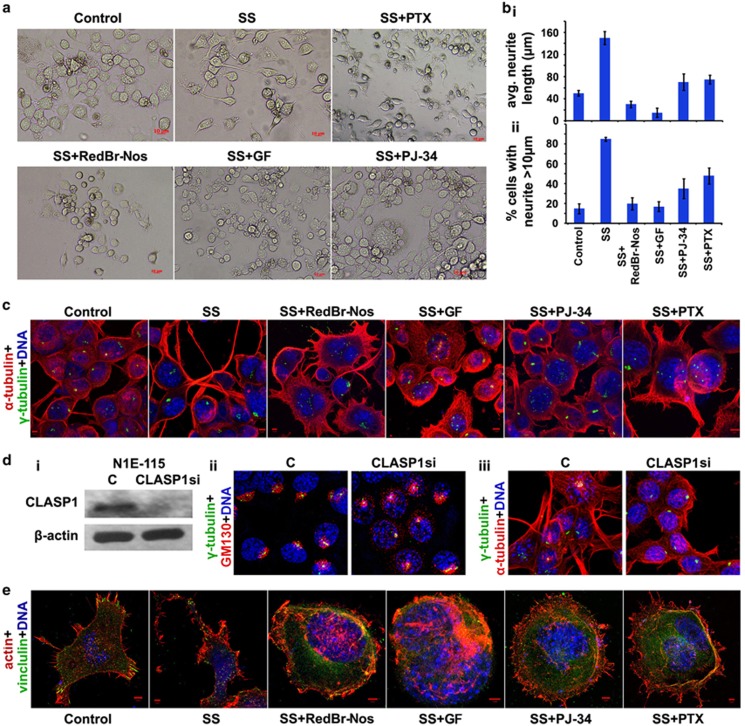
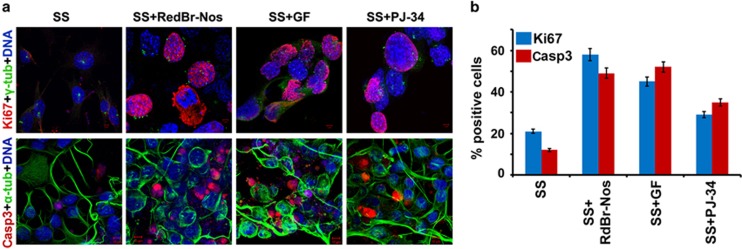
Classical anti-mitotic drugs have failed to translate their preclinical efficacy into clinical response in human trials. Their clinical failure has challenged the notion that tumor cells divide frequently at rates comparable to those of cancer cells in vitro and in xenograft models. Given the preponderance of interphase cells in clinical tumors, we asked whether targeting amplified centrosomes, which cancer cells carefully preserve in a tightly clustered conformation throughout interphase, presents a superior chemotherapeutic strategy that sabotages interphase-specific cellular activities, such as migration. Herein we have utilized supercentrosomal N1E-115 murine neuroblastoma cells as a test-bed to study interphase centrosome declustering induced by putative declustering agents, such as Reduced-9-bromonoscapine (RedBr-Nos), Griseofulvin and PJ-34. We found tight 'supercentrosomal' clusters in the interphase and mitosis of ~80% of patients' tumor cells with excess centrosomes. RedBr-Nos was the strongest declustering agent with a declustering index of 0.36 and completely dispersed interphase centrosome clusters in N1E-115 cells. Interphase centrosome declustering caused inhibition of neurite formation, impairment of cell polarization and Golgi organization, disrupted cellular protrusions and focal adhesion contacts-factors that are crucial prerequisites for directional migration. Thus our data illustrate an interphase-specific potential anti-migratory role of centrosome-declustering agents in addition to their previously acknowledged ability to induce spindle multipolarity and mitotic catastrophe. Centrosome-declustering agents counter centrosome clustering to inhibit directional cell migration in interphase cells and set up multipolar mitotic catastrophe, suggesting that disbanding the nuclear-centrosome-Golgi axis is a potential anti-metastasis strategy.
Figures
Similar articles
-
Identification of griseofulvin as an inhibitor of centrosomal clustering in a phenotype-based screen.Cancer Res. 2007 Jul 1;67(13):6342-50. doi: 10.1158/0008-5472.CAN-07-0663. Cancer Res. 2007. PMID: 17616693
-
Quantitative multi-parametric evaluation of centrosome declustering drugs: centrosome amplification, mitotic phenotype, cell cycle and death.Cell Death Dis. 2014 May 1;5(5):e1204. doi: 10.1038/cddis.2014.164. Cell Death Dis. 2014. PMID: 24787016 Free PMC article.
-
Heading off with the herd: how cancer cells might maneuver supernumerary centrosomes for directional migration.Cancer Metastasis Rev. 2013 Jun;32(1-2):269-87. doi: 10.1007/s10555-012-9413-5. Cancer Metastasis Rev. 2013. PMID: 23114845 Free PMC article. Review.
-
Targeting TAO Kinases Using a New Inhibitor Compound Delays Mitosis and Induces Mitotic Cell Death in Centrosome Amplified Breast Cancer Cells.Mol Cancer Ther. 2017 Nov;16(11):2410-2421. doi: 10.1158/1535-7163.MCT-17-0077. Epub 2017 Aug 22. Mol Cancer Ther. 2017. PMID: 28830982
-
Let's huddle to prevent a muddle: centrosome declustering as an attractive anticancer strategy.Cell Death Differ. 2012 Aug;19(8):1255-67. doi: 10.1038/cdd.2012.61. Epub 2012 Jun 1. Cell Death Differ. 2012. PMID: 22653338 Free PMC article. Review.
Cited by
-
Centrosome amplification, chromosomal instability and cancer: mechanistic, clinical and therapeutic issues.Chromosome Res. 2016 Jan;24(1):105-26. doi: 10.1007/s10577-015-9505-5. Chromosome Res. 2016. PMID: 26645976 Review.
-
Cell cycle-dependent centrosome clustering precedes proplatelet formation.Sci Adv. 2024 Jun 21;10(25):eadl6153. doi: 10.1126/sciadv.adl6153. Epub 2024 Jun 19. Sci Adv. 2024. PMID: 38896608 Free PMC article.
-
Antimitotic activity of DY131 and the estrogen-related receptor beta 2 (ERRβ2) splice variant in breast cancer.Oncotarget. 2016 Jul 26;7(30):47201-47220. doi: 10.18632/oncotarget.9719. Oncotarget. 2016. PMID: 27363015 Free PMC article.
-
Maintaining Genome Stability in Defiance of Mitotic DNA Damage.Front Genet. 2016 Jul 21;7:128. doi: 10.3389/fgene.2016.00128. eCollection 2016. Front Genet. 2016. PMID: 27493659 Free PMC article. Review.
-
Drugging the addict: non-oncogene addiction as a target for cancer therapy.EMBO Rep. 2016 Nov;17(11):1516-1531. doi: 10.15252/embr.201643030. Epub 2016 Oct 4. EMBO Rep. 2016. PMID: 27702988 Free PMC article. Review.
References
-
- Goodell PP, Krasinskas AM, Davison JM, Hartman DJ. Comparison of methods for proliferative index analysis for grading pancreatic well-differentiated neuroendocrine tumors. Am J Clin Pathol. 2012;137:576–582. - PubMed
-
- Andreeff M.Cell Proliferation and Differentiation5th edn.People's Medical Publishing House; 2009
-
- Komlodi-Pasztor E, Sackett D, Wilkerson J, Fojo T. Mitosis is not a key target of microtubule agents in patient tumors. Nat Rev Clin Oncol. 2011;8:244–250. - PubMed
-
- Nigg EA, Raff JW. Centrioles, centrosomes, and cilia in health and disease. Cell. 2009;139:663–678. - PubMed
Publication types
MeSH terms
Substances
Grants and funding
LinkOut - more resources
Full Text Sources
Other Literature Sources
