. 2015 Sep;25(5):552-64.
doi: 10.1111/bpa.12214. Epub 2014 Nov 20.

p62 Deficiency Enhances α-Synuclein Pathology in Mice

Affiliations

p62 Deficiency Enhances α-Synuclein Pathology in Mice

Kunikazu Tanji et al. Brain Pathol. 2015 Sep.

Abstract

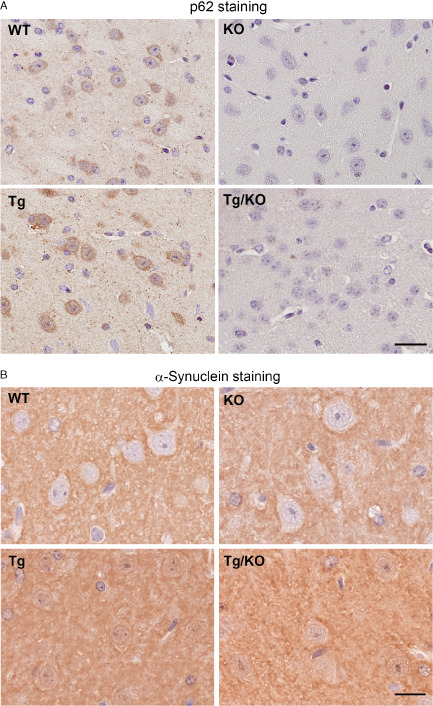
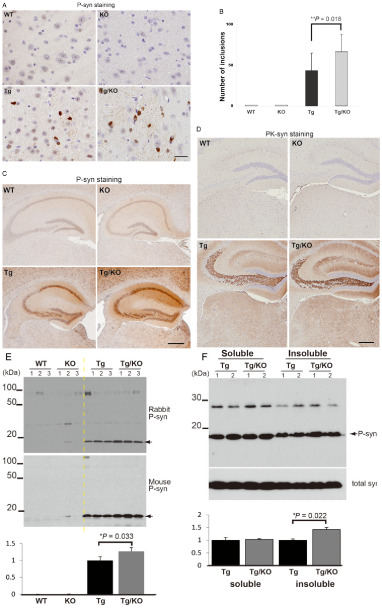
In Lewy body disease (LBD) such as dementia with LBs and Parkinson's disease, several lines of evidence show that disrupted proteolysis occurs. p62/SQSTM1 (p62) is highly involved with intracellular proteolysis and is a component of ubiquitin-positive inclusions in various neurodegenerative disorders. However, it is not clear whether p62 deficiency affects inclusion formation and abnormal protein accumulation. To answer this question, we used a mouse model of LBD that lacks p62, and found that LB-like inclusions were observed in transgenic mice that overexpressed α-synuclein (Tg mice) with or without the p62 protein. p62 deficiency enhanced α-synuclein pathology with regard to the number of inclusions and staining intensity compared with Tg mice that expressed p62. To further investigate the molecular mechanisms associated with the loss of p62 in Tg mice, we assessed the mRNA and protein levels of several molecules, and found that the neighbor of the brca1 gene (NBr1), which is functionally and structurally similar to p62, is increased in Tg mice without p62 compared with control Tg mice. These findings suggest that p62 and NBR1 affect the pathogenesis of neurodegenerative diseases through the cooperative modulation of α-synuclein aggregation.

Keywords: Lewy body disease; Parkinson's disease; p62/Sequestsome 1/SQSTM1; proteolysis; stress; α-synuclein.


Figures

Figure 1
Figure 1
Characterization ofp 62 protein deficiency in an animal model ofL ewy body disease. A. Breeding strategies to generate p62 deficiency in α‐synuclein transgenic (Tg) mice. Initially, heterozygous α‐synuclein Tg and homozygous p62‐knockout (KO) mice were crossed. Next, littermates and heterozygous p62‐deficient mice were mated to generate Tg mice without p62 (Tg/KO), of which four groups were used in this study (black circles). B. Immunoblot analysis confirmed that α‐synuclein was overexpressed in Tg and Tg/KO mice and that p62 signals were diminished in KO and Tg/KO mice (9 weeks of age, n = 6 per group). The molecular mass is indicated on the left side of the panel. β‐Actin was used as a loading control. C. A quantitative analysis shows that human α‐synuclein is expressed in Tg and Tg/KO mice and that p62 is absent in KO and Tg/KO mice. The values of Tg mice are defined as 100%. D. The weight changes of Tg (black circle) and Tg/KO mice (grey circle) are shown (mean ± standard deviation, n = 6–8 per group).
Figure 2
Figure 2
p 62 and α‐synuclein staining in wild‐type ( WT ), knockout ( KO ),T g andT g/ KOmice. A. Immunohistochemical analysis shows that p62 immunoreactivity is observed in WT and Tg mice but not in KO mice (9 weeks of age, n = 6 per group). Bar = 20 μm. B. Human and mouse α‐synuclein is strongly expressed in the presynapse and cytoplasm of cortical neurons in Tg and Tg/KO mice. Bar = 10 μm.
Figure 3
Figure 3
The effect ofp 62 deficiency on abnormal α‐synuclein expression. A. Cytoplasmic inclusions are positive for phosphorylated α‐synuclein (P‐syn) in the thalamus of Tg and Tg/knockout (KO) mice. Bar = 20 μm. B. A quantitative analysis shows that the number of cytoplasmic inclusions is significantly increased in Tg/KO mice when compared with Tg mice (9 weeks of age, n = 6 per group). The groups differed significantly [analysis of variance (ANOVA), F(3, 11) = 160.81, P < 0.01]. C. P‐syn staining is observed in the neurons of the cerebral cortex and hippocampus in Tg and Tg/KO mice. An increased staining intensity is observed in Tg/KO mice compared with Tg mice. Bar = 500 μm. D. No obvious differences in proteinase K‐resistant α‐synuclein (PK‐syn) are found between Tg and Tg/KO mice. Bar = 250 μm. E. P‐syn level is significantly increased in Tg/KO mice compared with Tg mice. Ratio of P‐syn to β‐actin was calculated, and the values of Tg mice are defined as 1.0. The groups differed significantly [ANOVA, F(3, 11) = 147.1, P < 0.01]. F. Triton X‐100 soluble and insoluble samples were prepared from Tg and Tg/KO mice (9 weeks of age, n = 2 per Tg and Tg/KO groups). Insoluble P‐syn level is increased in Tg/KO mice compared with Tg mice. P‐syn levels were normalized by total synuclein, and the values of Tg mice were defined as 1.0 in a soluble or insoluble sample.
Figure 4
Figure 4
p 62‐deficient mice exhibit longer escape latencies due to lower activity. A. The probe trial was completed after 5 days of hidden platform training in the Morris water maze. Wild type (WT, n = 10), p62 knockout (KO, n = 11), α‐synuclein Tg (Tg, n = 9) and α‐synuclein mice lacking p62 (Tg/KO, n = 9) were tested at 9 weeks of age. KO mice take longer to reach the platform location. The groups differed significantly [analysis of variance (ANOVA), F(3, 39) = 4.53, P < 0.01]. B. The percentage of time spent in the target quadrant (black) during a 60 s probe trial of the Morris water maze test. KO mice spend less time in the target quadrant. C. The immobility time of the Morris water maze. Longer immobility times are evident in KO mice. D. Representative path tracings are shown. Light pink indicates the position of the platform. E. A forced swim test was performed at 9–10 weeks of age (n = 9–11 per group) and shows a significant difference in immobility latency, with KO mice lasting longer than 2 s and WT mice remaining mobile for the first 1 minute. F. KO mice exhibit higher immobility times for the first 6 minutes. The groups differed significantly [ANOVA, F(3, 39) = 2.14, P < 0.05]. *P < 0.05.
Figure 5
Figure 5
The effect of p62 deficiency on several kinds of genes. The mRNA levels of genes related to proteolysis and oxidative stress in the brains of WT, KO, Tg and TG/KO mice were determined at 9 weeks of age (n = 3 per group). mRNA was measured by quantitative reverse transcription‐polymerase chain reaction (qRT‐PCR) using the right hemisphere of the brain. Data are normalized by the C yclophilinA mRNA level in each sample, and the average and standard deviation was calculated. qRT‐PCR reveals that there is no significant difference in the K eap1, glutamate‐cysteine ligase catalytic subunit (Gclc), NAD(P)H quinone oxidoreductase 1 (Nqo 1), heme oxygenase‐1 (Ho ‐1), Lamp 1, C athepsinD, TfEB and Rab7l1 levels among the four groups. In contrast, the mRNA level of p 62 (P < 0.01) and Nbr 1 (P < 0.05) are significantly different. The groups differed significantly [analysis of variance, F(3, 11) = 226.86, P < 0.01 in p 62mRNA, F(3, 11) = 14.15, P < 0.01 in Nbr 1mRNA]. The WT values are defined as 100%. *P < 0.05, **P < 0.01.
Figure 6
Figure 6
The effect ofp 62 deficiency on molecules related to proteolysis, oxidative stress and the synapse. A. Expression of Keap1 and NBR1 is significantly increased in Tg/KO mice compared with Tg mice. NAD(P)H quinone oxidoreductase 1 (NQO1), LC3, ubiquitin, synaptophysin and SNAP25 levels are not significantly different between the four groups (9 weeks of age, n = 6 per group). B. A quantitative analysis indicates that the Keap1 and NBR1 levels are significantly increased in p62‐deficient mice compared with mice with p62. The Tg values are defined as 100%. *P < 0.05, **P < 0.01. The groups differed significantly [analysis of variance, F(3, 11) = 7.44, P = 0.011 in Keap1, F(3, 11) = 4.27, P = 0.045 in NBR1].
Figure 7
Figure 7
The spatial patterns ofp 62 andNBR 1 in the mouse brain. A. Equal amounts of homogenates from the indicated regions were analyzed by immunoblotting (12 weeks of age, n = 2 in wild‐type mice). Antibodies against NBR1 (upper) or p62 (bottom) were used to detect endogenous proteins. NBR1 is mainly expressed in the olfactory bulb, temporal and occipital cortices, striatum, thalamus and hypothalamus. The highest expression of p62 is observed in the olfactory bulb, striatum, temporal and occipital cortices, hippocampus, thalamus, hypothalamus and medulla oblongata. β‐Actin is used as a loading control. B. Distribution patterns of NBR1 and p62 in the sagittal section of mice brains. NBR1 or p62 levels are normalized by β‐actin. The circles represent the size of the expression level. C. NBR1 immunostaining in Tg and Tg/KO mice (9 weeks of age, n = 6 per group). NBR1 immunoreactivity is mainly detected in neurons of the thalamus of both Tg and Tg/KO mice. Note the increased intensity of NBR1 immunoreactivity in Tg/KO mice compared with Tg mice. Bar = 30 μm.

References

    1. Bartlett BJ, Isakson P, Lewerenz J, Sanchez H, Kotzebue RW, Cumming RC et al (2011) p62, Ref(2)P and ubiquitinated proteins are conserved markers of neuronal aging, aggregate formation and progressive autophagic defects. Autophagy 7:572–583. - PMC - PubMed
    1. Bedford L, Hay D, Devoy A, Paine S, Powe DG, Seth R et al (2008) Depletion of 26S proteasomes in mouse brain neurons causes neurodegeneration and Lewy‐like inclusions resembling human pale bodies. J Neurosci 28:8189–8198. - PMC - PubMed
    1. Braak H, Thal DR, Del Tredici K (2011) Nerve cells immunoreactive for p62 in select hypothalamic and brainstem nuclei of controls and Parkinson's disease cases. J Neural Transm 118:809–819. - PubMed
    1. Coupe B, Ishii Y, Dietrich MO, Komatsu M, Horvath TL, Bouret SG (2012) Loss of autophagy in pro‐opiomelanocortin neurons perturbs axon growth and causes metabolic dysregulation. Cell Metab 15:247–255. - PMC - PubMed
    1. Doi H, Adachi H, Katsuno M, Minamiyama M, Matsumoto S, Kondo N et al (2013) p62/SQSTM1 differentially removes the toxic mutant androgen receptor via autophagy and inclusion formation in a spinal and bulbar muscular atrophy mouse model. J Neurosci 33:7710–7727. - PMC - PubMed

Publication types

MeSH terms