

Large-scale drivers of malaria and priority areas for prevention and control in the Brazilian Amazon region using a novel multi-pathogen geospatial model
- PMID: 25412882
- PMCID: PMC4247612
- DOI: 10.1186/1475-2875-13-443
Large-scale drivers of malaria and priority areas for prevention and control in the Brazilian Amazon region using a novel multi-pathogen geospatial model
Abstract
Background: Most of the malaria burden in the Americas is concentrated in the Brazilian Amazon but a detailed spatial characterization of malaria risk has yet to be undertaken.
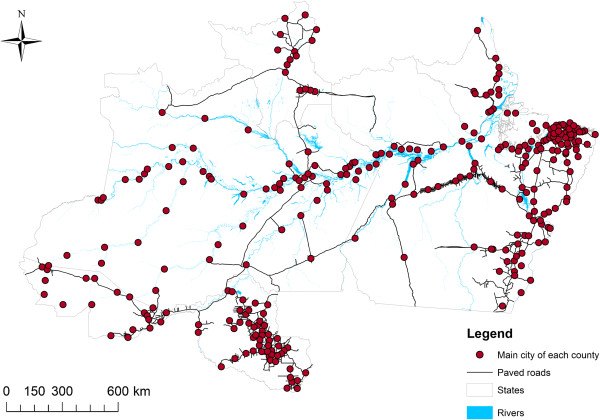
Methods: Utilizing 2004-2008 malaria incidence data collected from six Brazilian Amazon states, large-scale spatial patterns of malaria risk were characterized with a novel Bayesian multi-pathogen geospatial model. Data included 2.4 million malaria cases spread across 3.6 million sq km. Remotely sensed variables (deforestation rate, forest cover, rainfall, dry season length, and proximity to large water bodies), socio-economic variables (rural population size, income, and literacy rate, mortality rate for children age under five, and migration patterns), and GIS variables (proximity to roads, hydro-electric dams and gold mining operations) were incorporated as covariates.
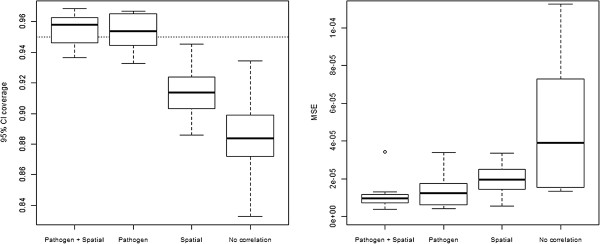
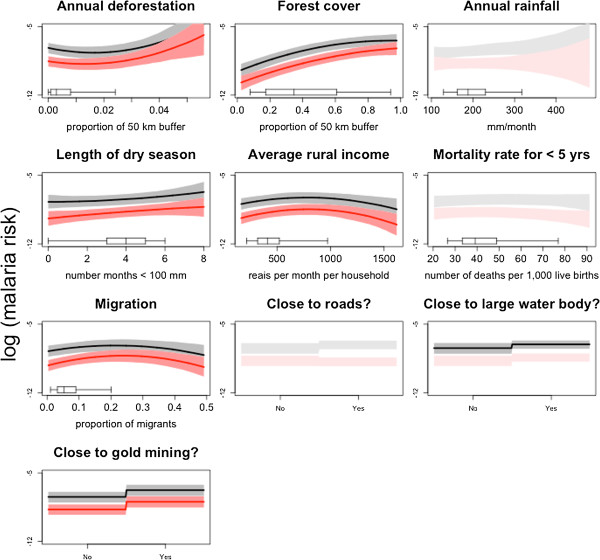
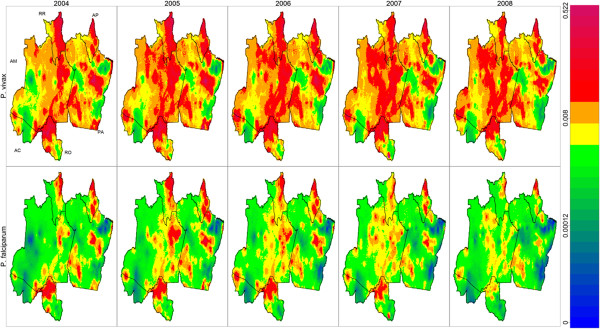
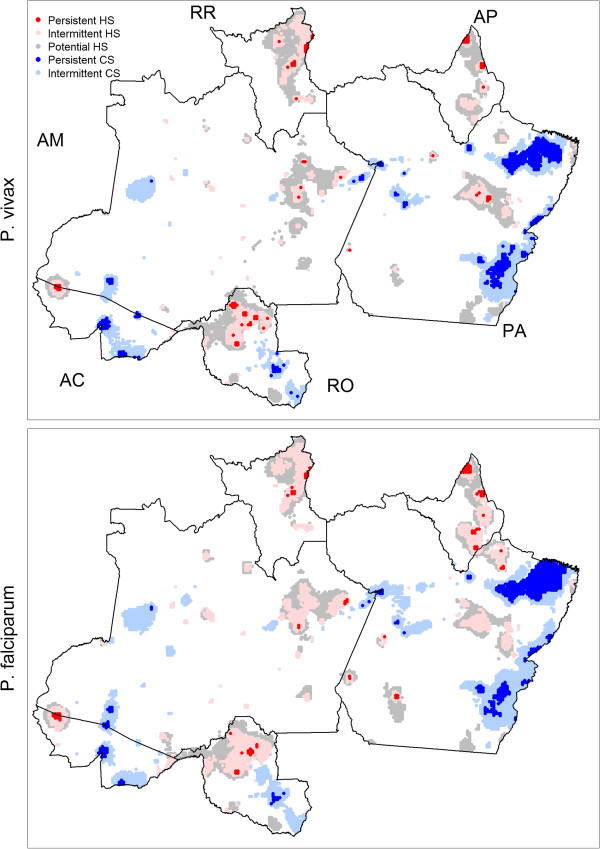
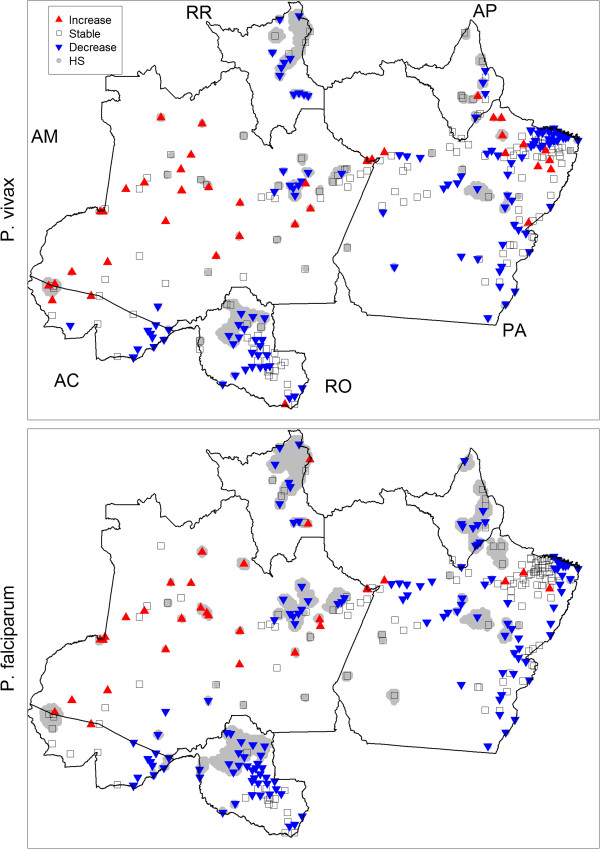
Results: Borrowing information across pathogens allowed for better spatial predictions of malaria caused by Plasmodium falciparum, as evidenced by a ten-fold cross-validation. Malaria incidence for both Plasmodium vivax and P. falciparum tended to be higher in areas with greater forest cover. Proximity to gold mining operations was another important risk factor, corroborated by a positive association between migration rates and malaria incidence. Finally, areas with a longer dry season and areas with higher average rural income tended to have higher malaria risk. Risk maps reveal striking spatial heterogeneity in malaria risk across the region, yet these mean disease risk surface maps can be misleading if uncertainty is ignored. By combining mean spatial predictions with their associated uncertainty, several sites were consistently classified as hotspots, suggesting their importance as priority areas for malaria prevention and control.
Conclusion: This article provides several contributions. From a methodological perspective, the benefits of jointly modelling multiple pathogens for spatial predictions were illustrated. In addition, maps of mean disease risk were contrasted with that of statistically significant disease clusters, highlighting the critical importance of uncertainty in determining disease hotspots. From an epidemiological perspective, forest cover and proximity to gold mining operations were important large-scale drivers of disease risk in the region. Finally, the hotspot in Western Acre was identified as the area that should receive highest priority from the Brazilian national malaria prevention and control programme.
Figures
Comment in
-
A social-ecological database to advance research on infrastructure development impacts in the Brazilian Amazon.Sci Data. 2016 Aug 30;3:160071. doi: 10.1038/sdata.2016.71. Sci Data. 2016. PMID: 27575915 Free PMC article.
References
-
- Partners RBM. The global malaria action plan for a malaria-free world. Geneva: World Health Organization; 2008.
-
- Achcar JA, Martinez EZ, de Souza ADP, Tachibana VM, Flores EF. Use of Poisson spatiotemporal regression models for the Brazilian Amazon forest: malaria count data. Rev Soc Bras Med Trop. 2011;44:749–754. - PubMed
Publication types
MeSH terms
LinkOut - more resources
Full Text Sources
Other Literature Sources
