Review
. 2014 Dec;55(12):2003-11.
doi: 10.2967/jnumed.114.141416. Epub 2014 Nov 20.

Multimodality imaging of Alzheimer disease and other neurodegenerative dementias

Affiliations
Review

Multimodality imaging of Alzheimer disease and other neurodegenerative dementias

Ilya M Nasrallah et al. J Nucl Med. 2014 Dec.

Abstract

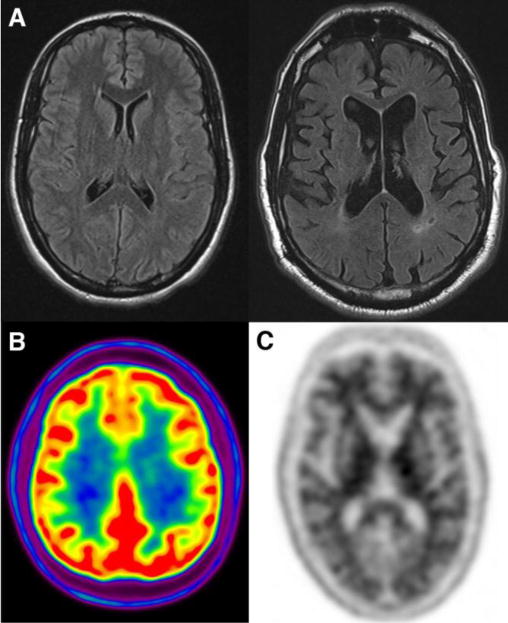
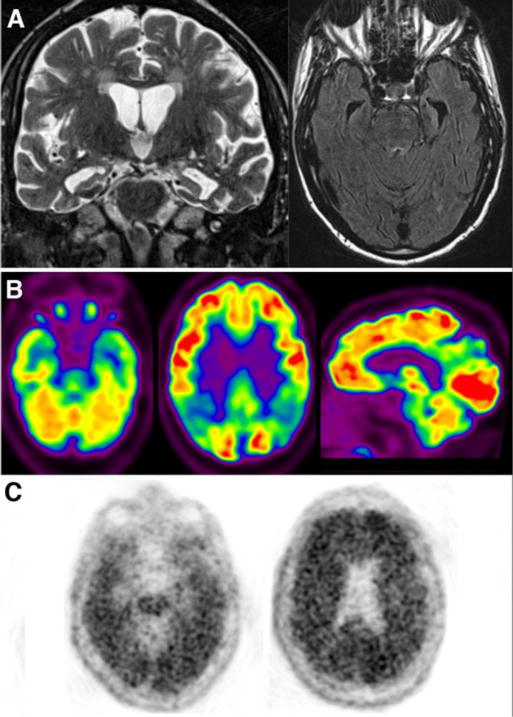
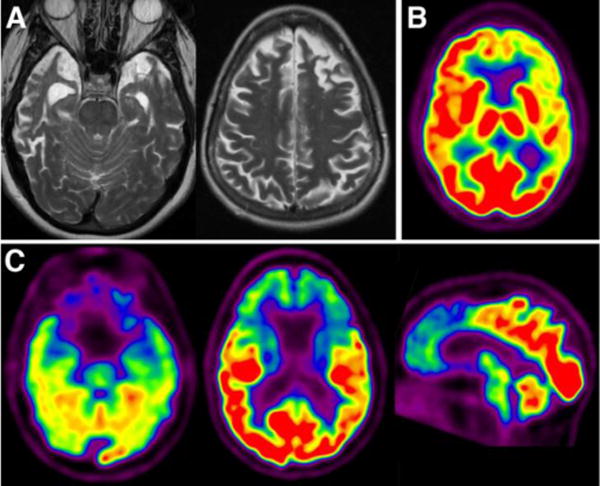
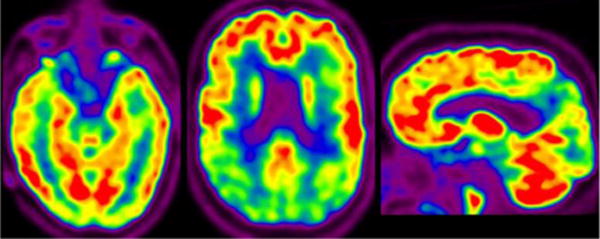
Neurodegenerative diseases, such as Alzheimer disease, result in cognitive decline and dementia and are a leading cause of mortality in the growing elderly population. These progressive diseases typically have an insidious onset, with overlapping clinical features early in the disease course that make diagnosis challenging. The neurodegenerative diseases are associated with characteristic, although not completely understood, changes in the brain: abnormal protein deposition, synaptic dysfunction, neuronal injury, and neuronal death. Neuroimaging biomarkers-principally regional atrophy on structural MR imaging, patterns of hypometabolism on (18)F-FDG PET, and detection of cerebral amyloid plaque on amyloid PET--are able to evaluate the patterns of these abnormalities in the brain to improve early diagnosis and help predict the disease course. These techniques have unique strengths and synergies in multimodality evaluation of the patient with cognitive decline or dementia. This review discusses the key imaging biomarkers from MR imaging, (18)F-FDG PET, and amyloid PET; the imaging features of the most common neurodegenerative dementias; the role of various neuroimaging studies in differential diagnosis and prognosis; and some promising imaging techniques under development.

Keywords: Alzheimer disease; FDG PET; MRI; amyloid PET; neurodegeneration.


Figures

Figure 1
Figure 1
Imaging of cognitively normal individuals. (A) Axial FLAIR shows normal appearance of the brain on MRI in a young adult in third decade and typical appearance of a brain MRI in the eighth decade, showing mild atrophy and mild white matter hyperintensities. (B) Normal 18F-FDG PET shows high uptake in gray matter structures. (C) Normal amyloid PET scan with the radiotracer 18F-florbetapir shows typical white matter uptake but no evidence of elevated cortical binding.
Figure 2
Figure 2
Neuroimaging in AD. (A) Coronal T2 and axial FLAIR MRI images show marked medial temporal lobe atrophy involving hippocampus and subjacent entorhinal cortex, out of proportion to global volume loss. (B) Axial and sagittal images from an 18F-FDG PET shows typical lateral temporoparietal, posterior cingulate, and medial temporal lobe hypometabolism. Milder frontal hypometabolism is present, also common. (C) Axial images from a positive amyloid PET scan with 18F-florbetapir showing diffuse cortical activity with loss of the distinction between gray and white matter.
Figure 3
Figure 3
Neuroimaging in FTLD. (A) Axial T2 images from two patients show two characteristic patterns of FTLD: anterior temporal and frontal atrophy. Both show asymmetry and knife blade appearance of the gyri. 18F-FDG PET shows two typical patterns: left frontotemporoparietal hypometabolism (B, axial) versus frontal-predominant (C, axial and sagittal).
Figure 4
Figure 4
MRI appearance of PSP and CBD subtypes of FTLD. Normal sagittal T1 and axial T2 images centered on the brainstem, shown for comparison on the left in parts A and B. In PSP (A), there is severe midbrain atrophy with ‘hummingbird’ appearance of the brainstem; note the shortened anteroposterior dimension of the midbrain and concave superior margin. (B) Superior cerebellar peduncle atrophy in PSP. (C) Axial T1 image shows asymmetric left frontoparietal atrophy in CBD.
Figure 5
Figure 5
18F-FDG PET in DLB. Axial images through the levels of the temporal lobes and lateral ventricles and parasagittal image show occipital and posterior temporoparietal hypometabolism. Note sparing of the posterior cingulate cortex and medial temporal lobes.
Figure 6
Figure 6
MRI appearance of selected secondary causes of dementia. (A) Marked small vessel ischemic changes manifested by confluent periventricular hyperintensity and subcortical lesions on axial FLAIR. (B) Axial T2 shows enlarged ventricles in a patient with normal pressure hydrocephalus, out of proportion to the degree of diffuse atrophy. (C) Axial FLAIR and diffusion weighted images in a patient with CJD show diffuse cortical and asymmetric deep gray matter signal abnormality most evident on diffusion imaging.

References

    1. Fox C, Lafortune L, Boustani M, Dening T, Rait G, Brayne C. Screening for dementia–is it a no brainer? International journal of clinical practice. 2013;67:1076–1080. - PubMed
    1. World Alzheimer Report 2011. http://wwwalzcouk/research/world-report-2011.
    1. Josephs KA. Frontotemporal dementia and related disorders: deciphering the enigma. Annals of neurology. 2008;64:4–14. - PubMed
    1. Herholz K. Perfusion SPECT and FDG-PET. International psychogeriatrics/IPA. 2011;23(Suppl 2):S25–31. - PubMed
    1. Mosconi L, Tsui WH, Herholz K, et al. Multicenter standardized 18F-FDG PET diagnosis of mild cognitive impairment, Alzheimer’s disease, and other dementias. Journal of nuclear medicine: official publication, Society of Nuclear Medicine. 2008;49:390–398. - PMC - PubMed

Publication types

LinkOut - more resources