. 2014 Dec 9;111(49):17636-41.
doi: 10.1073/pnas.1420162111. Epub 2014 Nov 20.

Nitric oxide regulates synaptic transmission between spiny projection neurons

Affiliations

Nitric oxide regulates synaptic transmission between spiny projection neurons

Yotam Sagi et al. Proc Natl Acad Sci U S A. .

Erratum in

  • Correction.
    [No authors listed] [No authors listed] Proc Natl Acad Sci U S A. 2015 Apr 7;112(14):E1811. doi: 10.1073/pnas.1504794112. Epub 2015 Mar 18. Proc Natl Acad Sci U S A. 2015. PMID: 25787251 Free PMC article. No abstract available.

Abstract

Recurrent axon collaterals are a major means of communication between spiny projection neurons (SPNs) in the striatum and profoundly affect the function of the basal ganglia. However, little is known about the molecular and cellular mechanisms that underlie this communication. We show that intrastriatal nitric oxide (NO) signaling elevates the expression of the vesicular GABA transporter (VGAT) within recurrent collaterals of SPNs. Down-regulation of striatal NO signaling resulted in an attenuation of GABAergic signaling in SPN local collaterals, down-regulation of VGAT expression in local processes of SPNs, and impaired motor behavior. PKG1 and cAMP response element-binding protein are involved in the signal transduction that transcriptionally regulates VGAT by NO. These data suggest that transcriptional control of the vesicular GABA transporter by NO regulates GABA transmission and action selection.

Keywords: BacTRAP; axon collaterals; guanylyl cyclase; spiny projecting neurons; vesicular GABA transporter.


Conflict of interest statement

The authors declare no conflict of interest.

Figures

Fig. 1.
Fig. 1.
Biochemical and behavioral impairments in striatal-sGCβ1 KD mice. (A) Representative Western blot images depicting endogenous sGCβ1, transduced GFP, and β-actin levels in cortical culture neurons untreated (n = 3 wells) or transduced with either AAV.siGucy (n = 3 wells) or the control virus, AAV.siLuc (n = 3 wells). (B) Bar graph summary of the data presented in A. Bars represent mean sGCβ1 levels normalized to β-actin ± SD. (C) Effect of the nitric oxide donor, diethylamine NONOate (DEA, 10 nM) and a phosphodiesterase inhibitor, pentoxifylline (PXF, 150 µM) on cGMP and cAMP levels in neuron culture (n = 3 for each condition, ***P < 0.001). Bars represent means ± SD. (D) Representative grayscale immunofluorescent images of GFP localization after intrastriatal injection of AAV.siGucy, showing GFP expression in the dorsal striatum (arrow, Left). Magnified images (Middle and Right) show the somatic GFP labeling throughout the striatum. (Scale bars: Left, 2 mm, objective 10×; Middle and Right, 200 μm, objective 40×.) (E) Representative Western blot image of protein level from lysates of the entire striata after bilateral intrastriatal injections of either AAV.siGucy or control AAV (AAV.siLuc, n = 4 mice per group, for coordinates see SI Materials and Methods). (F) Quantification of the data presented in E, indicating a persistent reduction in sGCβ1 level by AAV.siGucy (*P < 0.05). Bars represent mean densities of sGCβ1 normalized to β-actin ± SD. (G) Quantification of cGMP and cAMP levels in control or sGCβ1 KD (n = 6 mice per group, ***P = 0.0004). Bars represent levels normalized to tissue wet weight ± SD. (H) Spontaneous motor behavior was recorded for 60 min after vehicle injection. Traveled distance and rest times are illustrated by the open and closed boxes, respectively (n = 6 mice per group, *P < 0.05). (I) Five-minute motor activity in sGCβ1 KD mice was compared with that of mice injected with the nitric synthase inhibitor l-NG-nitroarginine methyl ester (l-NAME) (n = 6 mice per group, *P < 0.05 vs. untreated control).
Fig. 2.
Fig. 2.
VGAT is down-regulated in local processes of striatal SPNs in sGCβ1 KD mice. (A) Bar graph summary of mRNA levels of sGCβ1 (gucy1b3), VGAT (Slc32a1), synaptophysin (Syp), and α-synuclein (Snca) from control Drd1-TRAP mice and sGCβ1 KD Drd1-TRAP mice (n = 3 per group, **P < 0.01 vs. control). Bars represent mean mRNA levels normalized to GAPDH, as percentage of control ± SD. (B) Colocalization of VGAT and DARPP-32 in the striatum and substantia nigra pars reticulata (SNr). Representative images from control (n = 5 mice), showing that VGAT is colocalized with DARPP-32 in the striatum. Note in the magnified images that VGAT is expressed in the soma (adjacent to the nucleus in blue) but more prominently in processes (arrows) of SPNs. In sGCβ1 KD (n = 5 mice), VGAT labeling is mainly reduced in processes but it is still visible in somas (arrows). In control mice, SPNs’ principal projections to the SNr express VGAT, and the labeling of VGAT in the principal projection remains unchanged in sGCβ1 KD mice. (Scale bar: 20 µm.) (C) Mean pixel values were determined concomitantly for DARPP-32 and VGAT in control (n = 5 mice) and sGCβ1 KD mice (n = 5 mice). Analysis of the ratios indicates that VGAT level is reduced in the striatum of sGCβ1 KD mice (**P = 0.0095). Bars represent mean ratios of mean pixel values ± SEM.
Fig. 3.
Fig. 3.
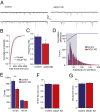
Decreased frequency of small-amplitude GABAergic currents in striatal SPNs of sCGβ1 KD mice. (A) Representative spontaneous mIPSC traces from SPNs of control (n = 18 mice) and sGCβ1 KD (n = 19 mice). (B) Cumulative probability plot summary of mIPSC interevent interval (IEI) from control or sGCβ1 KD, showing an increase in IEI in SPNs of sGCβ1 KD mice. (C) Bar graph summary of mIPSC frequency in SPNs from control (n = 18 mice) or sGCβ1 KD (n = 19 mice), showing a decrease in SPN mIPSCs frequency in sGCβ1 KD animals (*P = 0.022). Bars represent mean frequency ± SEM. (D, Lower) Amplitude histogram of mIPSCs in SPNs of control (n = 18 mice) and sGCβ1 KD (n = 19 mice) showing a decrease in the number of mIPSCs in the smaller amplitude event bins in sGCβ1 KD mice. (Upper) Cumulative plot of the difference between control (n = 18 mice) and sGCβ1 KD (n = 19 mice) in each 10-pA-amplitude bin, showing that the greatest difference between the groups occurs in the smaller amplitude bins. (E) Bar graph summary of small (<65 pA) and big (>65 pA) amplitude mIPSCs in equal-length records (7 min) from control (n = 18 mice) or sGCβ1 KD (n = 19 mice), showing a decrease in the number of small-amplitude mIPSCs in SPNs of sGCβ1 KD (**P = 0.006). Bars represent mean counts ± SEM. (F) Bar graph summary of mean 10–90% rise times (P = 0.524, control, 0.86 ± 0.02, n = 19; sGCβ1 KD, 0.84 ± 0.02, n = 18). (G) Mean decay times (P = 0.664, control, 17.1 ± 1.0, n = 19; sGCβ1 KD, 17.6 ± 0.5, n = 18).
Fig. 4.
Fig. 4.
Disruption of NO signaling reduces iSPN collateral input onto dSPNs. (A) Striatal cells (iSPNs) transfected by viral delivery of channel rhodopsin (ChR2, coexpressing YFP) are shown in green overlaid on the corresponding differential interference contrast image of a 200-µm sagittal brain slice. (Scale bar: 250 µm.) (B) A magnified view of the region around the recording pipette seen in A. (Scale bar: 100 µm.) Note the proximity of a transfected iSPN to the recorded, nontransfected dSPN. (C) Representative traces show the response of the recorded dSPN to GABAergic iSPN collateral input generated by a 200-μs duration pulse of 470 nm wavelength light delivered via an LED light source. The vertical tick in the bar above the traces indicates the onset of the light pulse (not to scale). The traces represent the average of ∼8–10 responses before (control) and after (l-NAME) a 12-min incubation in the NOS inhibitor, l-NAME (100 µM). The glutamate receptor antagonists APV [(2R)-amino-5-phosphonovaleric acid; (2R)-amino-5-phosphonopentanoate] (50 µM) and DNQX (6,7-dinitroquinoxaline-2,3-dione, 10 µM) were present throughout the experiment. (Inset) A simplified schematic of striatal circuitry indicating the collateral innervations being examined. (D) A summary of the data obtained from a set of 13 cells in experiments as outlined in C. The absolute amplitudes of the GABAergic responses before and after l-NAME treatment are represented as box plots demonstrating median value and interquartile range. Amplitudes were statistically analyzed using the Mann–Whitney U test (*P < 0.05).
Fig. 5.
Fig. 5.
Transcriptional regulation of VGAT by NO signaling. (A) Representative immunoblot image of phosphoproteins from control (n = 4 mice) and sGCβ1 KD (n = 4 mice). (B) Quantification of the data presented in A, indicating a reduction in phospho-CREB levels in the striata of sGCβ1 KD mice (**P = 0.006). Bars represent means of phosphorylated fraction ± SD. (C and D) Effect of cGMP on subcellular levels of PKG1 in striatal slices. (C) Representative Western blot images of Ser-133 phospho-CREB and total CREB levels, after incubation of striatal slices with 8 Br-cGMP (cGMP analog, 5 µM), RP-cGMPS (PKG1α selective inhibitor, 1 µM, n = 6 slices per group). (D) Quantification of the data presented in C, showing induction in CREB-phosphorylation by 8 Br-cGMP alone but not with RP-cGMPS (*P < 0.05 vs. 8 Br-cGMP/RP-cGMPS). Bars represent means of fold change in phosphorylated fraction relative to time 0 ± SD. (E) Representative Western blot image depicting protein subcellular levels after 30 min incubation of striatal slices with 8 Br-cGMP. (F) Bar graph summary of the data presented in E, indicating that the induction of CREB phosphorylation by 8 Br-cGMP is not associated with nuclear translocation of PKG1 (5 µM, n = 3 mice, six slices from each, per group). (G) Impaired interaction between CREB and vgat gene in sGCβ1 KD mice. Bar graph summary of the striatal levels of vgat (slc32a1), bound by either S133-phospho-CREB or RNA polymerase II. The level of bound genes from control (n = 10) or sGCβ1 KD (n = 10) was analyzed using qPCR. Bars represent mean levels of the immunoprecipitated gene in sGCβ1 KD mice normalized to input, as percentage of control ± SD (*P < 0.05).
Fig. 6.
Fig. 6.
Coregulation of VGAT and cGMP levels by dopamine. (A) Dopaminergic lesion paradigm. Mice received a unilateral injection of either 6-hydroxydopamine (OHDA) or vehicle to the medial forebrain bundle and daily intraperitoneal injections of benseazide (15 mg/kg) with l-dopa (6 mg/kg, LD) or saline (sal). (B) VGAT and DARPP-32 immunolabeling in the striatum after dopaminergic lesion. Representative images from ipsilateral (ipsi.) and contralateral (cont.) striatum of a mouse treated with 6-hydroxydopamine and saline. Note in the magnified images that VGAT labeling (shown in yellow in the image from the contralateral) is reduced in the soma of SPNs of the ipsilateral striatum (appears green). (Scale bar: 20 µm.) (C) Bar graph summary of ratios of VGAT and DARPP-32 mean pixel values (n = 5–6 mice per group, seven slices per mouse). Bars represent mean ratios in the ipsilateral striatum as percentage of that in the contralateral ± SD. (D) cGMP levels. Bars represent cGMP level in the ipsilateral striatum normalized to tissue wet weight, as percentage of the contralateral ± SD (n = 4–5 mice per group). (E) For each treatment group, the mean cGMP level is plotted against the mean of VGAT labeling ratio.

Similar articles

Cited by

References

    1. Li DP, Chen SR, Finnegan TF, Pan HL. Signalling pathway of nitric oxide in synaptic GABA release in the rat paraventricular nucleus. J Physiol. 2004;554(Pt 1):100–110. - PMC - PubMed
    1. Nugent FS, Penick EC, Kauer JA. Opioids block long-term potentiation of inhibitory synapses. Nature. 2007;446(7139):1086–1090. - PubMed
    1. Garthwaite J. Concepts of neural nitric oxide-mediated transmission. Eur J Neurosci. 2008;27(11):2783–2802. - PMC - PubMed
    1. Ding JD, Burette A, Nedvetsky PI, Schmidt HH, Weinberg RJ. Distribution of soluble guanylyl cyclase in the rat brain. J Comp Neurol. 2004;472(4):437–448. - PubMed
    1. Matsuoka I, et al. Localization of adenylyl and guanylyl cyclase in rat brain by in situ hybridization: Comparison with calmodulin mRNA distribution. J Neurosci. 1992;12(9):3350–3360. - PMC - PubMed

Publication types

MeSH terms

LinkOut - more resources