. 2015 Jan;21(1):75-92.
doi: 10.1261/rna.043893.113. Epub 2014 Nov 20.

SR proteins control a complex network of RNA-processing events

Affiliations

SR proteins control a complex network of RNA-processing events

Todd Bradley et al. RNA. 2015 Jan.

Abstract

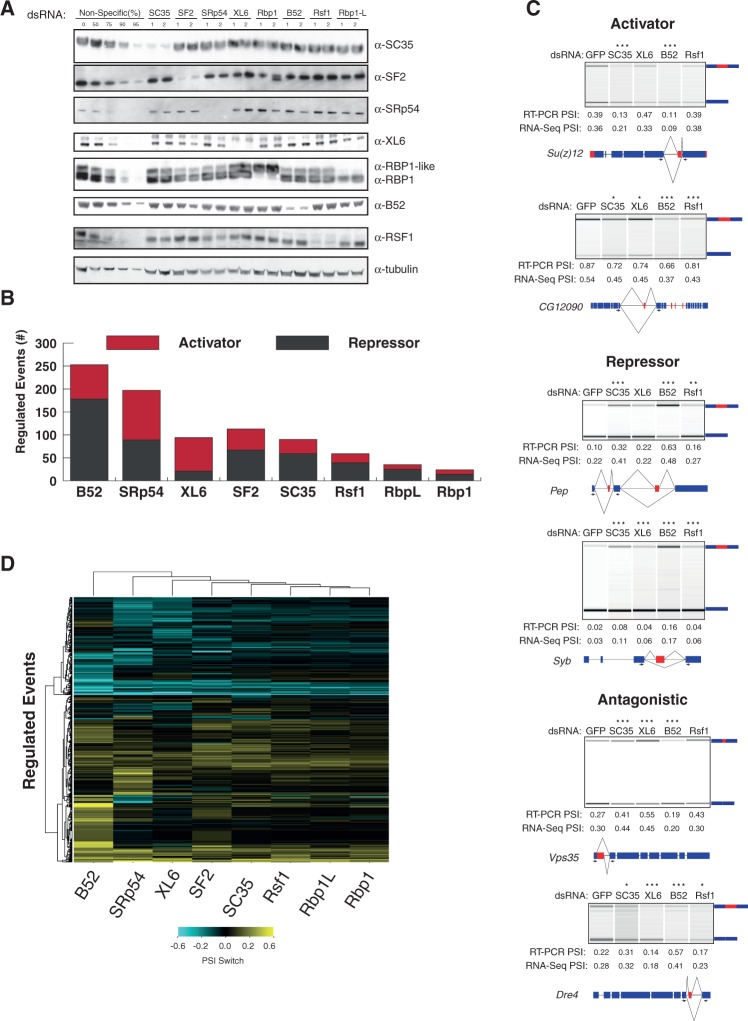
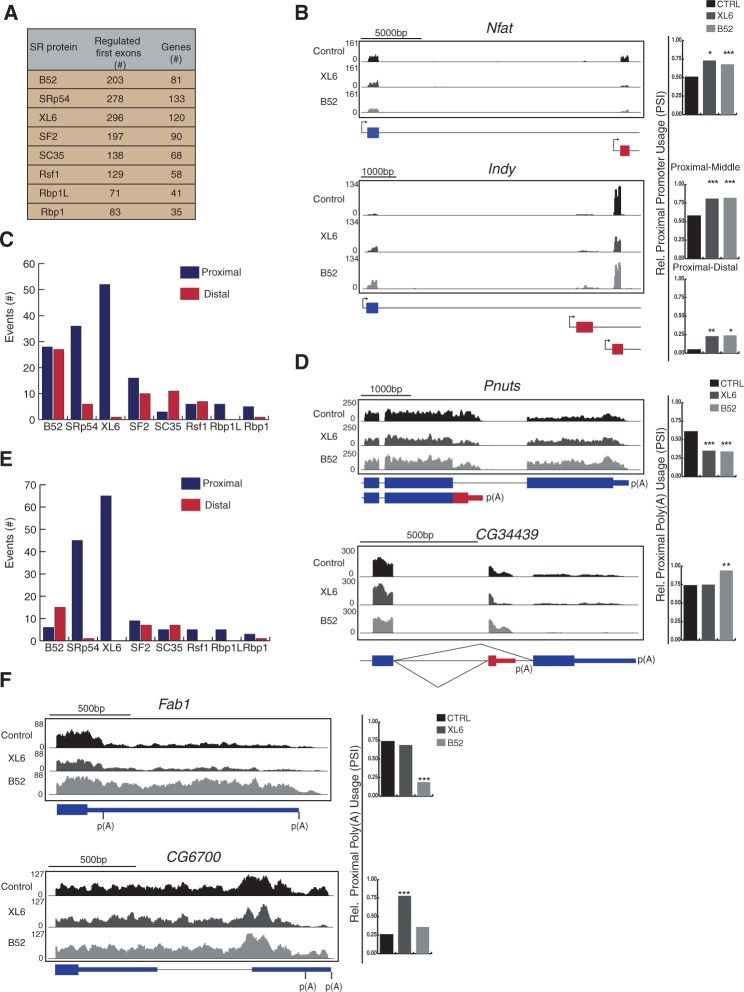
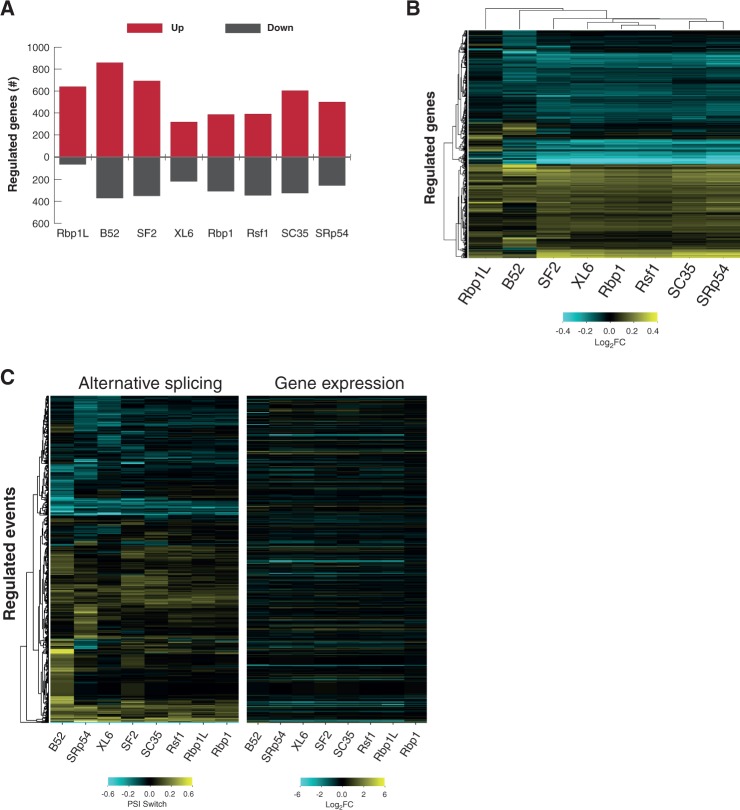
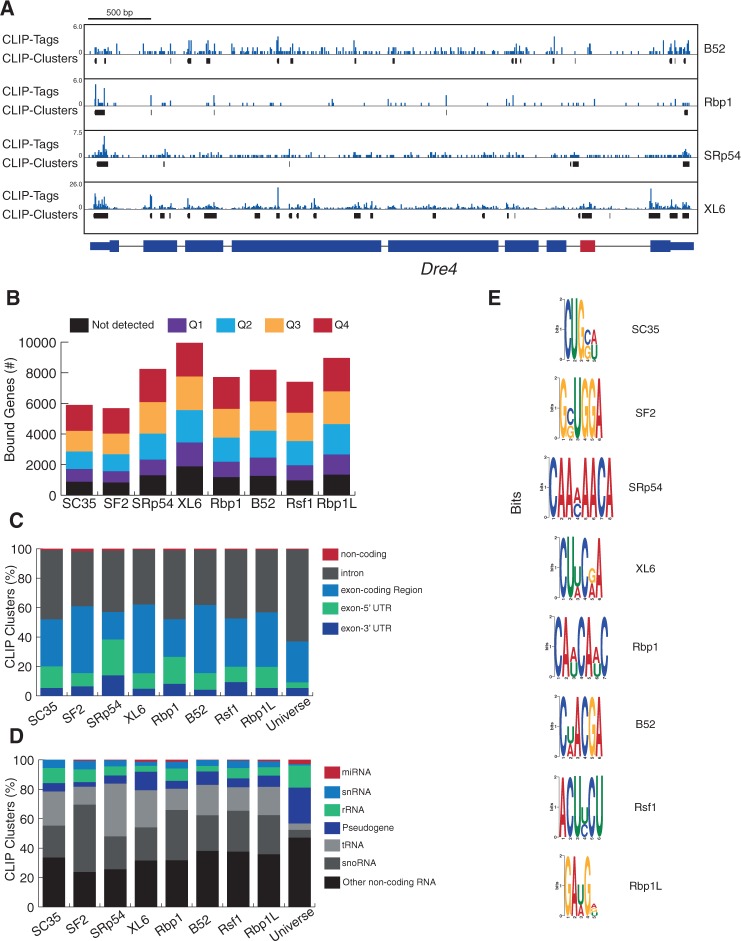
SR proteins are a well-conserved class of RNA-binding proteins that are essential for regulation of splice-site selection, and have also been implicated as key regulators during other stages of RNA metabolism. For many SR proteins, the complexity of the RNA targets and specificity of RNA-binding location are poorly understood. It is also unclear if general rules governing SR protein alternative pre-mRNA splicing (AS) regulation uncovered for individual SR proteins on few model genes, apply to the activity of all SR proteins on endogenous targets. Using RNA-seq, we characterize the global AS regulation of the eight Drosophila SR protein family members. We find that a majority of AS events are regulated by multiple SR proteins, and that all SR proteins can promote exon inclusion, but also exon skipping. Most coregulated targets exhibit cooperative regulation, but some AS events are antagonistically regulated. Additionally, we found that SR protein levels can affect alternative promoter choices and polyadenylation site selection, as well as overall transcript levels. Cross-linking and immunoprecipitation coupled with high-throughput sequencing (iCLIP-seq), reveals that SR proteins bind a distinct and functionally diverse class of RNAs, which includes several classes of noncoding RNAs, uncovering possible novel functions of the SR protein family. Finally, we find that SR proteins exhibit positional RNA binding around regulated AS events. Therefore, regulation of AS by the SR proteins is the result of combinatorial regulation by multiple SR protein family members on most endogenous targets, and SR proteins have a broader role in integrating multiple layers of gene expression regulation.

Keywords: RNA processing; SR proteins; alternative pre-mRNA splicing; regulation of gene expression.


Figures

FIGURE 1.
FIGURE 1.
Genome-wide analysis of SR-dependent AS events. Drosophila melanogaster S2 cells were treated with SR-RNAi. (A) Western blot analysis of S2 cells treated with two nonoverlapping SR-specific dsRNAs versus S2 cells treated with nonspecific dsRNA (GFP); loading control, α-tubulin. (B) RNA-seq analysis showing the total number of simple AS events regulated by each SR protein; each bar shows the proportion of events that are less included (SR-activated, red) or more included (SR-repressed, dark gray). (C) RT-PCR validation of putative SR-regulated AS events identified by RNA-seq analysis (significantly changed events [*] P ≤ 0.05, [**] P ≤ 0.01, [***] P ≤ 0.001 Fisher's exact test); events separated into activator, repressor, or antagonistic. PSI values calculated from the RT-PCR and RNA-seq experiments are shown for comparison below each lane. Gene model is displayed below each gel with arrows indicating primer locations for PCR of the alternative region (red). (D) Heatmap reveals hierarchical clustering of PSI-switch scores for SR-regulated AS events (y-axis) for each SR protein (x-axis).
FIGURE 2.
FIGURE 2.
Combinatorial regulation of AS by SR proteins. Drosophila melanogaster S2 cells were treated with RNAi against one or more of the eight SR proteins and RNA-seq was performed to detect the changes in AS. (A) Proportion of AS events regulated by one (dark gray) or more than one (red) SR protein. (B) Heatmap of coregulated AS events identified by RNA-seq subdivided by those with increased inclusion or exclusion. (C) Western blot analysis of lysates from S2 cells treated with dsRNA against one or two SR proteins and dsRNA against GFP as a control; α-tubulin used as a loading control. (D–F) S2 cells were treated with RNAi against one SR protein (SC35, B52 or XL6) or two (SC35 and B52 or XL6 and B52) and RNA isolated. RNA-seq was used to create a heatmap showing hierarchical clustering of PSI-switch scores for the resulting changes in AS events (D), graph displaying the total number of significantly changed events in each SR protein-depleted RNA-seq experiment (E), and number of coregulated events that displayed a greater (enhanced; red), equal or less (cooperative; blue), or opposite (compensatory; green) PSI change in the simultaneous knockdown compared with individual SR knockdown (F). (G) RT-PCR of coregulated AS events. PSI values and mean ΔPSI values from control displayed below each lane. Gene model is displayed below each gel with arrows indicating primer locations for PCR of the alternative region (red).
FIGURE 3.
FIGURE 3.
SR proteins regulate promoter choice and 3′ end processing. Transcripts with alternative promoter and polyadenylation sites were analyzed for changes when individual SR proteins are depleted (Fig. 1). (A) Total number of transcripts with differential promoter selection when individual SR proteins are knocked down. (B) RNA-seq tracks for representative transcripts with altered promoters. Shaded gray regions above the gene model correspond to the density of mapped RNA-seq reads from each sample. Charts on the right indicate the relative frequency of proximal promoter usage (PSI; significantly changed events [*] P ≤ 0.05, [**] P ≤ 0.01, [***] P ≤ 0.001 Fisher's exact test). (C,E) Number of altered events within transcripts with CR-APA sites (C) and UTR-APA sites (E), subdivided into shifts to proximal or distal polyadenylation sites. (D,F) RNA-seq tracks for representative transcripts with CR-APA (D) and UTR-APA (F) (blue boxes, constitutive regions; red boxes, alternative regions and poly(A) sites; thin lines, 3′ UTR). Shaded gray regions above the gene model correspond to the density of mapped RNA-seq reads from each sample. Charts on the right indicate the relative frequency of proximal APA usage (PSI; significantly changed events [***] P ≤ 0.001 Fisher's exact test).
FIGURE 4.
FIGURE 4.
SR proteins regulate RNA transcript levels. Transcript abundance was calculated and normalized for control and SR-depleted RNA-seq samples (Fig. 1). (A) Number of genes with differential expression (red, increased; dark gray, decreased). (B) Heatmap showing hierarchical clustering of calculated fold-change (log2) for genes with significantly altered transcript levels. (C) Heatmaps comparing identified AS-regulated events (Fig. 1D) (left) and their corresponding gene expression changes (fold-change [log2]) (right).
FIGURE 5.
FIGURE 5.
SR protein regulation of AS depends on RRM-domain and requires RS-domain. (A) Schematic showing relevant domains of three copper-inducible proteins—all tagged with 2x Flag and 2x HA: RRM, RNA-binding; Zn, zinc knuckle; RS, C-terminal arginine/serine. (B) Western blot of endogenous and recombinant XL6 in Drosophila S2 cells assayed in the presence or absence of dsRNA against endogenous XL6 and induction or recombinant XL6 isoforms; loading control, histone H3. (C) Semiquantitative RT-PCR of XL6-regulated targets (Dre4, Vps35, DppIII) and B52-regulated controls (CG12065 and Syb) in transfected S2 cells expressing wild-type or mutant XL6 (Expressed) and cultured in the presence or absence of dsRNA against endogenous XL6 (XL6 RNAi). Transcript models showing exon and intron structure (exon, thick box; intron, thin line; alternative region, red). PSI values are displayed below each lane. (D) Semiquantitative RT-PCR of AS targets in untransfected S2 cells cultured in the presence of dsRNA to either nonspecific sequence (control) or B52. PSI values are displayed below each lane.
FIGURE 6.
FIGURE 6.
Global landscape of RNA transcripts bound by SR proteins. (A) Dre4 gene (alternatively spliced exon is red) displaying density of CLIP tags (blue) and CLIP clusters (black) for four representative SR proteins across the transcript. (B) Number of genes that contain at least one SR protein CLIP cluster, grouped by gene expression level—ranging from “not detected” (below RNA-seq detection levels) to Q4, the highest level of expression. (C,D) Proportion of CLIP clusters that mapped to five different regions on SR-protein-bound transcripts (C) and common types of noncoding RNA for each SR protein (D); Universe, reference showing the proportion of genomic space for each feature. (E) Graphical representation of consensus-binding motifs derived for each SR protein. Height indicates the information content at each position of the binding motif in bits (log-odds in base 2).
FIGURE 7.
FIGURE 7.
SR proteins bind in a position-specific manner to regulate splicing. Mapping of SR protein CLIP-Tags near splice sites and alternatively spliced regions. (A) Relative density of CLIP-Tags 150 nt upstream of and downstream from the splicing acceptor (3′ splice site) and splicing donor (5′ splice site) for each SR protein iCLIP experiment on all bound transcripts. Wide gray bar, exon sequence; black line, intron sequence; colored line, individual SR protein binding. (B) RNA-splicing maps of four representative SR proteins on regulated cassette exon AS events. Bootstrapping analysis was used to test for robustness. Shaded regions correspond to the 95% confidence interval and solid lines are the estimated value of relative density of CLIP-Tags on cassette exons that have increased exclusion (red), increased inclusion (blue), or no change (dashed line) upon SR protein knockdown. The alternative exon is red and flanking constitutive regions are blue. n, total number of regulated AS events or unaffected AS events (middle).

References

    1. Änkö ML, Müller-McNicoll M, Brandl H, Curk T, Gorup C, Henry I, Ule J, Neugebauer KM 2012. The RNA-binding landscapes of two SR proteins reveal unique functions and binding to diverse RNA classes. Genome Biol 13: R17. - PMC - PubMed
    1. Bailey TL 2011. DREME: motif discovery in transcription factor ChIP-seq data. Bioinformatics 27: 1653–1659. - PMC - PubMed
    1. Berg MG, Singh LN, Younis I, Liu Q, Pinto AM, Kaida D, Zhang Z, Cho S, Sherrill-Mix S, Wan L, et al.2012. U1 snRNP determines mRNA length and regulates isoform expression. Cell 150: 53–64. - PMC - PubMed
    1. Black DL 2003. Mechanisms of alternative pre-messenger RNA splicing. Annu Rev Biochem 72: 291–336. - PubMed
    1. Blanchette M, Green RE, Brenner SE, Rio DC 2005. Global analysis of positive and negative pre-mRNA splicing regulators in Drosophila. Genes Dev 19: 1306–1314. - PMC - PubMed

Publication types

Associated data