. 2015 Feb 1;118(3):319-30.
doi: 10.1152/japplphysiol.00674.2014. Epub 2014 Nov 20.

Green tea extract attenuates muscle loss and improves muscle function during disuse, but fails to improve muscle recovery following unloading in aged rats

Affiliations

Green tea extract attenuates muscle loss and improves muscle function during disuse, but fails to improve muscle recovery following unloading in aged rats

Stephen E Alway et al. J Appl Physiol (1985). .

Abstract

In this study we tested the hypothesis that green tea extract (GTE) would improve muscle recovery after reloading following disuse. Aged (32 mo) Fischer 344 Brown Norway rats were randomly assigned to receive either 14 days of hindlimb suspension (HLS) or 14 days of HLS followed by normal ambulatory function for 14 days (recovery). Additional animals served as cage controls. The rats were given GTE (50 mg/kg body wt) or water (vehicle) by gavage 7 days before and throughout the experimental periods. Compared with vehicle treatment, GTE significantly attenuated the loss of hindlimb plantaris muscle mass (-24.8% vs. -10.7%, P < 0.05) and tetanic force (-43.7% vs. -25.9%, P <0.05) during HLS. Although GTE failed to further improve recovery of muscle function or mass compared with vehicle treatment, animals given green tea via gavage maintained the lower losses of muscle mass that were found during HLS (-25.2% vs. -16.0%, P < 0.05) and force (-45.7 vs. -34.4%, P < 0.05) after the reloading periods. In addition, compared with vehicle treatment, GTE attenuated muscle fiber cross-sectional area loss in both plantaris (-39.9% vs. -23.9%, P < 0.05) and soleus (-37.2% vs. -17.6%) muscles after HLS. This green tea-induced difference was not transient but was maintained over the reloading period for plantaris (-45.6% vs. -21.5%, P <0.05) and soleus muscle fiber cross-sectional area (-38.7% vs. -10.9%, P <0.05). GTE increased satellite cell proliferation and differentiation in plantaris and soleus muscles during recovery from HLS compared with vehicle-treated muscles and decreased oxidative stress and abundance of the Bcl-2-associated X protein (Bax), yet this did not further improve muscle recovery in reloaded muscles. These data suggest that muscle recovery following disuse in aging is complex. Although satellite cell proliferation and differentiation are critical for muscle repair to occur, green tea-induced changes in satellite cell number is by itself insufficient to improve muscle recovery following a period of atrophy in old rats.

Keywords: EGCg; apoptosis; catechin; disuse; exercise; muscle atrophy; reloading; sarcopenia.


Figures

Fig. 1.
Fig. 1.
The amount of food consumed by each animal was determined and averaged over the intervention period. The evaluation period included the 7 days preceding intervention (before), over 14 days of hindlimb suspension (HLS), and after 14 days of HLS followed by 14 days of reloading (recovery). The animals received green tea extract (GTE) or vehicle (water) daily by gavage for a total of 21 days (HLS) or 32 days (recovery). Ten animals were in each group. There were no differences in food consumption between GTE or vehicle groups. *P < 0.05 cage control vs. treatment group.
Fig. 2.
Fig. 2.
Muscle wet weight was obtained in hindlimb muscles of cage control animals, after 14 days of HLS, and after 14 days of HLS followed by 14 days of reloading (recovery). The animals received GTE or vehicle (water) daily by gavage for a total of 21 days (HLS) or 32 days (recovery). Ten animals were in each group. *P < 0.05 cage control vs. treatment group; †P < 0.05 vehicle vs. GTE.
Fig. 3.
Fig. 3.
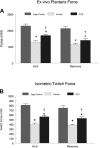
A: maximal tetanic force obtained at a frequency of 100 Hz. B: peak twitch force (PT) of the plantaris muscle was measured in cage control rats, after 14 days of HLS, and after 14 days of HLS followed by 14 days of reloading (recovery). The animals received either GTE or vehicle (water) daily for 7 days before and throughout the experimental period. *P < 0.05 cage control vs. treatment group; †P <0.05 vehicle vs. GTE.
Fig. 4.
Fig. 4.
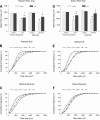
Mean fiber cross-sectional area was obtained in plantaris muscle (A) and soleus muscle (D) of cage control animals or rats after 14 days of HLS, and following 14 days of HLS followed by 14 days of reloading (recovery). The animals received GTE or vehicle (water) daily by gavage for a total of 21 days (HLS and control) or 32 days (control and recovery). Cumulative frequency distributions of plantaris muscle fibers (B and C) or soleus muscles (E and F) are shown for cage control, HLS, and recovery animals. *P < 0.05 cage control vs. treatment group; †P < 0.05 vehicle vs. GTE.
Fig. 5.
Fig. 5.
A time-released pellet containing 5-bromo-2′-deoxyuridine (BrdU) was placed in the animals after 14 days of HLS in rats treated with vehicle (n = 10) and GTE (n = 10) at the point of reloading the hindlimbs. Representative tissue cross-sections are shown for the plantaris (A, B, E, and F) and soleus (C, D, G, and H) muscles. AD: animals that received vehicle treatment. EH: animals that received GTE. The basal lamina of muscle fibers appears in red. A, C, E, and G show only the basal lamina. D and H show the sarcolemma (dystrophin labeled green) to confirm the location of the BrdU-positive nuclei. B, D, F, and H show superimposed BrdU (turquoise) nuclei on nuclei identified with 4,6-diamidino-2-phenylindole (DAPI) (blue). BrdU-positive nuclei are therefore a light green-turquoise color. When the sections were also labeled for dystrophin (D and H) such that the sarcolemma was stained (green), the sarcolemma was easily distinguished from BrdU-positive turquoise nuclei, which overlay DAPI-stained nuclei. White arrows indicate BrdU-positive cells. Numbers indicate the same fiber (e.g., 1 in A and B). More BrdU-positive nuclei can be seen in GTE- vs. vehicle-treated muscle cross-sections of the reloaded muscles from old animals.
Fig. 6.
Fig. 6.
The BrdU labeling index was calculated as a measure of satellite cell proliferation in tissue cross-sections of plantaris (A) and soleus (B) muscles. The BrdU labeling index was determined from the number of BrdU-positive nuclei per total myonuclei that were taken from five to eight tissue cross-sections and ∼400 fibers. *P < 0.05 cage control vs. treatment group; †P < 0.05 vehicle vs. GTE.
Fig. 7.
Fig. 7.
Immunocytochemical localization of satellite cells. Representative tissue cross-sections that show immunocytochemical localization of satellite cells that had proliferated and taken up the BrdU label (red superimposed on blue DAPI-stained nuclei). A and B: plantaris muscle fibers. D and E: soleus muscle fibers. A and D: DAPI-stained (blue) nuclei to show all of the myonuclei. B and E: superimposed staining for DAPI (blue nuclei), BrdU (red), and the sarcolemma (green) of the fiber. An example of a proliferated satellite cell (red) that had moved inside the muscle sarcolemma (which was stained green) is shown by yellow arrows (A and B). The white open arrows (D and E) show a BrdU-positive nucleus that remained outside of the sarcolemma. The percent of BrdU-positive nuclei that were differentiated as indicated by those that were internal to the fiber and not associated with the periphery of the fiber were calculated for the plantaris (C) and soleus (F) muscles and expressed an index of differentiated satellite cells progeny cells. *P < 0.05 cage control vs. treatment group; †P < 0.05 vehicle vs. GTE.
Fig. 8.
Fig. 8.
Indicators of oxidative stress. A: abundance of protein carbonyls was assessed by an ELISA as an indicator of oxidative damage to muscle proteins. B: 8-iso-prostaglandin F(2α) (8-iso-PGF2α) was measured by an ELISA as an indicator of lipid oxidation. Muscle lysates were prepared from plantaris and soleus muscles after HLS and recovery and compared with muscles from cage control animals. Both the level of protein carbonyls and 8-iso-PGF2α were elevated after HLS and recovery and GTE treatment attenuated the increase in these markers of oxidative stress. C: superoxide dismutase (SOD) activity was measured by ELISA to determine whether GTE improved the antioxidant enzyme activity in unloaded or reloaded muscles. GTE treatment did not enhance total SOD antioxidant defense in muscles of old rats during high levels of oxidative stress. *P < 0.05 cage control vs. treatment group; †P < 0.05 vehicle vs. GTE.
Fig. 9.
Fig. 9.
Apoptotic signaling. Abundance of apoptotic signaling proteins was determined by Western blot analysis in plantaris muscles (A, C) and soleus muscles (B, D) of rats that had received 14 days of reloading after HLS-induced muscle disuse. Animals received GTE or vehicle daily by gavage. Glyceraldehyde-3-phosphate dehydrogenase (GAPDH) was used as a loading control. The density and area from the respective apoptotic signaling protein bands were quantified and the signals were normalized to GAPDH. Data are means ± SE for plantaris (C) and soleus (D) muscles. *P < 0.05 cage control vs. treatment group; †P < 0.05 vehicle vs. GTE.

References

    1. Adams GR. Satellite cell proliferation and skeletal muscle hypertrophy. Appl Physiol Nutr Metab 31: 782–790, 2006. - PubMed
    1. Adams GR, Caiozzo VJ, Haddad F, Baldwin KM. Cellular and molecular responses to increased skeletal muscle loading after irradiation. Am J Physiol Cell Physiol 283: C1182–C1195, 2002. - PubMed
    1. Allen DL, Linderman JK, Roy RR, Bigbee AJ, Grindeland RE, Mukku V, Edgerton VR. Apoptosis: a mechanism contributing to remodeling of skeletal muscle in response to hindlimb unweighting. Am J Physiol Cell Physiol 273: C579–C587, 1997. - PubMed
    1. Alway SE. Attenuation of Ca(2+)-activated ATPase and shortening velocity in hypertrophied fast twitch skeletal muscle from aged Japanese quail. Exp Gerontol 37: 665–678, 2002. - PubMed
    1. Alway SE, Bennett BT, Wilson JC, Edens NK, Pereira SL. Epigallocatechin-3-gallate improves plantaris muscle recovery after disuse in aged rats. Exp Gerontol 50: 82–94, 2014. - PMC - PubMed

Publication types

MeSH terms