. 2014 Nov 21;346(6212):996-1000.
doi: 10.1126/science.1256427.

Antibody landscapes after influenza virus infection or vaccination

Affiliations

Antibody landscapes after influenza virus infection or vaccination

J M Fonville et al. Science. .

Abstract

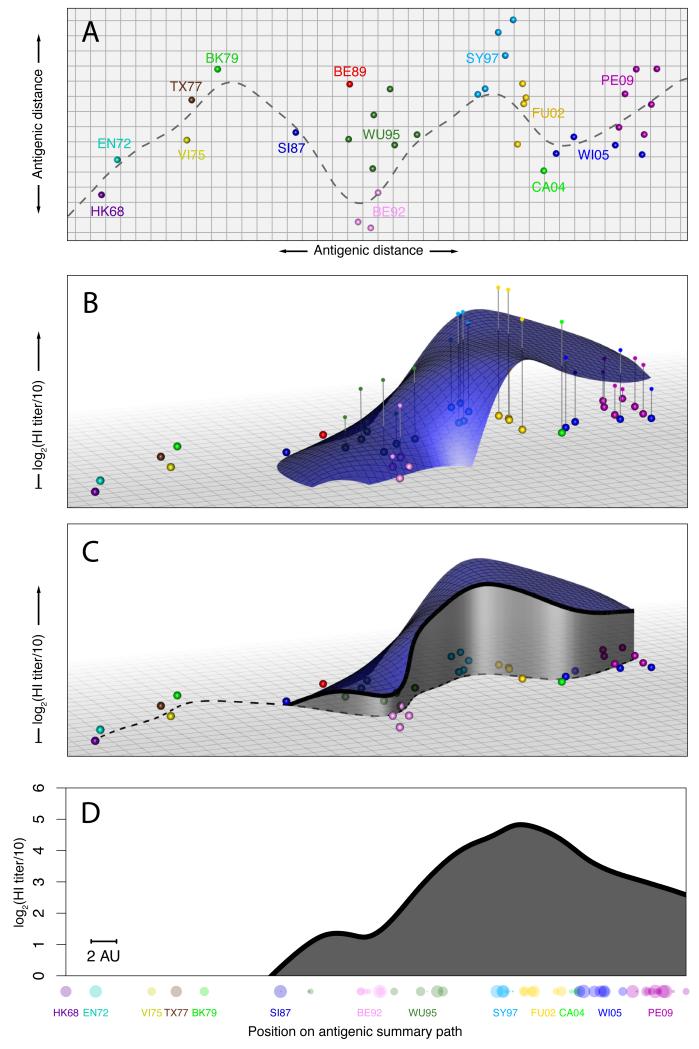
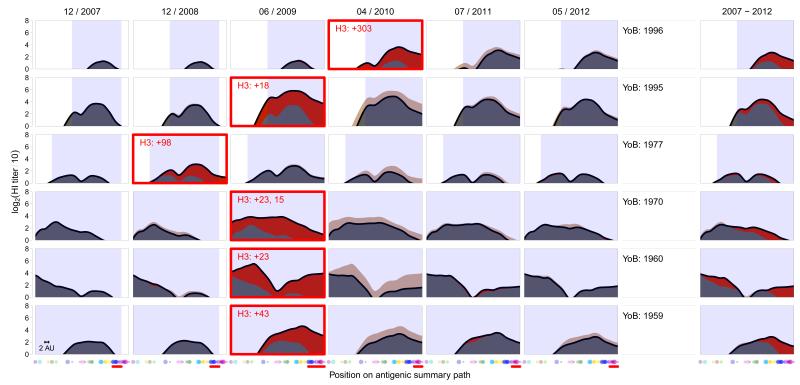
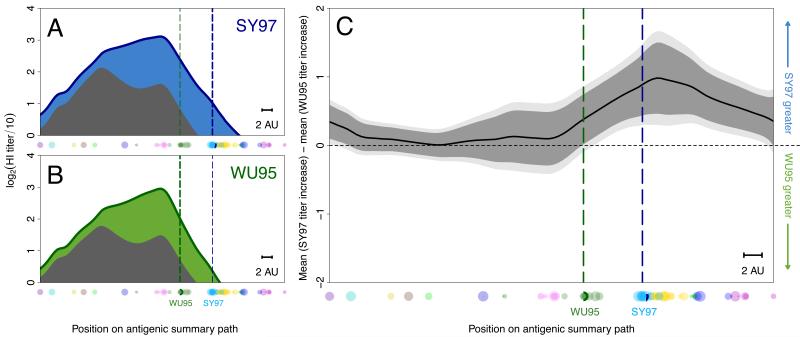
We introduce the antibody landscape, a method for the quantitative analysis of antibody-mediated immunity to antigenically variable pathogens, achieved by accounting for antigenic variation among pathogen strains. We generated antibody landscapes to study immune profiles covering 43 years of influenza A/H3N2 virus evolution for 69 individuals monitored for infection over 6 years and for 225 individuals pre- and postvaccination. Upon infection and vaccination, titers increased broadly, including previously encountered viruses far beyond the extent of cross-reactivity observed after a primary infection. We explored implications for vaccination and found that the use of an antigenically advanced virus had the dual benefit of inducing antibodies against both advanced and previous antigenic clusters. These results indicate that preemptive vaccine updates may improve influenza vaccine efficacy in previously exposed individuals.


Figures

Fig. 1
Fig. 1
Creating an antibody landscape. (A) Antigenic map of A/H3N2 showing virus strains color-coded by antigenic cluster. Both axes represent antigenic distance, the spacing between grid lines is 1 antigenic unit, corresponding to a twofold dilution of antiserum in the HI assay. Two units correspond to fourfold dilution, three units to eightfold dilution, and so on (2). The gray line shows a path through the antigenic clusters in chronological order calculated by fitting a smoothing spline (1). (B) An additional dimension indicates the measured antibody titers as vertical impulses and a smooth surface is fitted using locally weighted multiple linear regression to create the antibody landscape within the convex hull bounded by the viruses titrated (RMSE of fit = 1.23 HI log2-units). (C) The height of the landscape along the path in (A) shows a slice through the landscape (1). (D) The height of the landscape along the antigenic summary path is plotted to create a rotation-independent 2D summary visualization of the landscape. Titrated virus strains are shown in their corresponding positions along the x-axis, symbol radius is inversely proportional to antigenic distance from the path, symbol color indicates antigenic cluster. The scale bar indicates 2 antigen units; each antigenic unit is a 2-fold dilution in the HI assay.
Fig. 2
Fig. 2
Antibody landscapes from 2007-2012 for six individuals. The black line represents the landscape height for each position on the antigenic summary path through the antigenic clusters from Fig. 1A. The first sample taken after a confirmed A/H3N2 influenza virus infection is marked with a red box, and the red number gives the days from the start of influenza-like illness to serum collection. The red shading indicates increases, and beige decreases, compared to the previous year. The blue-shaded area indicates antigenic clusters that circulated during an individual’s lifespan until sample collection (Table S9). Dots along the x-axis indicate the subset of 30 viruses used to generate these landscapes - contemporary strains likely causing the infection are indicated with a red horizontal bar (Table S2). The rightmost column shows the difference between the landscape in 2012 compared to 2007. The scale bar indicates 2 antigenic units.
Fig. 3
Fig. 3
Comparison of two different vaccines. (A) The mean pre-vaccination landscape (gray) and landscape after vaccination with A/Sydney/5/97 (blue) in the 1998 study (123 individuals), or (B) with A/Nanchang/933/95 (green) in the 1997 study (102 individuals) for each position on the antigenic summary path. Dots along the x-axis indicate the subset of 70 viruses used to generate these landscapes. The vertical dotted lines indicate the position of the SY97 (blue) and WU95 (green) wild type vaccine viruses. (C) Comparison of titer increase after vaccination with A/Nanchang/933/95 or A/Sydney/5/97 for each position along the antigenic summary path. Above the horizontal midpoint indicates higher response to the A/Sydney/5/97 vaccine, below to the A/Nanchang/933/95 vaccine. Data were calculated from the average titer increase between each individual’s paired post-vaccination and pre-vaccination titers, with 95% (dark gray) and 99% (light gray) t-test based confidence intervals. The scale bar indicates 2 antigenic units.

Comment in

References

    1. Materials and methods are available as supplementary materials on Science Online.

    1. Smith DJ, et al. Mapping the antigenic and genetic evolution of influenza virus. Science. 2004;305:371–376. - PubMed
    1. Hirst GK. The quantitative determination of influenza virus and antibodies by means of red cell agglutination. J. Exp. Med. 1942;75:49–64. - PMC - PubMed
    1. Barr IG, et al. Epidemiological, antigenic and genetic characteristics of seasonal influenza A(H1N1), A(H3N2) and B influenza viruses: Basis for the WHO recommendation on the composition of influenza vaccines for use in the 2009-2010 Northern Hemisphere season. Vaccine. 2010;28:1156–1167. - PubMed
    1. Lessler J, et al. Evidence for antigenic seniority in influenza A (H3N2) antibody responses in Southern China. PLoS Pathog. 2012;8:e1002802. - PMC - PubMed

Publication types

MeSH terms