. 2015 Feb 18;43(3):e15.
doi: 10.1093/nar/gku1196. Epub 2014 Nov 20.

Rapid phylogenetic analysis of large samples of recombinant bacterial whole genome sequences using Gubbins

Affiliations

Rapid phylogenetic analysis of large samples of recombinant bacterial whole genome sequences using Gubbins

Nicholas J Croucher et al. Nucleic Acids Res. .

Abstract

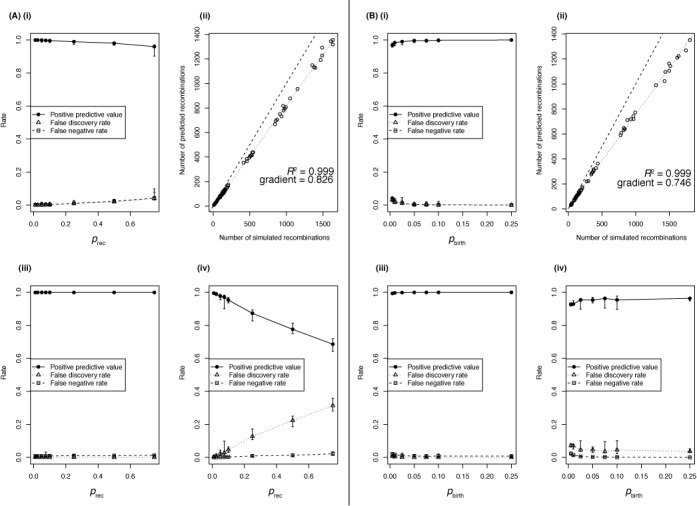
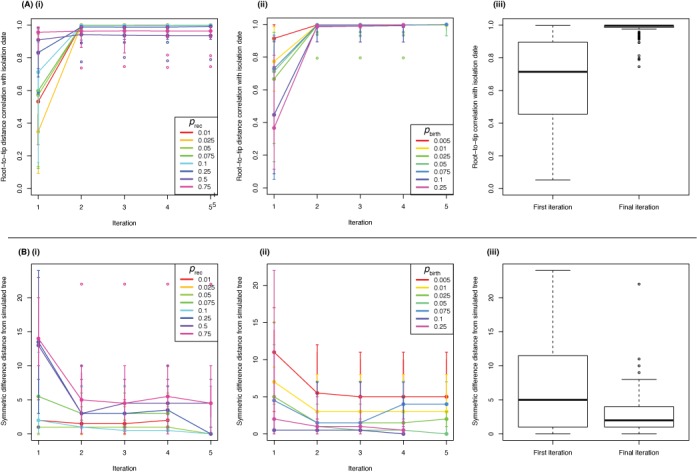
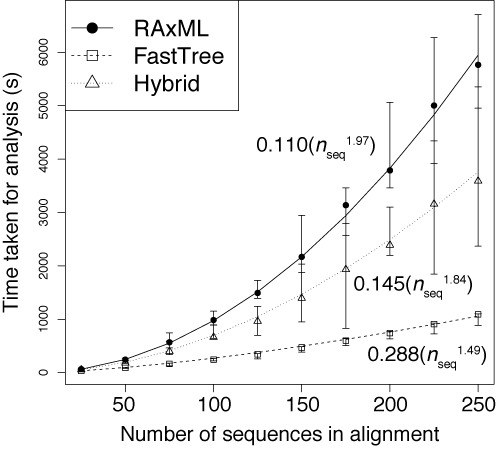
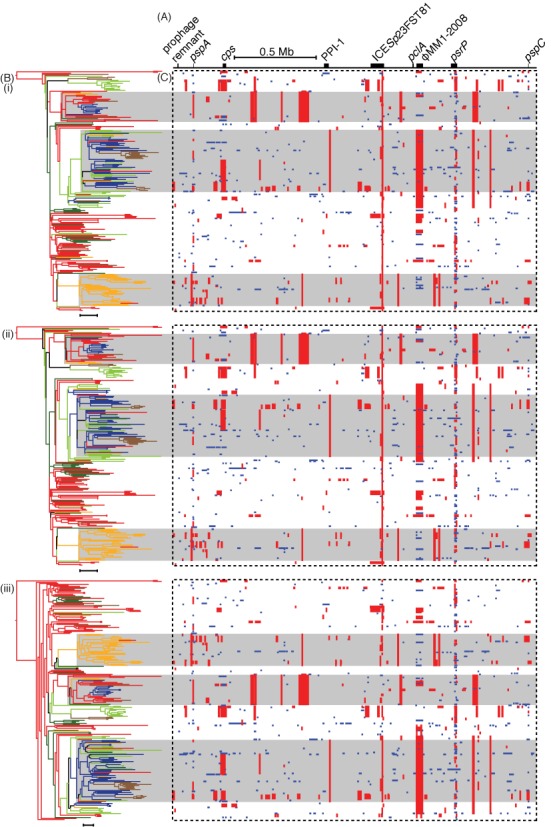
The emergence of new sequencing technologies has facilitated the use of bacterial whole genome alignments for evolutionary studies and outbreak analyses. These datasets, of increasing size, often include examples of multiple different mechanisms of horizontal sequence transfer resulting in substantial alterations to prokaryotic chromosomes. The impact of these processes demands rapid and flexible approaches able to account for recombination when reconstructing isolates' recent diversification. Gubbins is an iterative algorithm that uses spatial scanning statistics to identify loci containing elevated densities of base substitutions suggestive of horizontal sequence transfer while concurrently constructing a maximum likelihood phylogeny based on the putative point mutations outside these regions of high sequence diversity. Simulations demonstrate the algorithm generates highly accurate reconstructions under realistically parameterized models of bacterial evolution, and achieves convergence in only a few hours on alignments of hundreds of bacterial genome sequences. Gubbins is appropriate for reconstructing the recent evolutionary history of a variety of haploid genotype alignments, as it makes no assumptions about the underlying mechanism of recombination. The software is freely available for download at github.com/sanger-pathogens/Gubbins, implemented in Python and C and supported on Linux and Mac OS X.


Figures

Figure 1.
Figure 1.
Accuracy of Gubbins reconstructions from simulations using diverse sequences as recombination donors. (A) Impact of changing the rate of recombination (prec) relative to the rate of point mutation on the accuracy of Gubbins’ evolutionary reconstructions. (i) The accuracy of the overall reconstructed set of substitutions; each datapoint represents the median of 10 simulations, with the error bars representing the full range of values. (ii) The relationship between the number of simulated recombinations and the number of recombinations identified by Gubbins across the full dataset represented in (i). The dashed line represents the identity line and the dotted line is the best fit to the data; the gradient and Pearson correlation coefficient of the best fit line are annotated on this graph. (iii) The accuracy with which the correctly identified base substitutions were assigned as occurring through recombination rather than through point mutation. Metrics are plotted as in (i). (iv) The accuracy with which correctly identified base substitutions were identified as point mutations. Metrics are again represented as in (i). (B) Impact of changing the level of diversification (pbirth) between sequences being sampled from the simulated dataset. Plots again represent the output of 10 simulations for each value of pbirth, and show the same statistics as described in (A).
Figure 2.
Figure 2.
Accuracy of phylogenetic reconstructions from Gubbins analyses. (A) Accuracy of branch length estimation. (i) For each simulated dataset represented in Figure 1A, the Pearson correlation (R2) of the root-to-tip distances of simulated sequences with the number of time steps over which they had been diverging from the original sequence was calculated for the phylogenies from each iteration of the Gubbins analyses. The solid points linked by lines represent the median of the 10 simulations for each parameter set at each iteration; the vertical bars indicate the most extreme datapoints within 150% of the interquartile range. Empty circled points indicate outliers beyond this boundary. The color of each line indicates the prec parameter value in the simulations. (ii) The same statistics were calculated for the simulations displayed in Figure 1B. The results are displayed as in panel (i), with the color of the line representing the pbirth parameter value used in the simulation. (iii) Box and whisker plot summary of the R2 values for all simulations represented in Figure 1 for the ‘naïve’ phylogenies in the first iteration and the phylogenies from the final iteration. The whiskers extend to the most extreme datapoints within 150% of the interquartile range, with empty circled points representing outliers. (B) Accuracy of tree topologies. (i) For each simulated dataset represented in Figure 1A, the symmetric differences in terms of branching patterns between the actual history with which the simulated sequences diverged and the reconstructed phylogeny topologies from each iteration of the Gubbins were calculated. The median distances, and associated variation, are plotted for each prec value as in panel (A) (i). (ii) The same distances are calculated from the simulations displayed in Figure 1B, with the color of the line representing the pbirth parameter value used in the simulation. (iii) Boxplot summary of the symmetric differences for all simulations represented in Figure 1 for the ‘naïve’ phylogenies in the first iteration and the phylogenies from the final iteration, displayed as described in panel (A) (iii).
Figure 3.
Figure 3.
Relationship between Gubbins analysis times and number of sequences in alignment (nseq). The time taken for the analysis of alignments containing different numbers of simulated sequences are shown when using RAxML for constructing the phylogeny at each iteration (solid line), using FastTree 2 for constructing the phylogeny at each iteration (dashed line), or a hybrid approach that uses FastTree 2 in the first iteration and RAxML for all subsequent iterations (dotted line). The formulae for each of the best fit trend lines are displayed.
Figure 4.
Figure 4.
Analysis of the PMEN1 genome alignment with Gubbins employing different phylogeny construction strategies. (A) The simplified annotation of the S. pneumoniae ATCC 700669 genome. (B) The maximum likelihood phylogenies generated from the whole genome alignment of 241 S. pneumoniae PMEN1 isolates after re-analysis using the Gubbins algorithm either relying on (i) RAxML for constructing the phylogeny in each iteration, (ii) the hybrid approach of FastTree 2 for the first iteration and RAxML for subsequent iterations, or (iii) FastTree 2 for constructing the phylogeny in each iteration. Each phylogeny was midpoint rooted and colored according to location, as reconstructed through the tree from the countries of isolation of the sequences using maximum parsimony: red for Western Europe, brown for Eastern Europe, light green for North America, dark green for South America, yellow for South Africa and dark blue for South-East Asia. The backgrounds of three large clades are shaded gray to aid the alignment of the phylogeny with the panels in (C) (i–iii). Scale bars underneath the phylogenies represent a phylogenetic distance of 20 point mutations. (C) These panels represent the pattern of predicted recombinations from the analyses using the three different phylogeny estimation approaches (i–iii). Each column relates to a base in the reference genome; each row represents an isolate in the phylogeny. Red blocks indicate predicted recombinations occurring on an internal branch, which are therefore shared by multiple isolates through common descent. Blue blocks represent recombinations that occur on terminal branches, which are unique to individual isolates.
Figure 5.
Figure 5.
Comparison of ClonalFrame and Gubbins analyses of S. pneumoniae and S. aureus sequences. (A) Analysis of 11 S. pneumoniae PMEN1 sequences using (i) ClonalFrame and (ii) Gubbins. (B) Analysis of 14 S. aureus ST239 isolates using (i) ClonalFrame and (ii) Gubbins. The output of Gubbins is displayed as described in Figure 4. The output of ClonalFrame is displayed in a similar manner, with the tree representing the 50% majority-rule consensus phylogeny, and the red blocks indicating recombinations defined by a contiguous set of sites with a posterior probability of recombination above 0.5, with at least one site having a posterior probability above 0.95, as described in (55).

References

    1. Smith J.M., Smith N.H., O'Rourke M., Spratt B.G. How clonal are bacteria? Proc. Natl Acad. Sci. U.S.A. 1993;90:4384–4388. - PMC - PubMed
    1. Achtman M. Evolution, population structure, and phylogeography of genetically monomorphic bacterial pathogens. Annu. Rev. Microbiol. 2008;62:53–70. - PubMed
    1. Holt K.E., Parkhill J., Mazzoni C.J., Roumagnac P., Weill F.X., Goodhead I., Rance R., Baker S., Maskell D.J., Wain J., et al. High-throughput sequencing provides insights into genome variation and evolution in Salmonella Typhi. Nat. Genet. 2008;40:987–993. - PMC - PubMed
    1. Harris S.R., Feil E.J., Holden M.T., Quail M.A., Nickerson E.K., Chantratita N., Gardete S., Tavares A., Day N., Lindsay J.A., et al. Evolution of MRSA during hospital transmission and intercontinental spread. Science. 2010;327:469–474. - PMC - PubMed
    1. Didelot X., Achtman M., Parkhill J., Thomson N.R., Falush D. A bimodal pattern of relatedness between the Salmonella Paratyphi A and Typhi genomes: convergence or divergence by homologous recombination? Genome Res. 2007;17:61–68. - PMC - PubMed

Publication types