. 2014 Nov 4:5:352.
doi: 10.3389/fgene.2014.00352. eCollection 2014.

Controlling for population structure and genotyping platform bias in the eMERGE multi-institutional biobank linked to electronic health records

Affiliations

Controlling for population structure and genotyping platform bias in the eMERGE multi-institutional biobank linked to electronic health records

David R Crosslin et al. Front Genet. .

Abstract

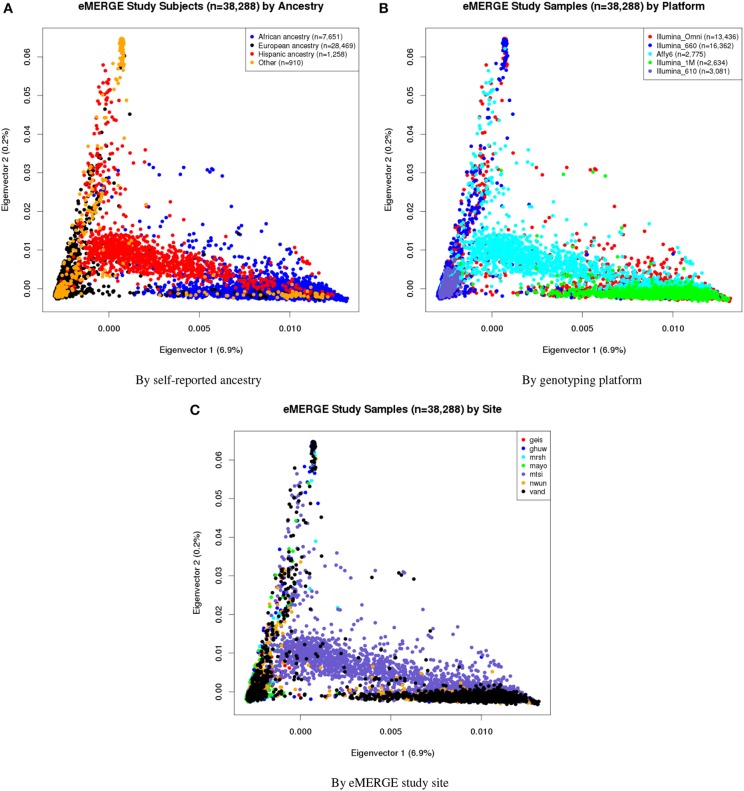
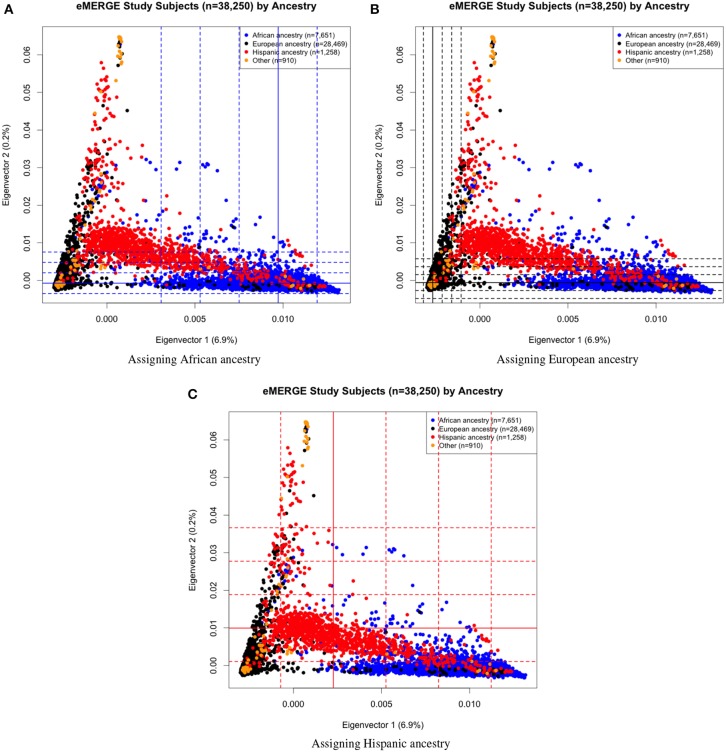
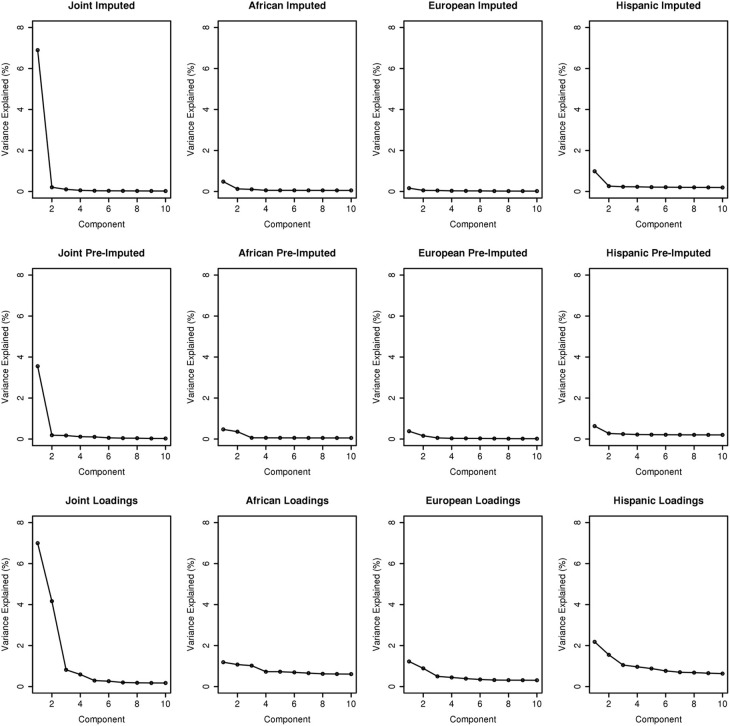
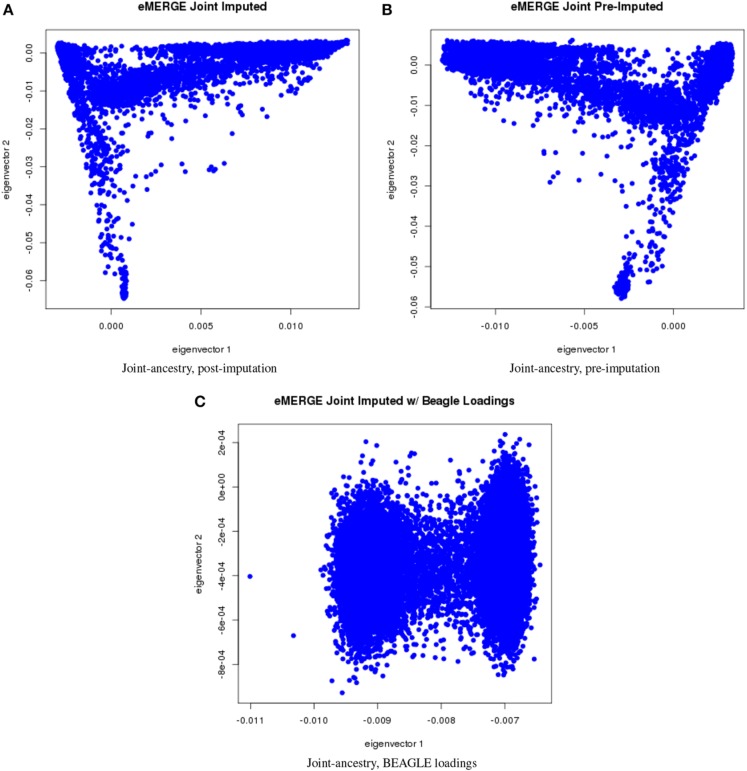
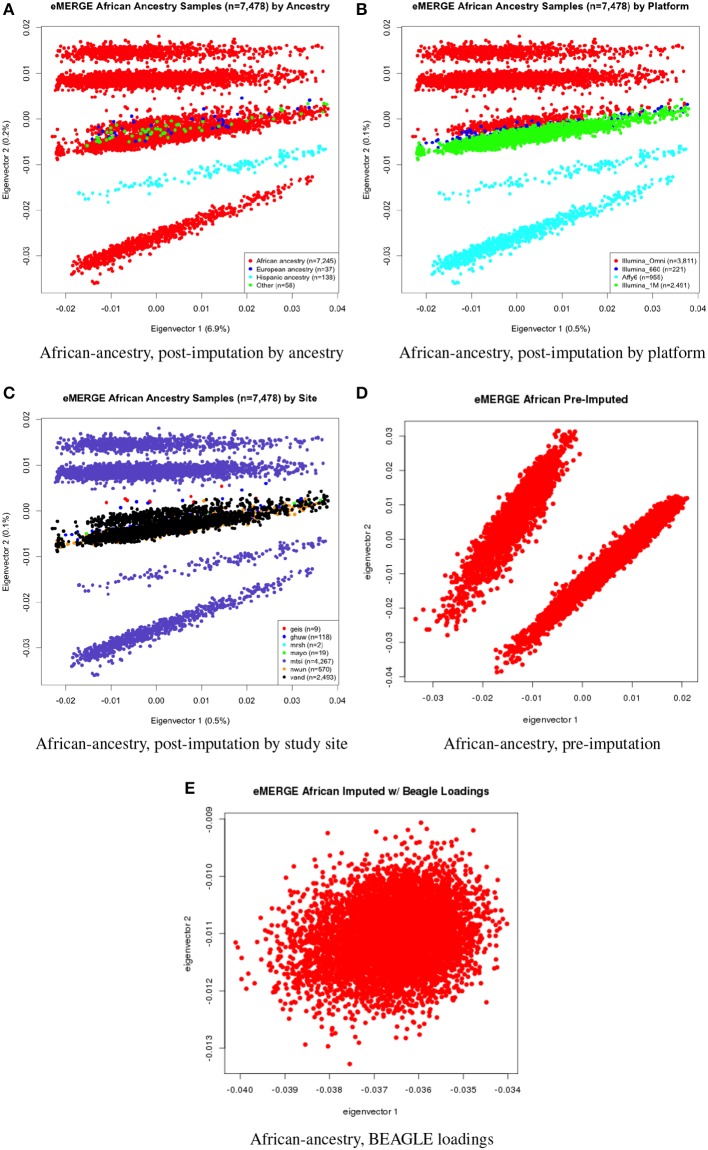
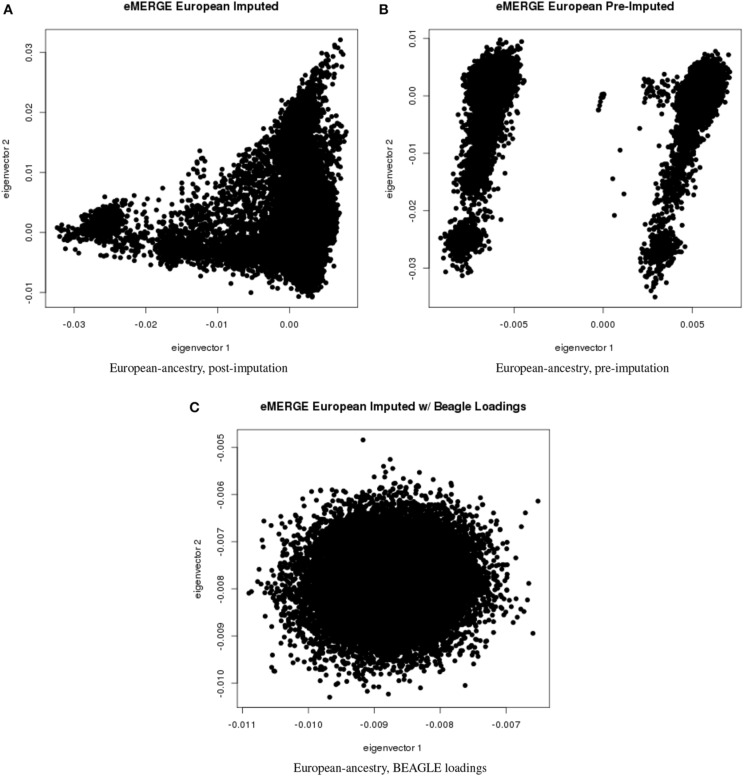
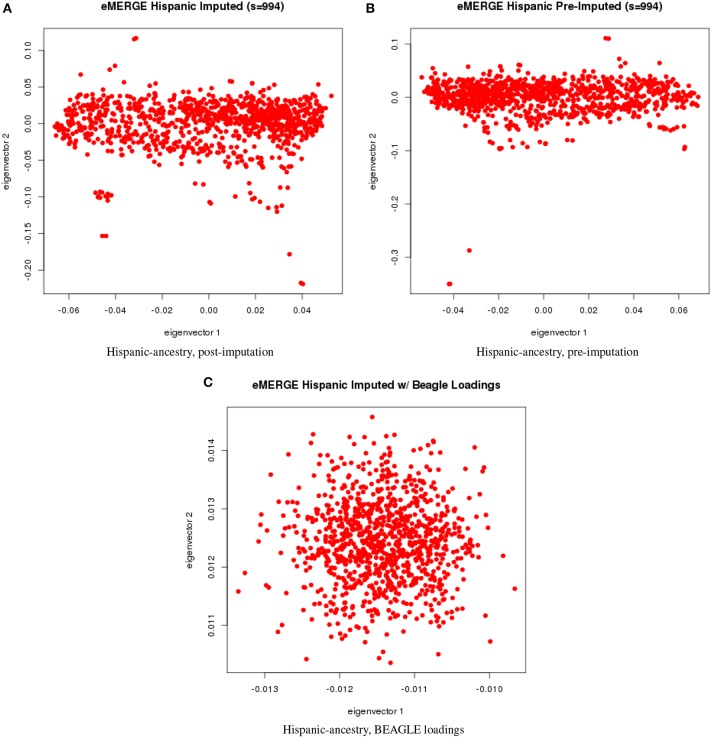
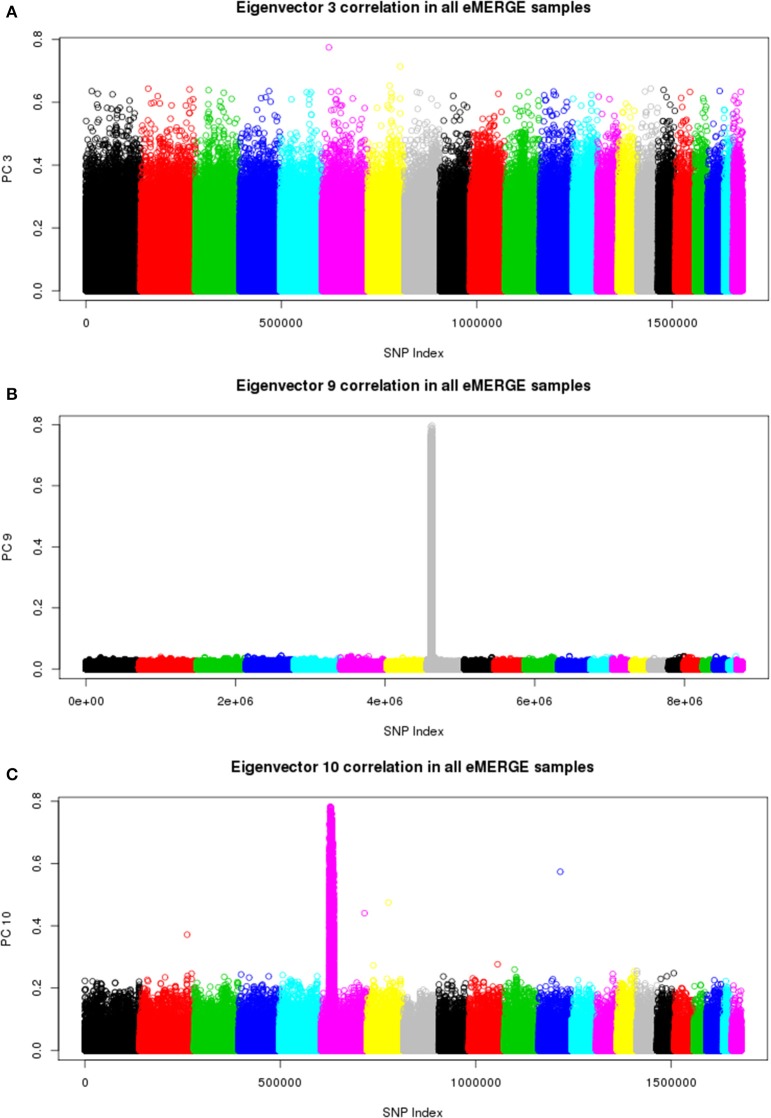
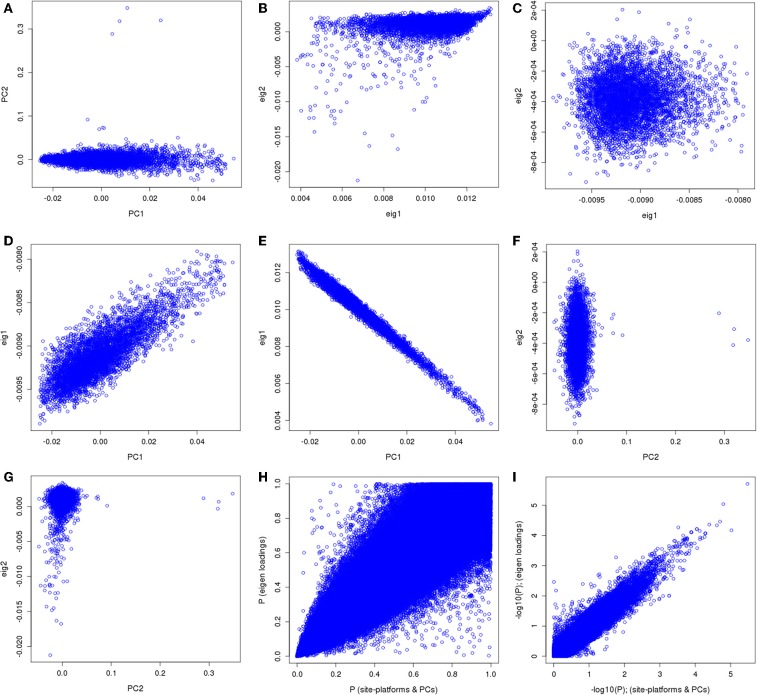
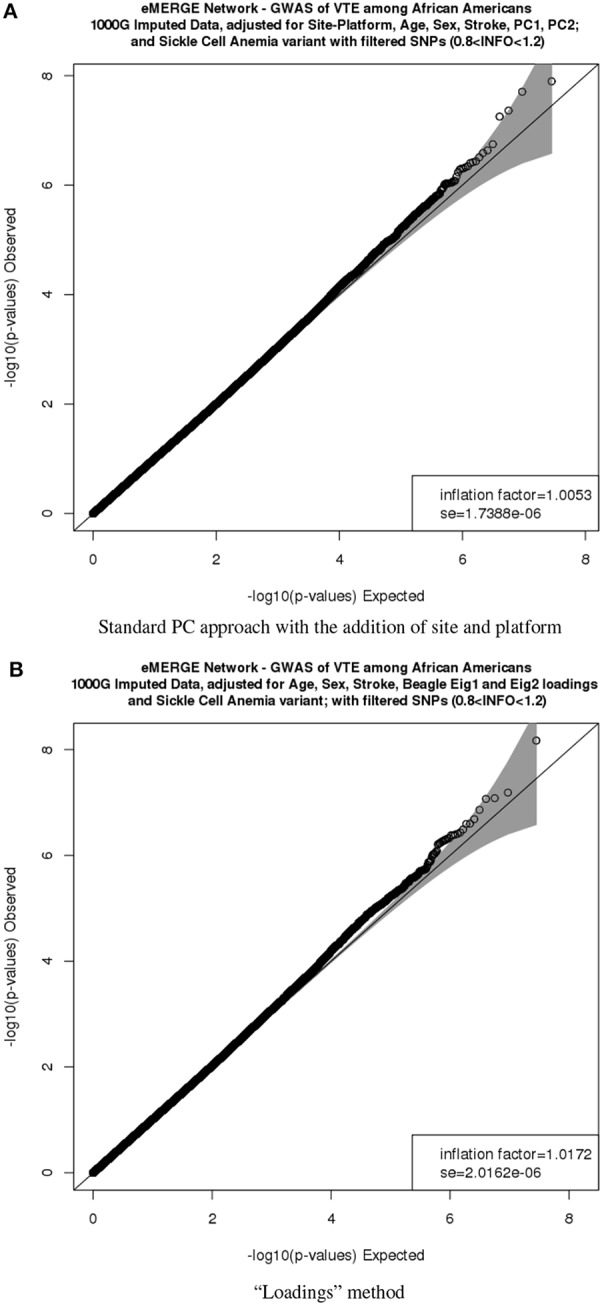
Combining samples across multiple cohorts in large-scale scientific research programs is often required to achieve the necessary power for genome-wide association studies. Controlling for genomic ancestry through principal component analysis (PCA) to address the effect of population stratification is a common practice. In addition to local genomic variation, such as copy number variation and inversions, other factors directly related to combining multiple studies, such as platform and site recruitment bias, can drive the correlation patterns in PCA. In this report, we describe the combination and analysis of multi-ethnic cohort with biobanks linked to electronic health records for large-scale genomic association discovery analyses. First, we outline the observed site and platform bias, in addition to ancestry differences. Second, we outline a general protocol for selecting variants for input into the subject variance-covariance matrix, the conventional PCA approach. Finally, we introduce an alternative approach to PCA by deriving components from subject loadings calculated from a reference sample. This alternative approach of generating principal components controlled for site and platform bias, in addition to ancestry differences, has the advantage of fewer covariates and degrees of freedom.

Keywords: ancestry; biobank; genetic association study; loadings; principal component analysis.


Figures

Figure 1
Figure 1
PC plots of PCs 1 and 2 for all adults of eMERGE by self-reported race. (A), genotyping platform (B), and eMERGE study site (C), using BEAGLE imputed data. (1) geis, Geisinger Health System, (2) ghuw, Group Health Research Institute/University of Washington; (3) mrsh, Marshfield Clinic Research Foundation; (4) mayo, Mayo Clinic; (5) mtsi, Mount Sinai School of Medicine; (6) nwun, Northwestern University; and (7) vand, Vanderbilt University.
Figure 2
Figure 2
PC plots of PCs 1 and 2 comparing eMERGE genetically determined and self-reported ancestry, using BEAGLE imputed data. (A) African ancestry assigned using (Q2A ± 2SD) of eigenvectors 1 and 2 for self-reported as African ancestry. (B) European ancestry assigned using (Q2E ± 4SD) of eigenvectors 1 and 2 for self-reported as European ancestry. (C) Hispanic assigned using (Q2H ± 1SD) of eigenvectors 1 and 2 for self-reported as Hispanics.
Figure 3
Figure 3
Scree plots illustrating variance explained for PCA outlined in this manuscript.
Figure 4
Figure 4
PC plots of eMERGE joint ancestry. (A) Plot of eigenvectors 1 and 2 for the joint imputed data set. (B) Plot of eigenvectors 1 and 2 for the joint pre-imputed data set. (C) Plot of eigenvectors 1 and 2 for the joint imputed data set using the “loadings” method.
Figure 5
Figure 5
PC plots of eMERGE participants geneticaly determined to be of African ancestry. (A) Plot of eigenvectors 1 and 2 for the imputed data set African ancestry participants, annotated by self-reported ancestry. (B) Plot of eigenvectors 1 and 2 for the imputed data set African ancestry participants, annotated by genotyping platform. (C) Plot of eigenvectors 1 and 2 for the imputed data set African ancestry participants, annotated by eMERGE site. (D) Plot of eigenvectors 1 and 2 for the pre-imputed data set African ancestry participants. (E) Plot of eigenvectors 1 and 2 for the imputed data set African ancestry participants using the “loadings” method.
Figure 6
Figure 6
PC plots of eMERGE participants genetically determined to be of European ancestry. (A) Plot of eigenvectors 1 and 2 for the imputed data set Hispanic participants. (B) Plot of eigenvectors 1 and 2 for the pre-imputed data set Hispanic participants. (C) Plot of eigenvectors 1 and 2 for the imputed data set Hispanic participants using the “loadings” method.
Figure 7
Figure 7
PC plots of eMERGE participants genetically determined to be Hispanic. (A) Plot of eigenvectors 1 and 2 for the imputed data set Hispanic participants. (B) Plot of eigenvectors 1 and 2 for the pre-imputed data set Hispanic participants. (C) Plot of eigenvectors 1 and 2 for the imputed data set Hispanic participants using the “loadings” method.
Figure 8
Figure 8
Eigenvector-genotype correlation plots from the joint ancestry PCA analyses representing genome-wide correlation (A), correlation driven the chromosome 8 inversion (B), and correlation driven by the HLA region (C).
Figure 9
Figure 9
PC comparisons derived from the “loadings” method and PCs derived from the equivalent of the imputation method for venous thromboembolism association in African ancestry participants.
Figure 10
Figure 10
QQ plots of the venous thromboembolism (VTE) association in African ancestry participants. PC comparisons derived from the “loadings” method and PCs derived from the equivalent of the imputation method. (A) QQ plots of the VTE association in African ancestry participants using PCs derived from the equivalent of the imputation method. (B) QQ plots of the VTE association in African ancestry participants using PCs derived from the equivalent of the “loadings” method.

References

    1. Ali-Khan S. E., Krakowski T., Tahir R., Daar A. S. (2011). The use of race, ethnicity and ancestry in human genetic research. HUGO J. 5, 47–63. 10.1007/s11568-011-9154-5 - DOI - PMC - PubMed
    1. Browning B. L., Browning S. R. (2009). A unified approach to genotype imputation and haplotype-phase inference for large data sets of trios and unrelated individuals. Am. J. Hum. Genet. 84, 210–223. 10.1016/j.ajhg.2009.01.005 - DOI - PMC - PubMed
    1. Crawford D. C., Crosslin D. R., Tromp G., Kullo I. J., Kuivaniemi H., Hayes M. G., et al. . (2014). eMERGEing progress in genomics—the first seven years. Front. Genet. 5:184. 10.3389/fgene.2014.00184 - DOI - PMC - PubMed
    1. Delaneau O., Zagury J.-F., Marchini J. (2013). Improved whole-chromosome phasing for disease and population genetic studies. Nat. Meth. 10, 5–6. 10.1038/nmeth.2307 - DOI - PubMed
    1. Dumitrescu L., Ritchie M. D., Brown-Gentry K., Pulley J. M., Basford M., Denny J. C., et al. . (2010). Assessing the accuracy of observer-reported ancestry in a biorepository linked to electronic medical records. Genet. Med. 12, 648–650. 10.1097/GIM.0b013e3181efe2df - DOI - PMC - PubMed

LinkOut - more resources