

Targeting ornithine decarboxylase reverses the LIN28/Let-7 axis and inhibits glycolytic metabolism in neuroblastoma
- PMID: 25415050
- PMCID: PMC4381588
- DOI: 10.18632/oncotarget.2768
Targeting ornithine decarboxylase reverses the LIN28/Let-7 axis and inhibits glycolytic metabolism in neuroblastoma
Abstract
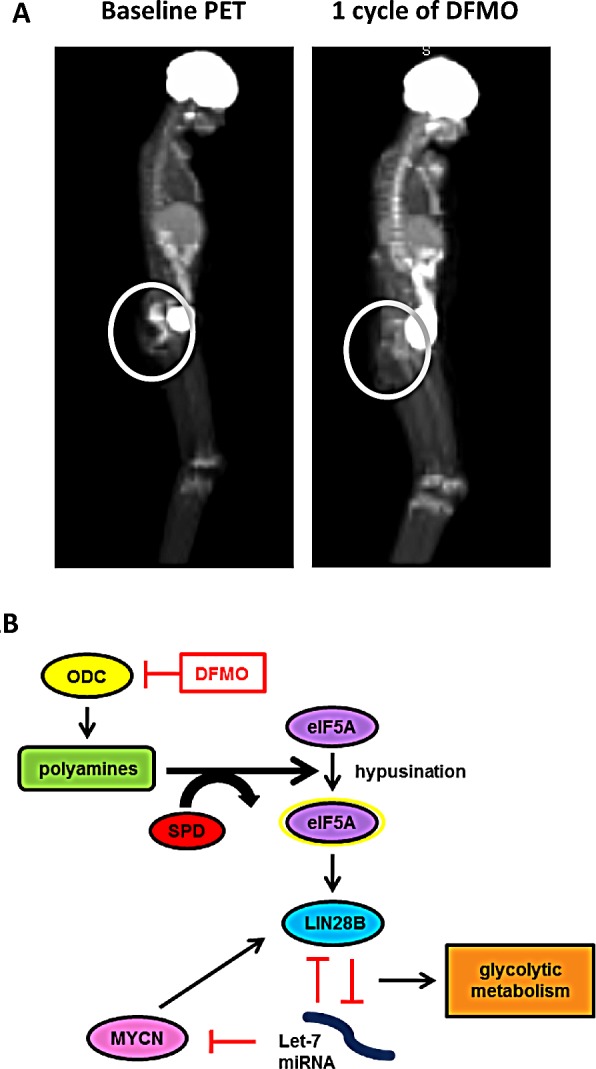
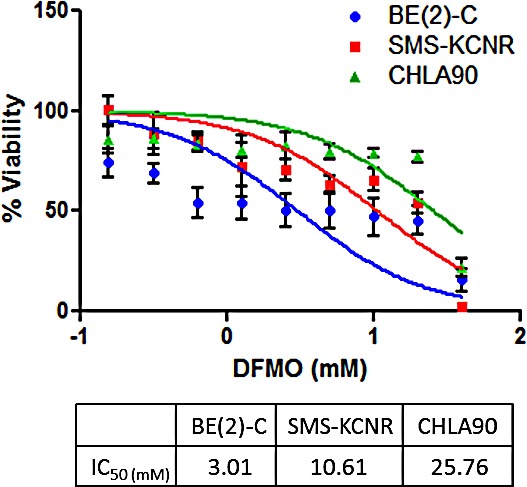
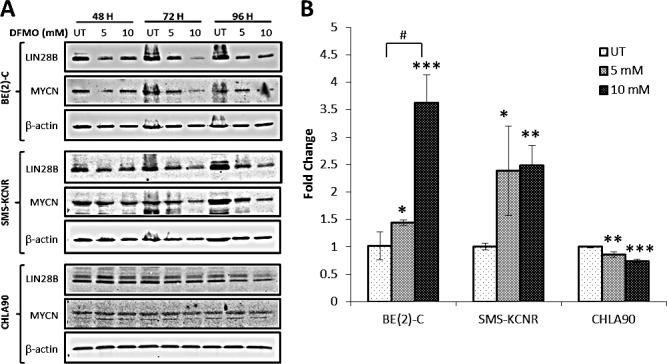
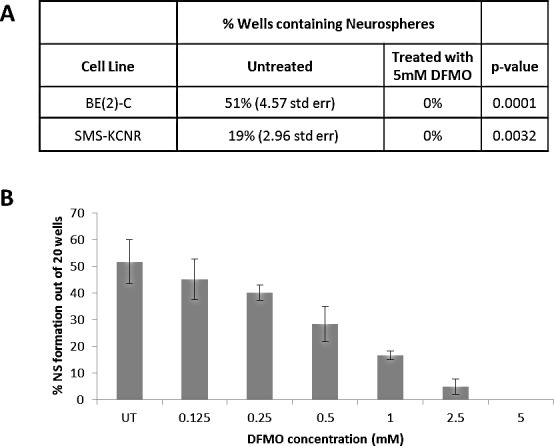
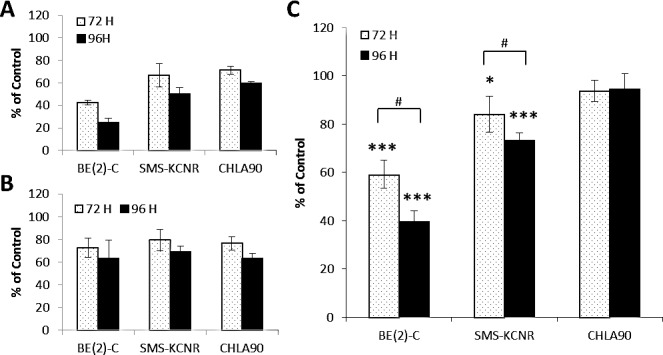
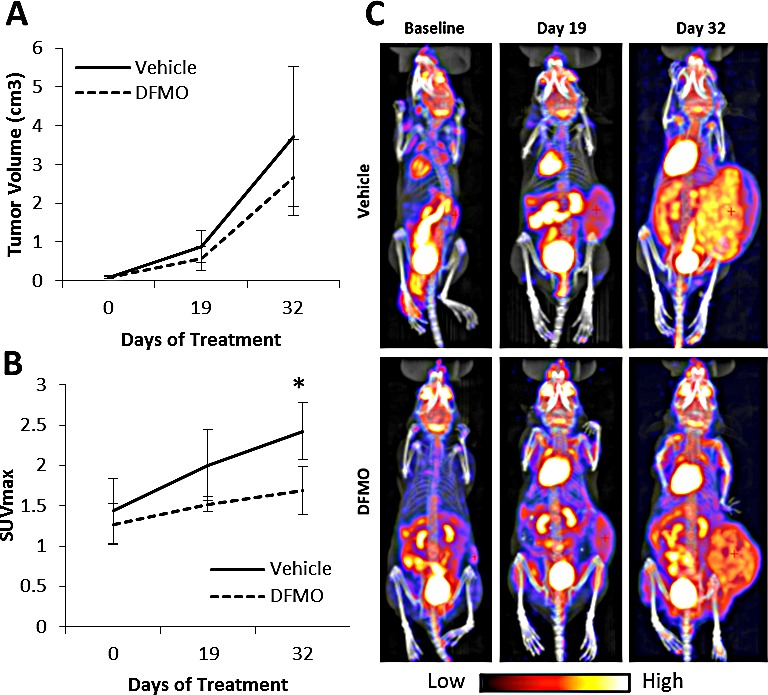
LIN28 has emerged as an oncogenic driver in a number of cancers, including neuroblastoma (NB). Overexpression of LIN28 correlates with poor outcome in NB, therefore drugs that impact the LIN28/Let-7 pathway could be beneficial in treating NB patients. The LIN28/Let-7 pathway affects many cellular processes including the regulation of cancer stem cells and glycolytic metabolism. Polyamines, regulated by ornithine decarboxylase (ODC) modulate eIF-5A which is a direct regulator of the LIN28/Let-7 axis. We propose that therapy inhibiting ODC will restore balance to the LIN28/Let-7 axis, suppress glycolytic metabolism, and decrease MYCN protein expression in NB. Difluoromethylornithine (DFMO) is an inhibitor of ODC in clinical trials for children with NB. In vitro experiments using NB cell lines, BE(2)-C, SMS-KCNR, and CHLA90 show that DFMO treatment reduced LIN28B and MYCN protein levels and increased Let-7 miRNA and decreased neurosphere formation. Glycolytic metabolic activity decreased with DFMO treatment in vivo. Additionally, sensitivity to DFMO treatment correlated with LIN28B overexpression (BE(2)-C>SMS-KCNR>CHLA90). This is the first study to demonstrate that DFMO treatment restores balance to the LIN28/Let-7 axis and inhibits glycolytic metabolism and neurosphere formation in NB and that PET scans may be a meaningful imaging tool to evaluate the therapeutic effects of DFMO treatment.
Conflict of interest statement
The authors have no conflict of interest to report.
Figures
Similar articles
-
AMXT-1501, a novel polyamine transport inhibitor, synergizes with DFMO in inhibiting neuroblastoma cell proliferation by targeting both ornithine decarboxylase and polyamine transport.Int J Cancer. 2013 Sep 15;133(6):1323-33. doi: 10.1002/ijc.28139. Epub 2013 May 30. Int J Cancer. 2013. PMID: 23457004
-
A Phase I Trial of DFMO Targeting Polyamine Addiction in Patients with Relapsed/Refractory Neuroblastoma.PLoS One. 2015 May 27;10(5):e0127246. doi: 10.1371/journal.pone.0127246. eCollection 2015. PLoS One. 2015. PMID: 26018967 Free PMC article. Clinical Trial.
-
Synergistic drug combination GC7/DFMO suppresses hypusine/spermidine-dependent eIF5A activation and induces apoptotic cell death in neuroblastoma.Biochem J. 2018 Jan 31;475(2):531-545. doi: 10.1042/BCJ20170597. Biochem J. 2018. PMID: 29295892
-
LIN28/LIN28B: an emerging oncogenic driver in cancer stem cells.Int J Biochem Cell Biol. 2013 May;45(5):973-8. doi: 10.1016/j.biocel.2013.02.006. Epub 2013 Feb 16. Int J Biochem Cell Biol. 2013. PMID: 23420006 Review.
-
Translational development of difluoromethylornithine (DFMO) for the treatment of neuroblastoma.Transl Pediatr. 2015 Jul;4(3):226-38. doi: 10.3978/j.issn.2224-4336.2015.04.06. Transl Pediatr. 2015. PMID: 26835380 Free PMC article. Review.
Cited by
-
Impact of Difluoromethylornithine and AMXT 1501 on Gene Expression and Capsule Regulation in Streptococcus pneumoniae.Biomolecules. 2024 Feb 2;14(2):178. doi: 10.3390/biom14020178. Biomolecules. 2024. PMID: 38397415 Free PMC article.
-
Exploring the Potential of MicroRNA Let-7c as a Therapeutic for Prostate Cancer.Mol Ther Nucleic Acids. 2019 Dec 6;18:927-937. doi: 10.1016/j.omtn.2019.09.031. Epub 2019 Oct 23. Mol Ther Nucleic Acids. 2019. PMID: 31760377 Free PMC article. Review.
-
Upregulating Lin28a Promotes Axon Regeneration in Adult Mice with Optic Nerve and Spinal Cord Injury.Mol Ther. 2020 Aug 5;28(8):1902-1917. doi: 10.1016/j.ymthe.2020.04.010. Epub 2020 Apr 15. Mol Ther. 2020. PMID: 32353321 Free PMC article.
-
US Food and Drug Administration Approval Summary: Eflornithine for High-Risk Neuroblastoma After Prior Multiagent, Multimodality Therapy.J Clin Oncol. 2024 Sep 1;42(25):3047-3057. doi: 10.1200/JCO.24.00546. Epub 2024 Jun 25. J Clin Oncol. 2024. PMID: 38917371
-
A new 68Ga-labeled ornithine derivative for PET imaging of ornithine metabolism in tumors.Amino Acids. 2023 May;55(5):595-606. doi: 10.1007/s00726-023-03250-z. Epub 2023 Feb 21. Amino Acids. 2023. PMID: 36809562
References
-
- Hayat M.H., editor. Neuroblastoma: Ornithine Decarboxylase and Polyamines are Novel Targets for Therapeutic Intervention, in Neuroblastoma. Springer; London, NY: 2011.
-
- Maris JM, Hogarty MD, Bagatell R, Cohn SL. Neuroblastoma. Lancet. 2007;369(9579):2106–2120. - PubMed
-
- Seeger RC, Brodeur GM, Sather H, Dalton A, Siegel SE, Wong KY, Hammond D. Association of multiple copies of the N-myc oncogene with rapid progression of neuroblastomas. N Engl J Med. 1985;313(18):1111–1116. - PubMed
-
- S Samal K, Zhao P, Kendzicky A, Yco LP, McClung H, Gerner E, Burns M, Bachmann AS, Sholler G. AMXT-1501, a novel polyamine transport inhibitor, synergizes with DFMO in inhibiting neuroblastoma cell proliferation by targeting both ornithine decarboxylase and polyamine transport. Int J Cancer. 2013;133(6):1323–1333. - PubMed
-
- Hixson LJ, Garewal HS, McGee DL, Sloan D, Fennerty MB, Sampliner RE, Gerner EW. Ornithine decarboxylase and polyamines in colorectal neoplasia and mucosa. Cancer Epidemiol Biomarkers Prev. 1993;2(4):369–374. - PubMed
MeSH terms
Substances
LinkOut - more resources
Full Text Sources
Other Literature Sources
Medical
Research Materials
