. 2014 Nov 21:5:5383.
doi: 10.1038/ncomms6383.

The oestrogen receptor alpha-regulated lncRNA NEAT1 is a critical modulator of prostate cancer

Affiliations

The oestrogen receptor alpha-regulated lncRNA NEAT1 is a critical modulator of prostate cancer

Dimple Chakravarty et al. Nat Commun. .

Abstract

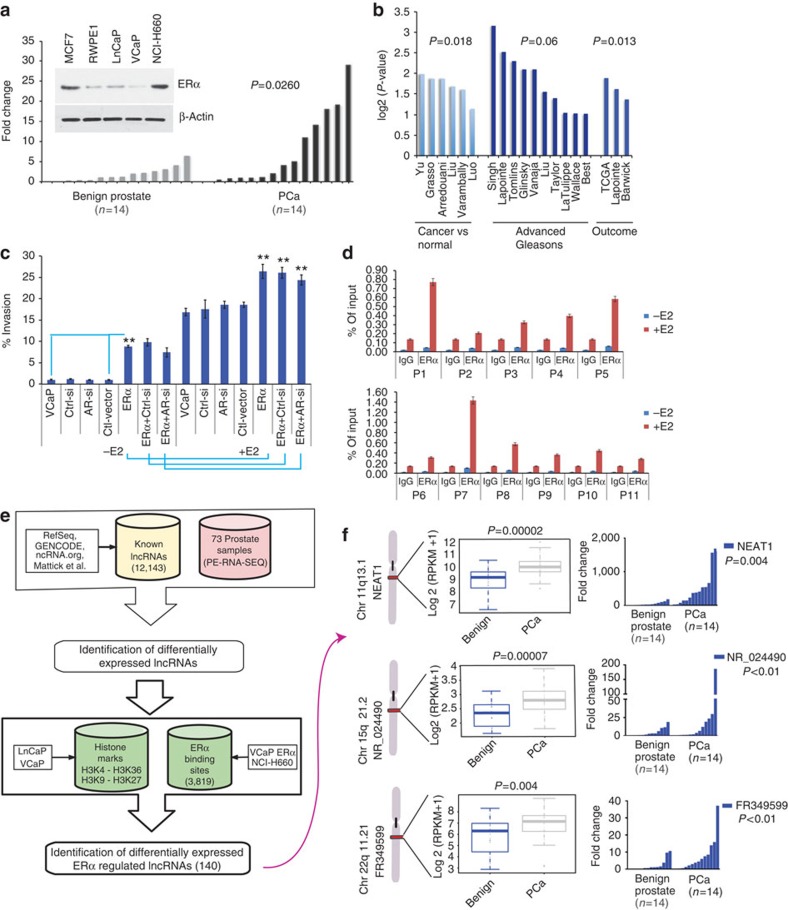
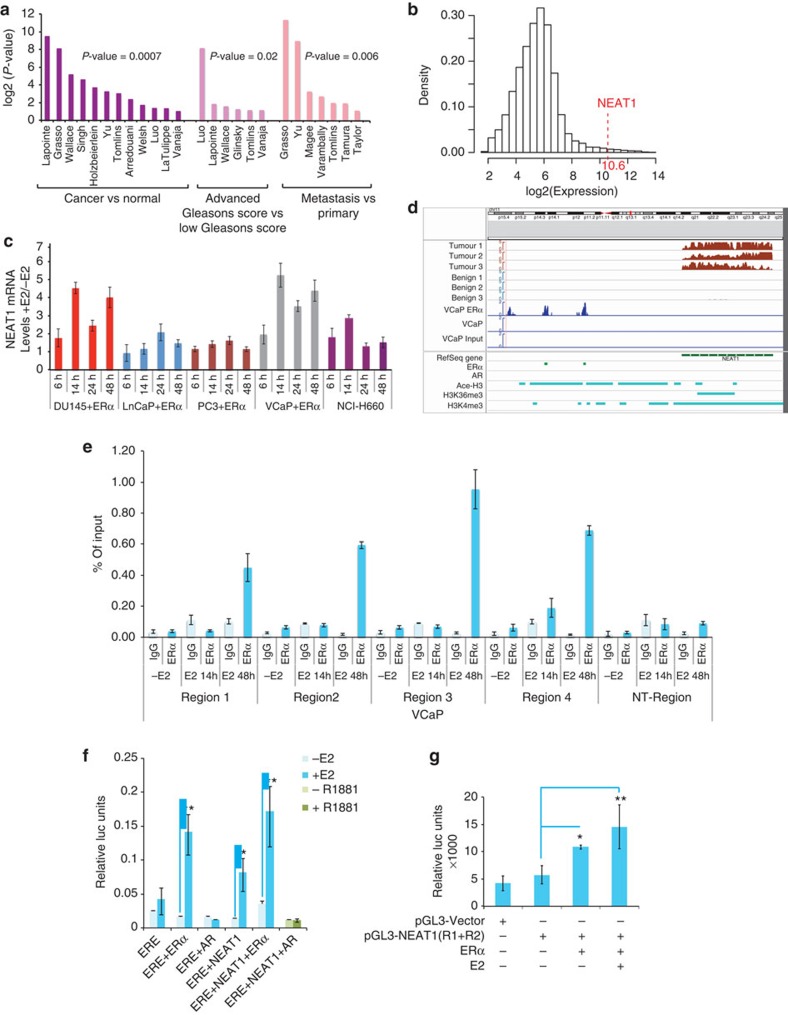
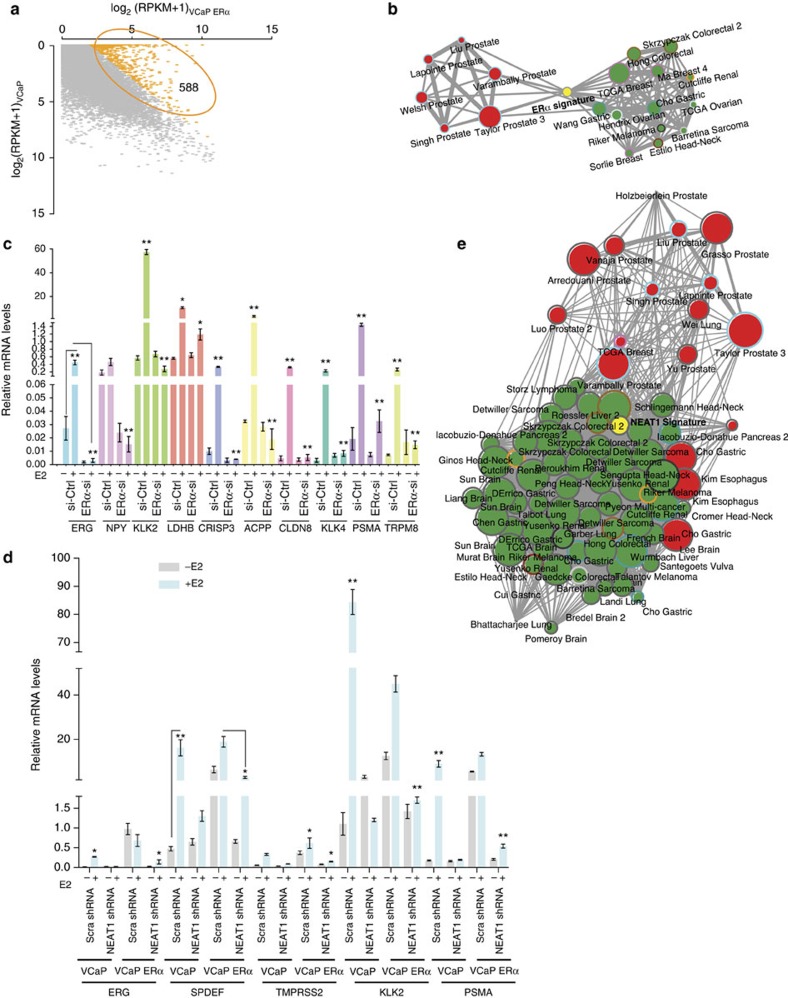
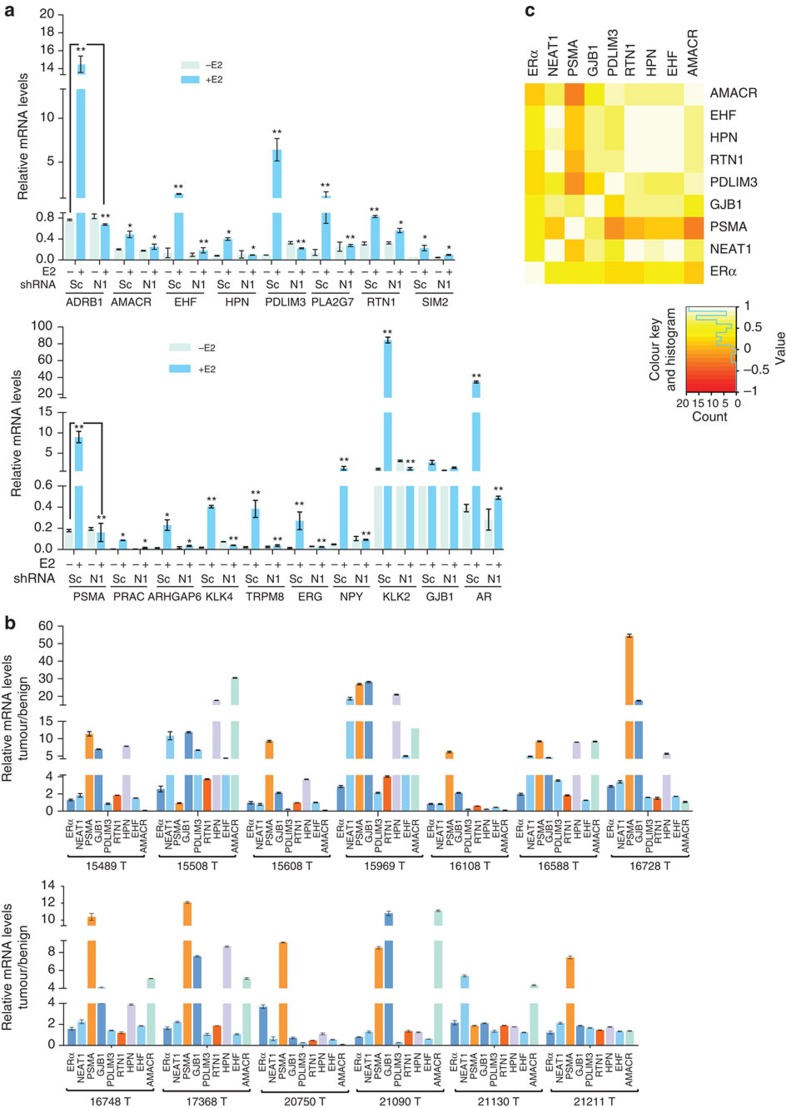
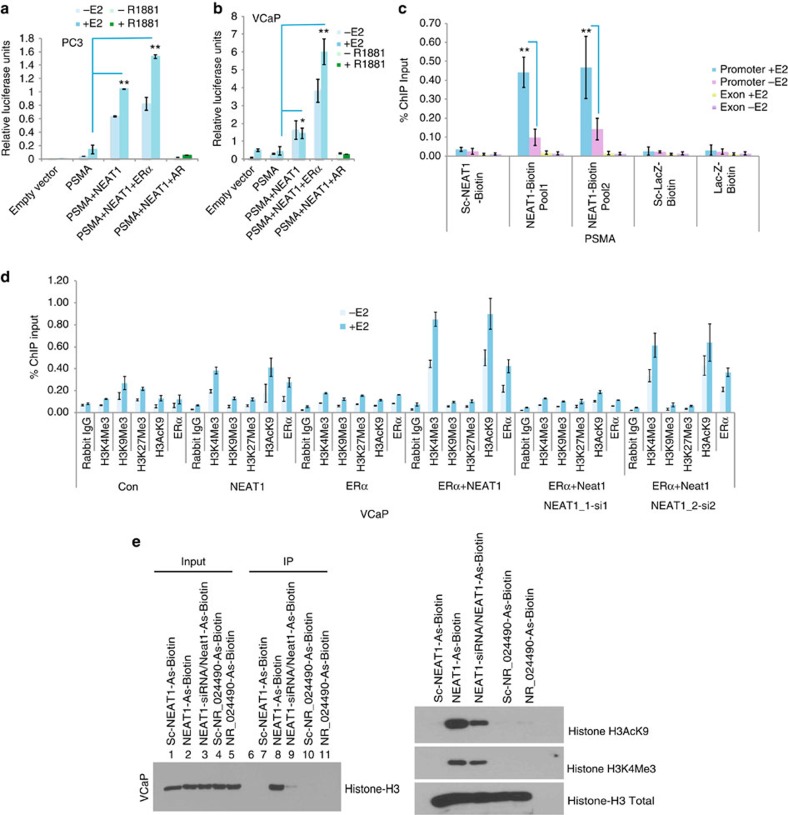
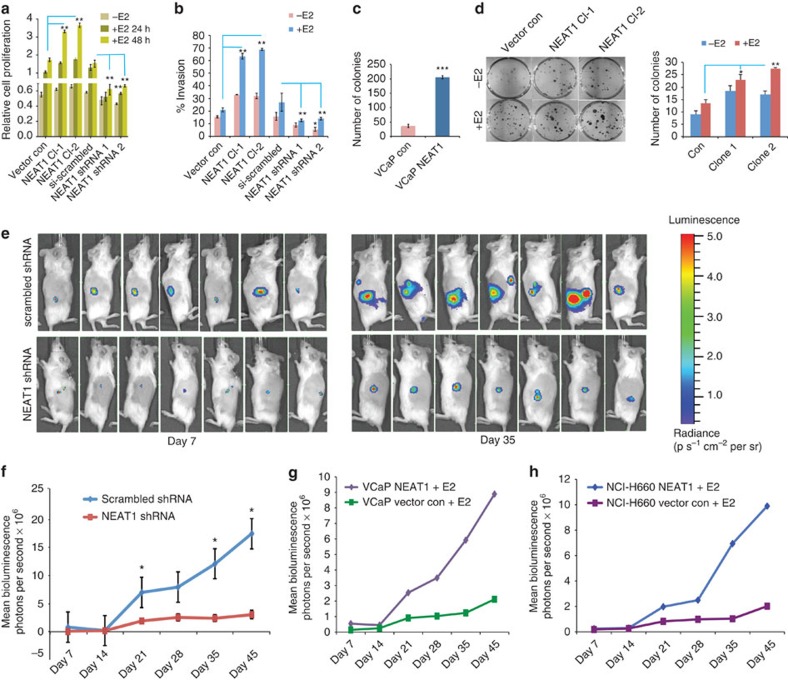
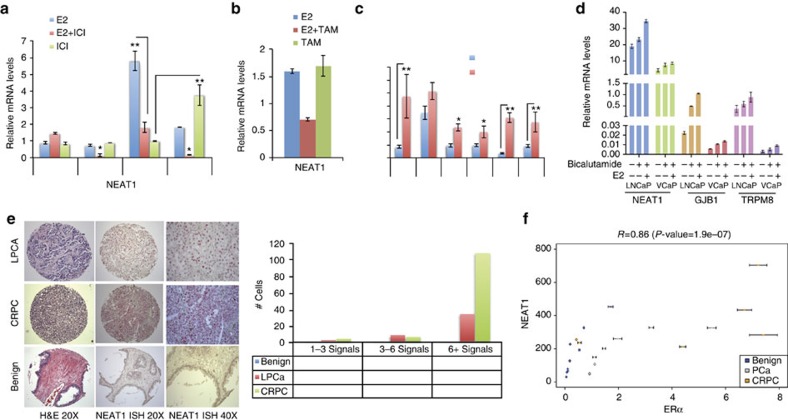
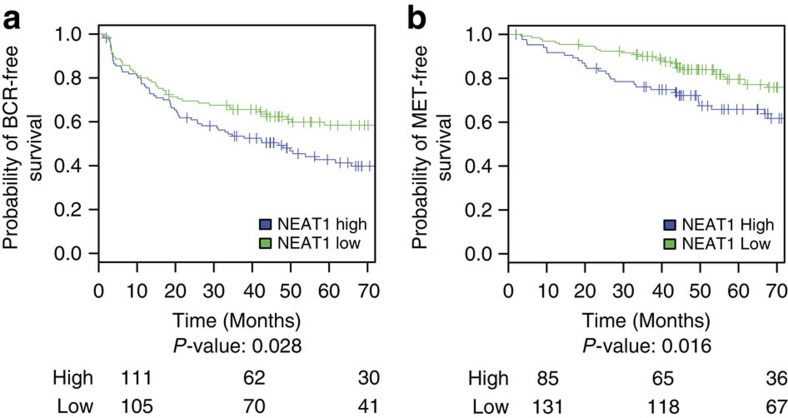
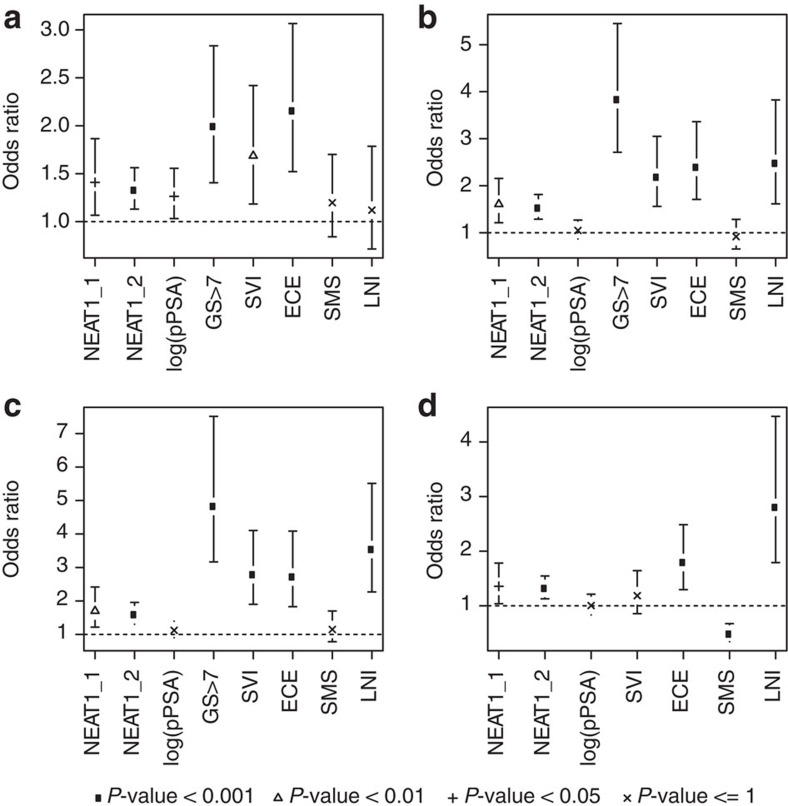
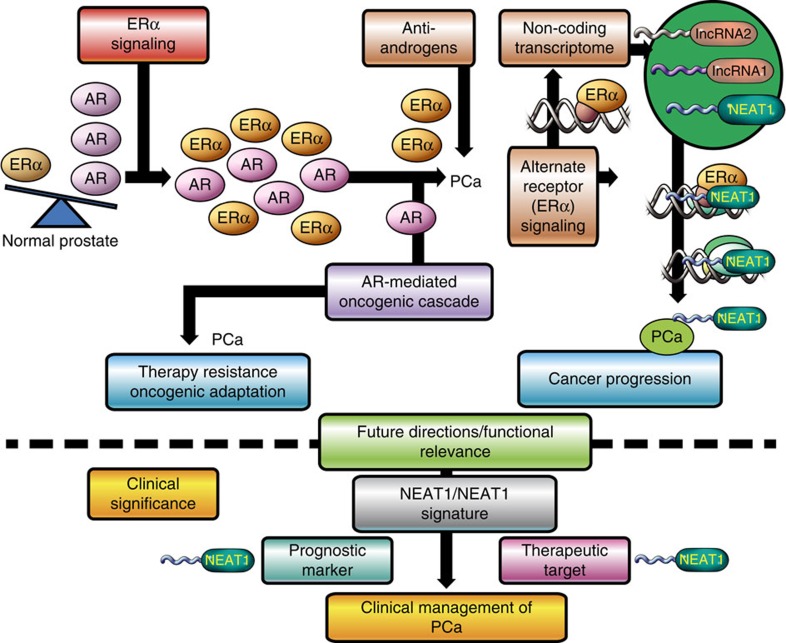
The androgen receptor (AR) plays a central role in establishing an oncogenic cascade that drives prostate cancer progression. Some prostate cancers escape androgen dependence and are often associated with an aggressive phenotype. The oestrogen receptor alpha (ERα) is expressed in prostate cancers, independent of AR status. However, the role of ERα remains elusive. Using a combination of chromatin immunoprecipitation (ChIP) and RNA-sequencing data, we identified an ERα-specific non-coding transcriptome signature. Among putatively ERα-regulated intergenic long non-coding RNAs (lncRNAs), we identified nuclear enriched abundant transcript 1 (NEAT1) as the most significantly overexpressed lncRNA in prostate cancer. Analysis of two large clinical cohorts also revealed that NEAT1 expression is associated with prostate cancer progression. Prostate cancer cells expressing high levels of NEAT1 were recalcitrant to androgen or AR antagonists. Finally, we provide evidence that NEAT1 drives oncogenic growth by altering the epigenetic landscape of target gene promoters to favour transcription.


Figures

Figure 1
Figure 1. ERα plays a distinct role in prostate cancer.
(a) ERα is upregulated in prostate cancer compared with matched benign controls. Waterfall plots depict the qRT-PCR expression levels of ERα mRNA in an independent cohort of benign (n=14) and PCa (n=14). (inset A) The expression of ERα in different prostate cancer cell lines was determined by western blotting and compared with MCF7, a breast cancer cell line. (b) Analysis of ERα expression in Oncomine public data sets of normal versus prostate cancer and advanced disease. (c) Invasion of VCaP and VCaP ERα cells analysed 48 h post treatment with vehicle control or E2 (10 nM) in the presence of control or AR-siRNA. Results are expressed as the mean±s.d. of three independent experiments. Student’s t-test was performed for comparisons (% Invasion) between −E2 and +E2 conditions for ERα, ERα-Ctrl siRNA and AR-siRNA, and **P<0.01 were considered statistically significant. (d) Recruitment of endogenous ERα to target gene chromatin was analysed in VCaP cells with or without E2 treatment. Results are expressed as the percentage of input of two independent experiments. Error bars represent the range of data. (e) Computational pipeline for identification of ERα-regulated lncRNAs upregulated in prostate cancer: a schematic overview of the methodology employed to identify ERα-regulated lncRNAs that are differentially expressed between benign versus prostate cancer and prostate cancer versus NEPC. (f) Box plots show expression levels of the top three ERα-regulated lncRNAs from 26 benign and 40 PCa cases, with ideogram depicting their chromosomal position. Waterfall plots depict the qRT-PCR expression levels on an independent cohort of benign (n=14) and PCa (n=14) of the three nominated lncRNAs: NEAT1, NR_024490 and FR349599.
Figure 2
Figure 2. ERα regulated NEAT1 lncRNA is upregulated in prostate cancer.
(a) NEAT1 is overexpressed in various prostate data sets (Oncomine). (b) Distribution of the median expression of all genes (core transcript clusters) on the Human Exon 1.0 ST array in the pooled Mayo Clinic cohort (n=594). NEAT1’s expression ranks in the 99th percentile of all genes on the array. (c) Expression of NEAT1 with/without ERα overexpression and E2 treatment (10 nM) at different time points in a panel of prostate cancer cell lines. Results are expressed as the mean±s.d. of three independent experiments. (d) View of NEAT1 genomic location indicates presence of two ERα-binding sites in the promoter region. Read coverage tracks derived from RNA-sequencing data indicates a higher abundance of NEAT1 transcripts in PCa compared with benign tumours in three representative cases. The figure also reports the ChIP-sequencing coverage tracks for ERα (VCaP ERα, VCaP and input DNA as control). The bottom panel shows the binding sites of ERα, AR (GEO Accession GSM353651-tissue AR (ref. 25)), Ace-H3, H3K4me3 and H3K36me3 in VCaP cell line (GEO Accession GSM353629, GSM353620 and GSM353624 (ref. 25)), respectively. (e) Chromatin immunoprecipitation followed by qPCR to study ERα recruitment to NEAT1 promoter in VCaP cells with/without E2 treatment (10 nM) was performed with primers spanning the binding regions identified by ERα ChIP-seq data. Primers for nonspecific region were used as negative control for ChIP studies. Results are expressed as percentage of input from two independent experiments. Vertical error bars represent the range of data. (f) Luciferase-based promoter reporter assays was used to analyse effect of ERα and/or AR on ERE-Luc promoter in VCaP cells. Cells were transiently transfected with the (ERE)3-SV40-luc reporter plasmid and ERα, or AR-treated with/without E2 or R1881 (1 nM) for 48 h. Results are expressed as the mean±s.d calculated from three independent experiments. (g) Luciferase-based promoter reporter assays were used to analyse NEAT1 promoter activity following ERα expression −/+E2 (10 nM) for 24 h. Results are expressed as the means±s.d. calculated from three independent experiments. Student’s t-test was performed for comparisons where indicated, and *P<0.05 and **P<0.01 were considered statistically significant.
Figure 3
Figure 3. NEAT1 ERα signature correlates with prostate cancer.
(a) Scatter plots for gene expression levels in VCaP ERα compared with VCaP cell lines. (b) Five hundred and eighty-eight genes that are overexpressed in VCaP ERα (log2-fold change >2) were used for Oncomine concept analysis across different cancer data sets (see Methods for detail). (c) qRT–PCR analysis of relative mRNA levels of ERα target genes in VCaP cells with knockout of ERα with and without E2 treatment. The target genes selected for validation are the ones that had the highest log2-fold difference in VCaP and VCaP ERα cell lines. Results are expressed as the mean±s.d. calculated from three independent experiments. Student’s t-test was performed (as indicated) for comparisons between −E2 and +E2 conditions for Ctrl siRNA and ERα-siRNA transfections, and *P<0.05 and **P<0.01 were considered statistically significant. A representative example is shown for ERG target expression. (d) qRT–PCR analysis of ERα target genes in VCaP cells with ERα overexpression and NEAT1 knockout with and without E2 treatment. Results are expressed as the mean±s.d. calculated from three independent experiments. Student’s t-test was performed for comparisons between −E2 and +E2 conditions for scrambled shRNA and NEAT1 shRNA transfections in VCaP and VCaP ERα cells, and *P<0.05 and **P<0.01 were considered statistically significant. A representative example is shown for SPDEF target expression. (e) Network representation of NEAT1 signature, derived from genes overexpressed in VCaP NEAT1 (NEAT1 signature) cells, across different cancer data sets using Oncomine concept analysis.
Figure 4
Figure 4. NEAT1 ERα signature is upregulated in prostate cancer.
(a) Relative mRNA levels of genes nominated from analysis in Fig. 3b,e, analysed using qRT–PCR in parental VCaP cells transfected with scrambled (Sc) and NEAT1 shRNA (N1), respectively, with and without E2 (10 nM) treatment. Results are expressed as the mean±s.d. calculated from three independent experiments. Student’s t-test was performed for comparisons (relative mRNA levels of target gene expression) between −E2 and +E2 conditions for scrambled shRNA and NEAT1 shRNA transfections. A representative example is shown for ADRB1 and PSMA target expression. *P<0.05 and **P<0.01 were considered statistically significant. (b) Validation of expression of the top target NEAT1 ERα signature genes in a small matched patient cohort of 13 benign and 13 PCa, n=26. Results are expressed as the relative mRNA levels tumor/benign from two independent experiments. Error bars represent the range of data. (c) Heatmap shows the Spearman’s correlation results from b.
Figure 5
Figure 5. NEAT1 is a transcriptional regulator.
(a,b) Promoter luciferase reporter assay shows that NEAT1 activates PSMA promoter in PC3 and VCaP cells. Cells were co-transfected with empty vector or PSMA luc and Renilla-luc reporter genes alone or with NEAT1, NEAT1+ERα and NEAT1+AR. Luciferase activity was measured 48 h post treatment with E2 (10 nM) or R1881 (1 nM). Results are expressed as the mean±s.d. calculated from three independent experiments. Student’s t-test was performed for comparisons (relative PSMA–luciferase activity) between −E2 and +E2 conditions for vector control, NEAT1 and NEAT1+ERα transfections in PC3 and VCaP cells. *P<0.05 and **P<0.01 were considered statistically significant. (c) Quantitative analysis of NEAT1 ChIRP in VCaP cells with or without E2 treatment (10 nM). Recruitment profiles of NEAT1 to PSMA are shown. Results are expressed as the percentage of input calculated from two independent experiments. Error bars represent the range of data. Results were reproducible between representative experiments. **P<0.01 was considered statistically significant. (d) Analysis of the chromatin landscape at the PSMA promoter performed by ChIP in VCaP cells alone or transected with NEAT1, ERα, NEAT1 ERα, NEAT1 ERα NEAT1_1 siRNA and NEAT1 ERα NEAT1_2 siRNA with and without E2 treatment. qPCR was performed with specific primers for the PSMA promoter. Results are expressed as the percentage of input calculated from two independent experiments. Error bars represent the range of data. Results were reproducible between representative experiments. (e) NEAT1 binds to Histone H3. 20 mer-biotinylated NEAT1 and NR_024490 antisense probes were used to immunoprecipitate NEAT1 and NR_024490 from nuclear lysates of VCaP cells using streptavidin magnetic beads. Immunoprecipitates from Streptavidin-IP were analysed on 15% gel and probed for Histone H3. NEAT1 is shown to also bind with active histone H3 modifications, including H3AcK9 and H3K4Me3.
Figure 6
Figure 6. NEAT1 is a driver of oncogenic cascade.
(a) Cell proliferation assays were performed in VCaP vector control, NEAT1-overexpressing cells and also in si scrambled and NEAT1 knockout cells with or without E2 treatment (10 nM) at 24 and 48 h time points. Results are expressed as the mean±s.d. calculated from three independent experiments. Student’s t-test was performed for comparisons (relative cell proliferation) between E2 conditions for vector control, NEAT1 Cl-1, and NEAT1 Cl-2 and E2 conditions for si-scrambled, Neat1-shRNA1 and shRNA2 transfections. **P<0.01 was considered statistically significant. (b) Quantitative bar chart for depicting percentage of cells invaded at the completion of invasion assays performed in VCaP vector control, NEAT1-overexpressing cells and also in si scrambled and NEAT1 knockout cells with or without E2 treatment (10 nM). Results are expressed as the mean±s.d. of three independent experiments. *P<0.05 and **P<0.01, Student’s t-test. (c) Soft agar assays were performed with VCaP control and NEAT1-expressing cells. Quantitative bar-plot analysis of stained colonies at 21 days are shown. Results are expressed as the mean±s.d. of three independent experiments. ***P<0.001, Student’s t-test. (d) Colony-forming assay were performed in VCaP vector control, NEAT1-overexpressing cells with or without E2 treatment (10 nM). The right panel depicts the number of colonies at 21 days. Results are expressed as the mean±s.d. calculated from three independent experiments. *P<0.05 and **P<0.01, Student’s t-test. (e) VCaP ERα cells expressing con shRNA luciferase (luc) and NEAT1 shRNA luc were injected subcutaneously into the flank of male NOD-SCID mouse. Bioluminescent imaging on Day 7 and Day 35 in the VCaP ERα scrambled shRNA (top panel) and VCaP ERα NEAT1 shRNA (bottom panel) injected mice is shown. (f) Growth curve for the tumours monitored upto 45 days. Results are expressed as the mean±s.d. calculated from three independent experiments. *P<0.05, Student’s t-test. (g,h) VCaP and NCI-H660 vector control and NEAT1-overexpressing cells were injected subcutaneously into the flank of male NOD-SCID mouse. Bioluminescence imaging monitored the tumour growth. Growth curve for the tumours monitored upto 45 days is shown; VCaP (g) and NCI-H660 (h).
Figure 7
Figure 7. NEAT1 in therapy resistance.
(a) NEAT1 expression in VCaP cells treated with E2 (10 nM) at different time points alone, E2+ICI (10 nM+10 μM) or ICI (10 μM) alone. Results are expressed as the mean±s.d. of three independent experiments. *P<0.05, **P<0.01, Student’s t-test. (b) NEAT1 expression in VCaP cells treated with E2, E2+4OHT (10 nM+10 nM) and 4OHT (10 nM) alone for 48 h. (c) NEAT1 expression in VCaP cells treated with or without E2 (10 nM) or E2+Enzalutamide (10 nM+10 μM) at different time points. Results are expressed as the mean±s.d. of three independent experiments. *P<0.05 and **P<0.01, Student’s t-test. (d) qRT–PCR analysis of NEAT1, GJB1 and TRPM8 in LnCaP and VCaP control cells, with bicalutamide treatment (10 μM) alone or in combination with E2 (10 nM) for 48 h. Results are expressed as the means±s.d. of three independent experiments. Results were reproducible between representative experiments. (e) Representative image for RNA ISH of NEAT1 in benign, localized PCa and in advanced disease (top panel). Quantification for the RNA ISH signals shown in the bottom using RNA Spot Studio. (f) Scatter plot showing the correlation between ERα and NEAT1 expression by qRT-PCR in nine cases of benign prostate, seven PCa and seven CRPC. Pearson’s correlation coefficient R=0.86 (P-value=1.9e−07).
Figure 8
Figure 8. NEAT1 overexpression is associated with aggressive prostate cancer.
(a,b) KM curves showing (a) BCR-free survival and (b) MET-free survival for NEAT1 low and high expression groups of samples from the Mayo case–cohort data set (n=216). The cut points to define high and low NEAT1 expression were selected using patients from the Mayo nested case–control data set (n=378) by maximizing the product of the sensitivity and specificity for each endpoint. The number of patients at risk for each group is shown beneath the plot.
Figure 9
Figure 9. NEAT1 is a strong prognosticator of prostate cancer.
(ad) Univariable forest plots comparing the expression of NEAT1’s short (NEAT1_1) and long isoform (NEAT1_2) to clinicopathologic variables in the pooled Mayo cohort (n=594) (a) BCR, (b) MET, (c) PCSM and (d) GS>7. Pathological tumour stage 3 or greater (pT3+), lymph node invasion (LNI), surgical margin status (SMS) positive, seminal vesicle invasion (SVI), extra capsular extension (ECE), preoperative PSA (pPSA), adjuvant hormone therapy and adjuvant radiation therapy are shown.
Figure 10
Figure 10. Model for NEAT1 function in prostate cancer.
Functional ERα signalling in prostate cancer modulates expression of the lncRNA NEAT1. Prostate epithelial cells positive for NEAT1 have an oncogenic advantage and are refractile to androgen inhibitors or androgen ablation therapy. NEAT1, a histone interacting lncRNA and transcriptional regulator, is recruited to promoters of several prostate cancer-specific genes. NEAT1 can modulate the epigenetic landscape of target promoters and maintains expression of AR-dependent and -independent genes. The selection of alternate nuclear receptor signalling is a novel hallmark of prostate cancer progression.

References

    1. Heinlein C. A. & Chang C. Androgen receptor in prostate cancer. Endocr. Rev. 25, 276–308 (2004). - PubMed
    1. de Bono J. S. et al. Abiraterone and increased survival in metastatic prostate cancer. New Engl. J. Med. 364, 1995–2005 (2011). - PMC - PubMed
    1. Scher H. I. et al. Increased survival with enzalutamide in prostate cancer after chemotherapy. New Engl. J. Med. 367, 1187–1197 (2012). - PubMed
    1. Ricke W. A. et al. Prostatic hormonal carcinogenesis is mediated by in situ estrogen production and estrogen receptor alpha signaling. FASEB J. 22, 1512–1520 (2008). - PubMed
    1. Clemson C. M. et al. An architectural role for a nuclear noncoding RNA: NEAT1 RNA is essential for the structure of paraspeckles. Mol. Cell 33, 717–726 (2009). - PMC - PubMed

Publication types

Associated data