. 2014 Nov 21;9(11):e112945.
doi: 10.1371/journal.pone.0112945. eCollection 2014.

Involvement of the kynurenine pathway in human glioma pathophysiology

Affiliations

Involvement of the kynurenine pathway in human glioma pathophysiology

Seray Adams et al. PLoS One. .

Abstract

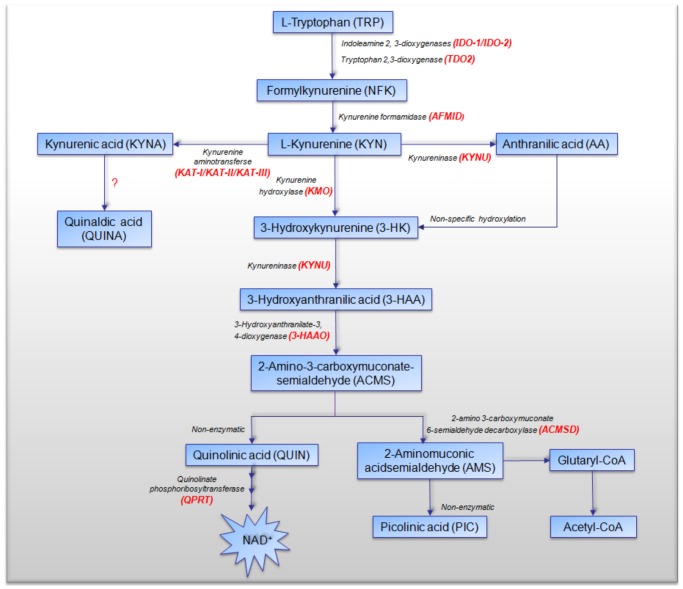
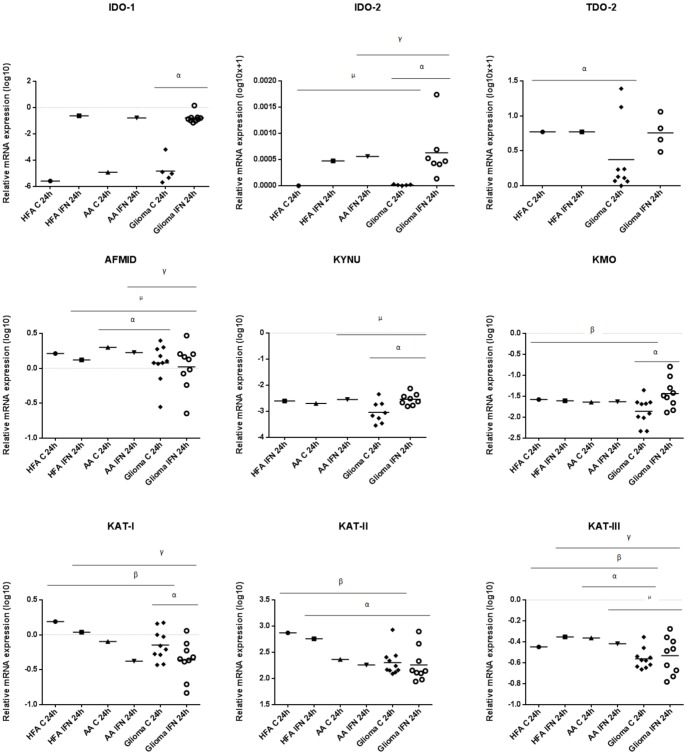
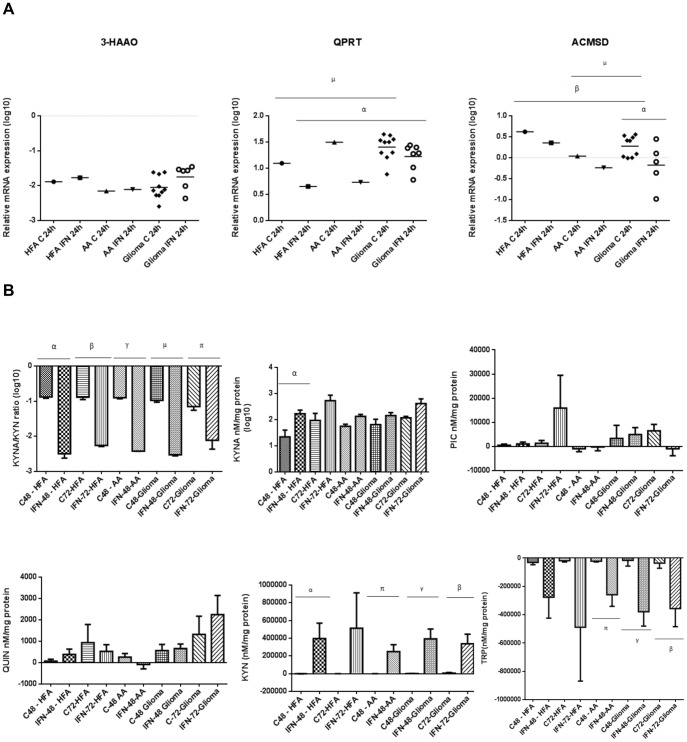
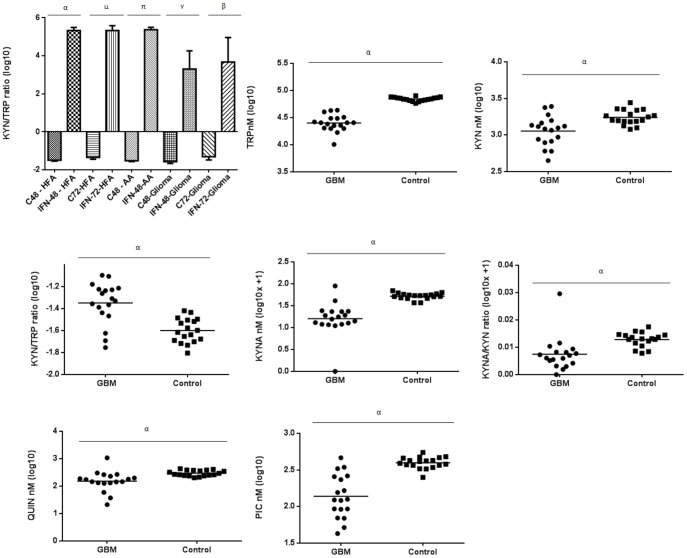
The kynurenine pathway (KP) is the principal route of L-tryptophan (TRP) catabolism leading to the production of kynurenine (KYN), the neuroprotectants, kynurenic acid (KYNA) and picolinic acid (PIC), the excitotoxin, quinolinic acid (QUIN) and the essential pyridine nucleotide, nicotinamide adenine dinucleotide (NAD(+)). The enzymes indoleamine 2,3-dioxygenase-1 (IDO-1), indoleamine 2,3-dioxygenase-2 (IDO-2) and tryptophan 2,3-dioxygenase (TDO-2) initiate the first step of the KP. IDO-1 and TDO-2 induction in tumors are crucial mechanisms implicated to play pivotal roles in suppressing anti-tumor immunity. Here, we report the first comprehensive characterisation of the KP in 1) cultured human glioma cells and 2) plasma from patients with glioblastoma (GBM). Our data revealed that interferon-gamma (IFN-γ) stimulation significantly potentiated the expression of the KP enzymes, IDO-1 IDO-2, kynureninase (KYNU), kynurenine hydroxylase (KMO) and significantly down-regulated 2-amino-3-carboxymuconate semialdehyde decarboxylase (ACMSD) and kynurenine aminotransferase-I (KAT-I) expression in cultured human glioma cells. This significantly increased KP activity but significantly lowered the KYNA/KYN neuroprotective ratio in human cultured glioma cells. KP activation (KYN/TRP) was significantly higher, whereas the concentrations of the neuroreactive KP metabolites TRP, KYNA, QUIN and PIC and the KYNA/KYN ratio were significantly lower in GBM patient plasma (n = 18) compared to controls. These results provide further evidence for the involvement of the KP in glioma pathophysiology and highlight a potential role of KP products as novel and highly attractive therapeutic targets to evaluate for the treatment of brain tumors, aimed at restoring anti-tumor immunity and reducing the capacity for malignant cells to produce NAD(+), which is necessary for energy production and DNA repair.


Conflict of interest statement

Competing Interests: The authors have declared that no competing interests exist.

Figures

Figure 1
Figure 1. Schematic diagram of tryptophan catabolism along the KP (adapted from [60]).
The kynurenine pathway (KP) is a major degradative pathway of TRP that ultimately leads to production of NAD+.
Figure 2
Figure 2. Phase contrast microscopy images of HFA and brain tumor cells and immunofluorescence images of cultured primary brain tumor cells, AA and HFA.
HFA were derived from three different foetal brains. (A) 18-week foetus (10× magnification); (B) 19-week foetus, first week in culture (10× magnification); (C) 19-week foetus, day 5 in culture (20× magnification); (D) Primary GBM after 2 trypsinisations (20x); (E) Recurrent GBM (20x); (F) Secondary GBM after 3 trypsinisations (10x); (G) OII 14 days in culture (10x); (H) AII 13 days in culture (10x); (I) Negative control for NGS merged with DAPI; (J) Negative control for secondary antibodies merged with DAPI; (K) GBM cells derived from one patient – GFAP (DAKO) merged with DAPI and CD68 (zoomed: 2.4× magnification); (L) primary brain tumor cells from one patient (male, 40 years old) (passaged three times) - GFAP (Novocastra) merged with DAPI; (K and L) GFAP (green) was used as a GBM marker and CD68 (red) was used as a marker for microglia. (M) AA from one Female, 61 years old; (passaged twice) - GFAP (Novocastra) merged with DAPI; (N) AA from one male 40 years old; (passaged once) - GFAP (Sigma) merged with DAPI and CD68 (Abcam); (M and N) GFAP (green) was used as an astrocyte marker and CD68 (red) and CD11b (green) were used as markers for microglia; (O) HFA from one 17-week- old foetus (passaged once) - GFAP (Novocastra) merged with DAPI and CD11b (Novus); (P) HFA from an 18-week- old foetus (passaged once) - GFAP (DAKO) merged with DAPI and CD68 (zoomed: 2.1× magnification); (O and P) GFAP (green and red) was used as an astrocyte marker and CD68 (red) and CD11b (green) were used as markers for microglia. Nuclei indicated by DAPI (blue) in all images.
Figure 3
Figure 3. Relative mRNA expression of KP enzymes in HFA and AA versus glioma using qRT-PCR.
The graphs indicate the relative mRNA expression normalised to HPRT mRNA expression. All cell cultures were untreated (C) and treated with IFN-γ (IFN) for 24 hours. Graphs indicate Log10 and Log10 (x+1) of the quantified values. IDO-1 expression in stimulated glioma cells (n = 9) compared to unstimulated (n = 5) (αp<0.0001). IDO-2 expression in stimulated glioma cells (n = 7) compared to unstimulated (n = 5) (αp<0.05); IDO-2 expression in unstimulated glioma cells compared to unstimulated HFA (µp<0.05); IDO-2 expression in stimulated glioma cells compared to stimulated AA (γp<0.05). TDO-2 expression in unstimulated glioma cells (n = 9) compared to unstimulated HFA (αp<0.05). AFMID expression in unstimulated glioma cells (n = 10) compared to unstimulated AA (αp<0.05); AFMID expression in stimulated glioma cells (n = 9) compared to stimulated AA cells (γp<0.05); AFMID expression in stimulated glioma cells compared to stimulated HFA (µp<0.05). KYNU expression in stimulated glioma compared to unstimulated (n = 8) (αp<0.01); KYNU expression in stimulated glioma cells (n = 8) compared to stimulated AA cells (µp<0.01). KMO expression in stimulated glioma (n = 9) compared to unstimulated (n = 10) (αp = 0.007); KMO expression in unstimulated glioma cells compared to unstimulated HFA cells (βp<0.05). KAT-I expression in stimulated glioma cells (n = 9) compared to unstimulated (n = 10) (αp<0.05); KAT-I expression in unstimulated and stimulated glioma cells compared to unstimulated and stimulated HFA cells, respectively (βγp<0.01). KAT-II expression in unstimulated glioma cells (n = 10) compared to unstimulated HFA (βp<0.0001); KAT-II expression in stimulated glioma cells (n = 9) compared to stimulated HFA cells (αp = 0.001). KAT-III expression in unstimulated glioma cells (n = 10) compared to unstimulated HFA (βp = 0.0042); KAT-III expression in unstimulated glioma cells compared to unstimulated AA cells (αp<0.0001); KAT-III expression in stimulated glioma cells (n = 9) compared to stimulated HFA cells (γp = 0.0013); KAT-III expression in stimulated glioma cells compared to stimulated AA cells (µp<0.05).
Figure 4
Figure 4. Relative mRNA expression of KP enzymes in HFA and AA versus glioma using qRT-PCR and analysis of the KYNA/KYN ratio and KYNA, PIC, QUIN, KYN and TRP concentrations in the cell culture supernatants of glioma, HFA and AA cells.
(A) The dot plots indicate the relative mRNA expression normalised to HPRT mRNA expression; All cell cultures were untreated (C) and treated with IFN-γ (IFN) for 24 hours; Graphs indicate Log10 of the quantified values. No statistical significance was observed for 3-HAAO expression; QPRT expression in unstimulated glioma (n = 10) compared to unstimulated HFA cells (µp = 0.0024); QPRT expression in stimulated glioma cells (n = 7) compared to stimulated HFA cells (αp = 0.0015). ACMSD expression in stimulated glioma cells (n = 5) compared to unstimulated (αp<0.05); ACMSD expression in unstimulated glioma cells (n = 9) compared to unstimulated HFA cells (βp = 0.0029); ACMSD expression in unstimulated glioma cells compared to unstimulated AA (µp<0.05). (B) Glioma cell cultures for the KYNA/KYN ratio and KYNA concentrations were untreated (n = 7) and treated with IFN-γ (n = 6) for 48 hours and untreated (n = 6) and treated with IFN-γ for 72 hours (n = 6); HFA cell cultures for the analysis of the KYNA/KYN ratio and KYNA concentrations were untreated (n = 8) and treated with IFN-γ (n = 8) for 48 hours and untreated (n = 5) and treated with IFN-γ for 72 hours (n = 5); All AA cell cultures were untreated (n = 3) and treated with IFN-γ (n = 3) for 48 hours; Bar graphs for the KYNA/KYN ratio and KYNA concentrations indicate Log10 of the quantified values; The KYNA/KYN ratio in glioma, HFA and AA cell cultures after 48 and 72 hours of IFN-γ stimulation compared to untreated cultures (αβγµπp<0.001); KYNA concentrations in HFA cell cultures when treated with IFN-γ for 48 hours compared to when untreated after 48 hours (αp<0.05); Glioma cell cultures for the analysis of QUIN and PIC concentrations were untreated (n = 7) and treated with IFN-γ (n = 6) for 48 hours and untreated (n = 5) and treated with IFN-γ for 72 hours (n = 5); HFA cell cultures for the analysis of QUIN and PIC concentrations were untreated (n = 10) and treated with IFN-γ (n = 9) for 48 hours and untreated (n = 5) and treated with IFN-γ for 72 hours (n = 5); No statistical significance was observed for QUIN and PIC; Glioma cell cultures for the analysis of KYN and TRP concentrations were untreated (n = 7) and treated with IFN-γ (n = 6) for 48 hours and untreated (n = 6) and treated with IFN-γ for 72 hours (n = 5); HFA cell cultures for the analysis of KYN and TRP concentrations were untreated (n = 9) and treated with IFN-γ (n = 9) for 48 hours and untreated (n = 5) and treated with IFN-γ for 72 hours (n = 5); KYN production in glioma cell cultures after 48 and 72 hours of IFN-γ stimulation compared to untreated cultures after 48 and 72 hours (γβp<0.01); KYN production in HFA cell cultures after 48 hours of IFN-γ stimulation compared to untreated cultures after 48 hours (αp<0.05); KYN production in AA after 48 hours of IFN-γ stimulation compared to the untreated cultures (πp<0.05); TRP catabolism in AA cell culture supernatant after 48 hours of IFN-γ stimulation compared to untreated cultures after 48 hours (πp<0.05); TRP catabolism in glioma cell culture supernatant after 48 and 72 hours of IFN-γ stimulation compared to untreated cultures after 48 hours (γβp<0.05). No other statistical significance was observed.
Figure 5
Figure 5. Analysis of the KYN/TRP ratio for IDO activity in culture supernatants of HFA, AA and glioma determined by HPLC and analysis of plasma Tryptophan (TRP), Kynurenine (KYN), Quinolinic acid (QUIN), Picolinic acid (PIC) and Kynurenic acid (KYNA) concentrations and the Kynurenine (KYN)/Tryptophan (TRP) and KYNA/KYN ratios from normal healthy controls (n = 18) versus GBM patients (n = 18).
The graph and dot plots indicate Log10 of the quantified values unless otherwise shown. Glioma cell cultures were untreated (n = 7) and treated with IFN-γ (n = 6) for 48 hours and untreated (n = 6) and treated (n = 6) with IFN-γ for 72 hours. HFA cell cultures were untreated (n = 10) and treated with IFN-γ (n = 9) for 48 hours and untreated (n = 5) and treated with IFN-γ for 72 hours (n = 5). AA cell cultures were untreated (n = 3) and treated with IFN-γ (n = 3) for 48 hours. IDO activity in HFA cell cultures after 48 and 72 hours of IFN-γ stimulation compared to untreated cultures (αµp<0.001). IDO activity in AA cell cultures after 48 hours of IFN-γ stimulation compared to untreated cultures (πp<0.001). IDO activity in gliomas after 48 and 72 hours of IFN-γ stimulation compared to untreated cultures (γβp<0.05). No other statistical significance was observed. The GBM plasma samples consisted of: recurrent GBM (n = 9), secondary GBM (n = 5), primary GBM (n = 1), PNET GBM (n = 2) and unclassified GBM (n = 1). Each dot represents data derived from 1 sample. Horizontal line in each group designates the mean value. TRP concentrations in GBM patients compared to that of the control group (αp<0.0001). KYN concentrations in GBM compared to Control (αp = 0.0005). The KYN/TRP ratio for IDO activity in GBM compared to Control (αp<0.0001). KYNA concentrations in GBM patients compared to that of the control group (αp<0.0001). KYNA/KYN ratio in GBM compared to the control group (αp = 0.001). The GBM plasma samples analysed for QUIN and PIC concentrations consisted of: recurrent GBM (n = 7), secondary GBM (n = 3), PNET GBM (n = 2) and unclassified GBM (n = 1). QUIN concentrations in GBM compared to controls (αp = 0.0014). PIC concentrations in GBM compared to the control group (αp<0.0001).

References

    1. Sreekanthreddy P, Srinivasan H, Kumar DM, Nijaguna MB, Sridevi S, et al. Identification of Potential Serum Biomarkers of Glioblastoma: Serum Osteopontin Levels Correlate with Poor Prognosis. Cancer Epidemiology Biomarkers & Prevention. 2010;19:1409–1422. - PubMed
    1. DeAngelis LM. Medical progress: Brain tumors. New England Journal of Medicine. 2001;344:114–123. - PubMed
    1. Stupp R, Mason WP, van den Bent MJ, Weller M, Fisher B, et al. Radiotherapy plus concomitant and adjuvant temozolomide for glioblastoma. New England Journal of Medicine. 2005;352:987–996. - PubMed
    1. McLendon RE, Halperin EC. Is the long-term survival of patients with intracranial glioblastoma multiforme overstated? Cancer. 2003;98:1745–1748. - PubMed
    1. Phillips RS. Structure, mechanism, and substrate specificity of kynureninase. Biochimica Et Biophysica Acta-Proteins and Proteomics. 2011;1814:1481–1488. - PMC - PubMed

Publication types

MeSH terms