. 2015 Jan;125(1):141-56.
doi: 10.1172/JCI75852. Epub 2014 Nov 21.

Anti-microRNA-21 oligonucleotides prevent Alport nephropathy progression by stimulating metabolic pathways

Anti-microRNA-21 oligonucleotides prevent Alport nephropathy progression by stimulating metabolic pathways

Ivan G Gomez et al. J Clin Invest. 2015 Jan.

Abstract

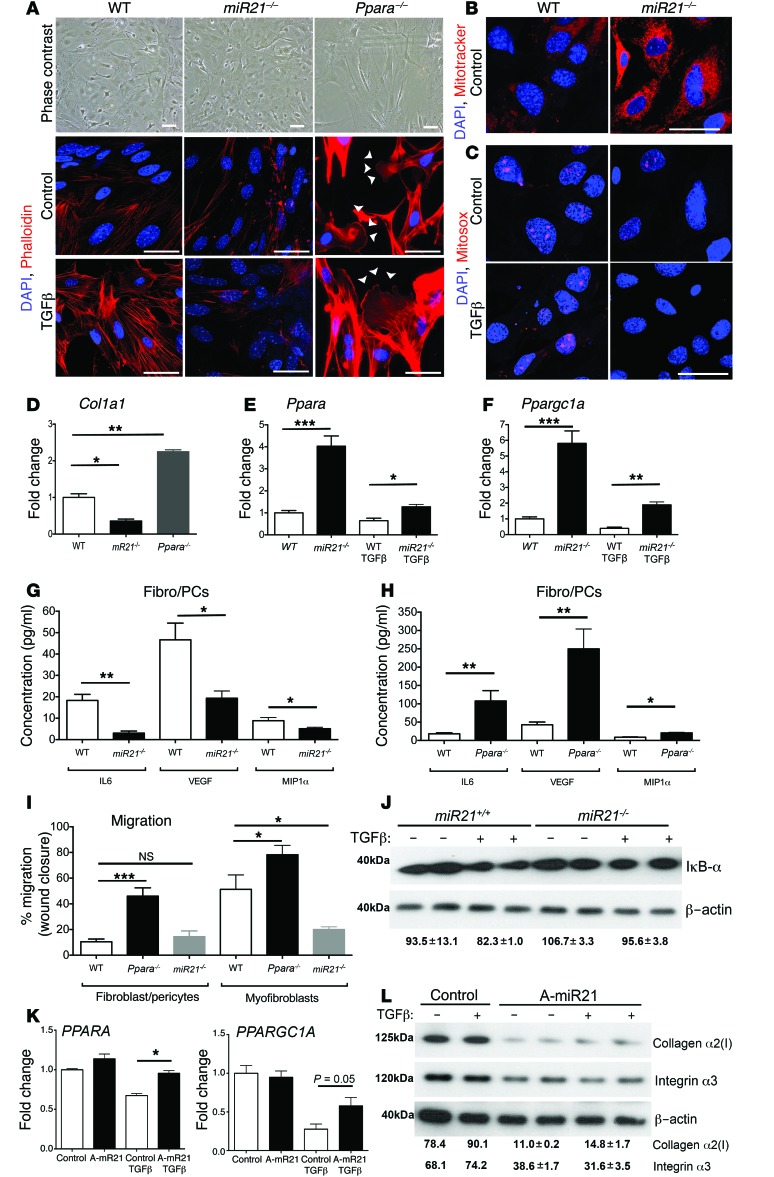
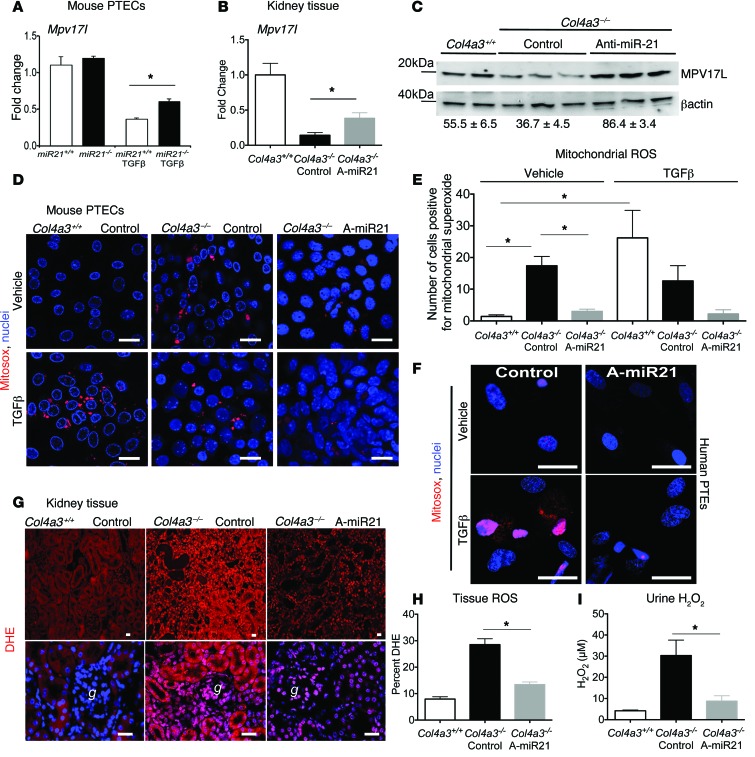
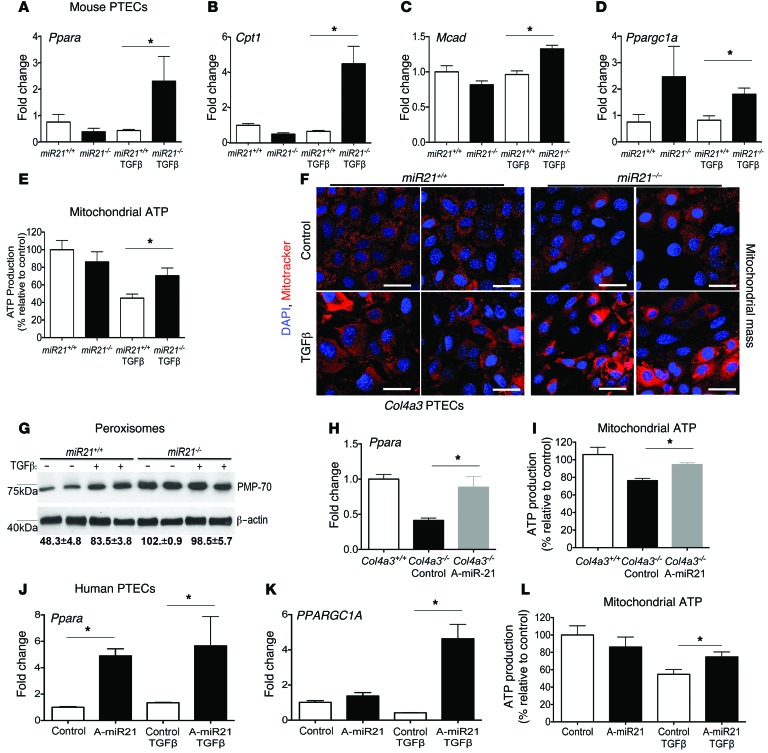
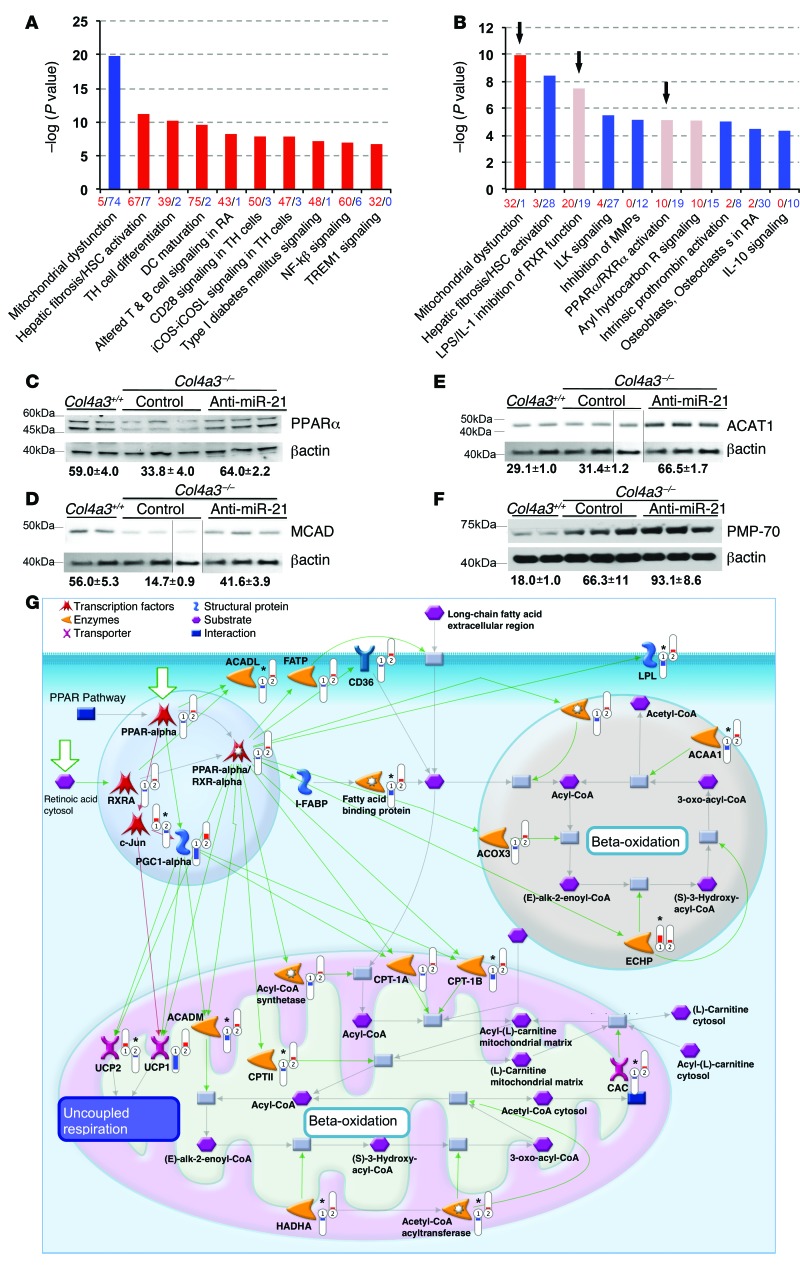
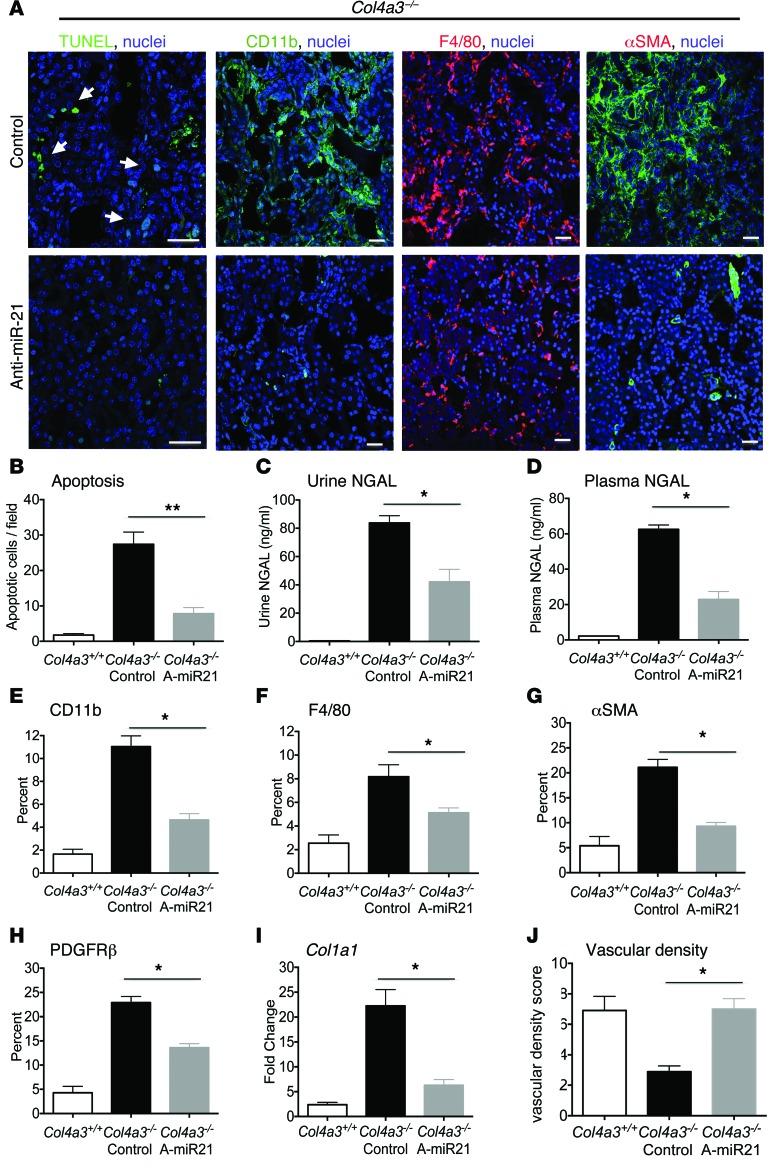
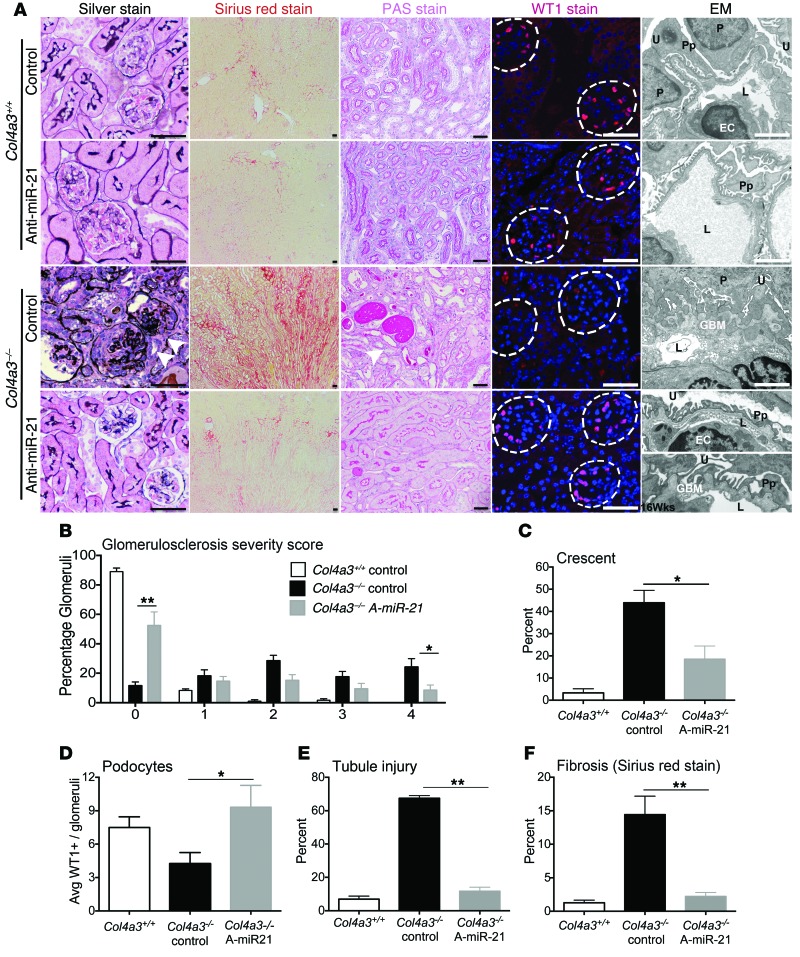
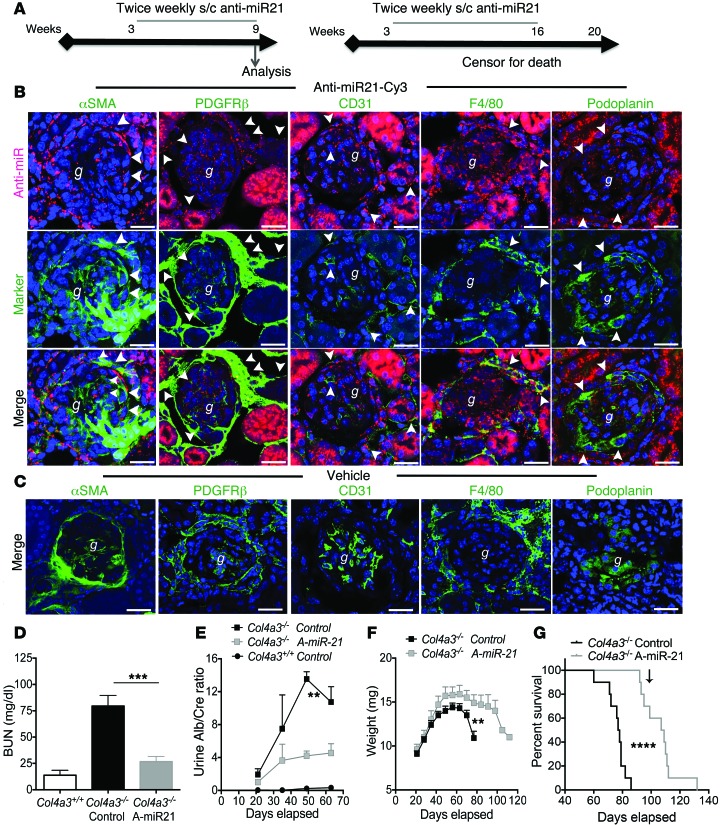
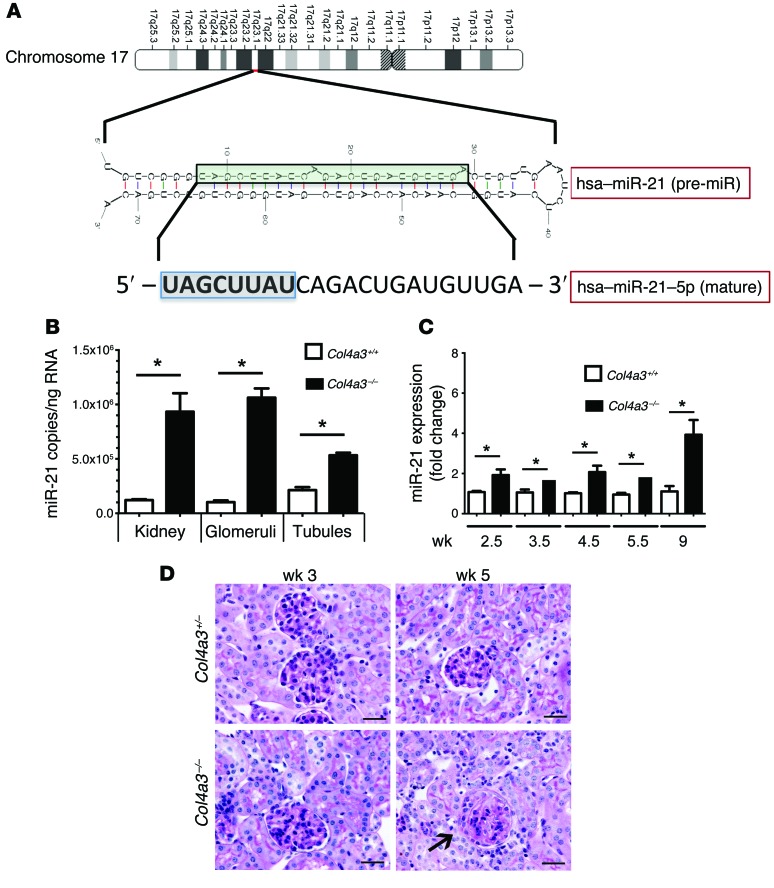
MicroRNA-21 (miR-21) contributes to the pathogenesis of fibrogenic diseases in multiple organs, including the kidneys, potentially by silencing metabolic pathways that are critical for cellular ATP generation, ROS production, and inflammatory signaling. Here, we developed highly specific oligonucleotides that distribute to the kidney and inhibit miR-21 function when administered subcutaneously and evaluated the therapeutic potential of these anti-miR-21 oligonucleotides in chronic kidney disease. In a murine model of Alport nephropathy, miR-21 silencing did not produce any adverse effects and resulted in substantially milder kidney disease, with minimal albuminuria and dysfunction, compared with vehicle-treated mice. miR-21 silencing dramatically improved survival of Alport mice and reduced histological end points, including glomerulosclerosis, interstitial fibrosis, tubular injury, and inflammation. Anti-miR-21 enhanced PPARα/retinoid X receptor (PPARα/RXR) activity and downstream signaling pathways in glomerular, tubular, and interstitial cells. Moreover, miR-21 silencing enhanced mitochondrial function, which reduced mitochondrial ROS production and thus preserved tubular functions. Inhibition of miR-21 was protective against TGF-β-induced fibrogenesis and inflammation in glomerular and interstitial cells, likely as the result of enhanced PPARα/RXR activity and improved mitochondrial function. Together, these results demonstrate that inhibition of miR-21 represents a potential therapeutic strategy for chronic kidney diseases including Alport nephropathy.


Figures

Figure 8
Figure 8. miR-21 activity regulates fibroblast/PC activation directly.
(A) Phase contrast or phalloidin-stained images of primary mouse kidney fibroblast (fibro/PC) cultures showing morphology and stress=fiber formation in control or TGF-β–activated conditions. Note that miR21–/– fibro/PCs have fewer stress fibers in both conditions, whereas Ppara–/– fibro/PCs have elongated morphology and increased lamellipodia formation (arrowheads). (B) Images showing mitochondrial density in miR21–/– fibro/PCs compared with WT fibro/PCs, detected by MitoTracker. (C) Images showing mitochondrial ROS generation in WT fibro/PCs in control or TGF-β–activated conditions compared with miR21–/– fibro/PCs. (D) Col1a1 transcript levels in primary fibro/PC cultures from mutant mouse kidneys or strain-matched control (WT). (E and F) Graphs showing expression of Ppara and Ppargc1a in mouse fibro/PCs in control or TGF-β–activated conditions. (G and H) Cytokines and growth factor secretion by fibro/PCs from (G) WT or miR21–/– kidneys or (H) WT or Ppara–/– kidneys. (I) Migration of WT, miR21–/–, Ppara–/– fibro/PCs and myofibroblasts in a wound-healing assay in control conditions. Note that miR21–/– cells are hypomigratory. (J) Western blot showing levels of the Ppar gene target IκB-α at rest and in response to TGF-β. (K) Graphs showing the effect of anti–miR-21 on transcript levels in human fibro/PCs in control or TGF-β–stimulated conditions. (L) Western blots showing effect of anti–miR-21 on human fibro/PC expression of C-JUN target genes: collagen I protein (60 kDa) and integrin-α3 (130 kDa), in control or TGF-β–stimulated conditions. Numbers indicate relative normalized band density. *P < 0.05; **P < 0.01; ***P < 0.001, 1-way ANOVA or Mann-Whitney U test. n = 3–5/group. Scale bars: 25 μm.
Figure 7
Figure 7. Anti–miR-21 inhibits mitochondrial ROS generation in the kidney.
(A) Graph showing the effect of miR21 gene deficiency on levels of the epithelial mitochondrial antioxidant protein and anti–miR-21 target Mpv17-like in mouse PTECs in response to TGF-β. (B and C) (B) qPCR and (C) Western blot of MPV17L in kidney tissue at 9 weeks. Numbers indicate relative normalized band density (same experiment as in Figure 5C). (D and E) Images (D) and quantification (E) of mitochondrial ROS generation from primary PTEC cultures purified from 7-week-old Col4a3–/– mice treated with vehicle or anti–miR-21 in vivo. (F) Images showing the effect of TGF-β–induced mitochondrial ROS in human primary PTECs in the setting of pretreatment in vitro with anti–miR-21. (G and H) Images (G) and quantification (H) of DHE fluorescence indicative of ROS generation in kidney whole-tissue sections from Col4a3–/– at 9 weeks. (I) Quantification of urinary hydrogen peroxide in timed urine collections at 9 weeks. *P < 0.05, 1-way ANOVA or Mann-Whitney U test. n = 3–12/group. Scale bars: 25 μm.
Figure 6
Figure 6. Anti–miR-21 administration recapitulates miR-21 gene deficiency by preventing miR-21–mediated suppression of the PPARα FA metabolism and mitochondrial biogenesis pathways in the kidney proximal epithelium.
(AC) Graphs of qPCR results showing the effect of miR-21 gene deficiency on PPARα lipid metabolism pathway transcriptional responses (Ppara, Cpt1, and Mcad) in primary cultured mouse PTECs in resting conditions or in response to active TGF-β–induced cell stress. (D) Graph of Ppargc1a levels in steady-state and response to TGF-β stress in miR21-deficient PTECs. (E) Graph of the effect of TGF-β on mitochondrial ATP generation by mouse PTECs in the absence of miR21. (F) Representative images of MitoTracker-labeled PTECs showing increased mitochondrial density in miR21-deficient PTECs, particularly in response to TGF-β stress. (G) Western blot showing levels of the peroxisome protein PMP70 in mouse PTECs at rest and in response to TGF-β stress. (HI) The effect of anti–miR-21 treatment of mouse PTECs from Col4a3–/– mouse kidneys on Ppara expression and mitochondrial ATP generation (JL) Graphs showing the effect of anti–miR-21 treatment on human primary PTEC levels of PPARA or PPARGC1A or mitochondrial ATP production under resting or TGF-β stress conditions. *P < 0.05; **P < 0.01, Mann-Whitney U test. n = 3–5/group. Scale bars: 25 μm.
Figure 5
Figure 5. Global transcriptome sequencing of kidneys from Col4a3–/– mice provides unbiased insight into Alport nephropathy and the actions of anti–miR-21.
(A) Pathways analysis of Col4a3+/+ compared with Col4a3–/– kidneys at 9 weeks showing the most significantly regulated gene ontology pathways, where red denotes upregulated and blue denotes downregulated genes. Height of the bar reflects statistical enrichment (–log10 P value) for the pathways, while x axis reflects the total number of regulated genes in each pathway. (B) Pathways analysis of Col4a3–/– kidneys at 9 weeks treated with vehicle compared with 5.5 weeks of anti–miR-21 treatment, where red denotes upregulated and blue downregulated genes. Note that mitochondrial function genes are derepressed and PPARα signaling is derepressed as identified in 2 pathways (LPS/IL-1 inhibition of RXR function and PPARα/RXRα function) (arrows). (CF) Western blots at 9 weeks demonstrating the effect of disease and anti–miR-21 on whole kidney levels of PPARα, MCAD, ACAT1, and peroxisomal PMP-70. Normalized densitometry is shown (AU). (D and E) Blots were obtained from the same experiment. Actin blots were derived from parallel samples run on a separate gel, and lines indicate splicing of blots). (G) Schematic showing the effect of disease (no. 1) and anti–miR-21 treatment (no. 2) on PPARα/RXRα-regulated pathways in the nucleus (blue), peroxisome (brown), and mitochondrion (pink) at week 9. PPARα and PGC1α as transcriptionally regulated genes as well as transcription factors are shown regulating downstream genes by green connectors. PPARα target and interactor genes are significantly (*) enhanced (red thermometers) by anti–miR-21 treatment including FABP, ACAA1, CPT, ACADL, whereas PPARα-mediated transcriptional suppression of cJUN is also observed. Analysis performed using Bioconductor LIMMA program. n = 3/group.
Figure 4
Figure 4. Tubular injury and myofibroblast and leukocyte expansion are all attenuated by anti–miR-21.
(A) Images of apoptotic tubular epithelial cells (arrows), macrophages, and myofibroblasts. (BD) Quantification of tubular apoptosis and the tubular injury marker NGAL in urine and plasma at 9 weeks. (EH) Quantification of kidney macrophages (CD11b, F4/80), fibroblasts/PCs (PDGFRβ), and myofibroblasts (αSMA) at 9 weeks. (I) qPCR for fibrogenic transcripts. (J) Quantification of peritubular capillary density. *P < 0.05; **P < 0.01, Mann-Whitney U test. n = 12/group. Scale bars: 50 μm.
Figure 3
Figure 3. Anti–miR-21 prevents glomerulosclerosis tubular atrophy and interstitial fibrosis.
(A) Silver methenamine–stained images highlighting glomerulosclerosis (arrowheads); Sirius red–stained images of whole kidney showing interstitial fibrosis; PAS-stained images showing tubule injury; WT-1 immunofluorescence showing podocytes within glomeruli (dotted lines), all at 9 weeks. EM images of glomerular capillary loops that show severe basement membrane thickening, duplication, and podocyte effacement in vehicle-treated Col4a3–/– compared with anti–miR-21–treated Col4a3–/– mice at 9 weeks, which show preserved basement membrane in many glomeruli, with minimal foot-process effacement. At 16 weeks (lowest panel), the GBM in anti–miR-21–treated mice shows small but classical basement membrane humps, whereas foot processes remain partially preserved. U, urinary space; P, podocyte; Pp, podocyte processes; L, capillary lumen; EC, endothelial cell. Scale bars: 100 μm (conventional); 500 nm (EM). (B) Graph of percentage of glomeruli with glomerulosclerosis at 9 weeks, scored from 0 to 4 by extent of sclerosis, where 0 is without sclerosis. (C) Graph showing percentage of glomeruli with glomerular epithelial cell hyperplasia (known as crescent). (D) Podocyte number per glomerular cross section. (E) Tubule injury score. (F) Morphometry of interstitial fibrosis. *P < 0.05; **P < 0.01, 1-way ANOVA or Mann-Whitney U test. n = 12/group.
Figure 2
Figure 2. Anti–miR-21 is widely distributed to kidney cells, increases life span, and protects Col4a3–/– mice from kidney disease progression.
(A) Experimental schema indicating anti–miR-21 delivery from 3.5 weeks after birth and analysis at 63 days (9 weeks) or continued to 110 days (16 weeks). (B) Split panel confocal images of kidney cortex showing distribution of a single s.c. injection of Cy3-conjugated anti–miR-21 oligos (red) or vehicle 48 hours previously in 8-week-old Col4a3–/– mice. Sections were colabeled with antibodies against specific cellular markers of myofibroblasts, fibroblasts/pericytes and mesangial cells, endothelium, or podocytes to highlight uptake in particular cell types (arrowheads). Scale bars: 50 μm. g, glomerulus. (C) Confocal images showing vehicle control. Scale bars: 50 μm. (D) Graph of plasma BUN levels at 9 weeks. A-miR-21, anti–miR-21. (E) Graph of time course of urine albumin concentration normalized to urine creatinine. (F) Curves showing body weight changes with time. (G) Kaplan-Meier survival curve. Arrow indicates last delivery of anti–miR-21. **P < 0.01; ***P < 0.001; ****P < 0.0001, Gehan-Breslow-Wilcoxon test for survival; 1-way ANOVA or Mann-Whitney U test for others. n = 12/group.
Figure 1
Figure 1. miR-21 upregulation in Alport nephropathy precedes histological changes in the kidney.
(A) Schema showing the sequence and configuration of human (hsa) pre–miR-21, the processed mature miR-21. The domain that binds to 3′ UTR regions of translated mRNA by sequence complementarity is highlighted. (B) Quantitative reverse-transcriptase PCR (qRT-PCR) for miR-21 copy number in tubules and glomeruli of Col4a3–/– kidneys purified by laser-capture microdissection. (C) qPCR levels for miR-21 in whole kidney from Col4a3–/– mice compared with heterozygotes. (D) PAS-stained images of kidney cortex from Col4a3–/– mice or heterozygotes showing essentially normal histology at 3 weeks and rare segmental sclerosis of glomeruli (arrow) at 5 weeks. The tubules appear normal. Scale bars: 50 μm. n = 3–6/group. *P < 0.05, 1-way ANOVA or Mann-Whitney U test)

References

    1. Godwin JG, Ge X, Stephan K, Jurisch A, Tullius SG, Iacomini J. Identification of a microRNA signature of renal ischemia reperfusion injury. Proc Natl Acad Sci USA. 2010;107(32):14339–14344. doi: 10.1073/pnas.0912701107. - DOI - PMC - PubMed
    1. Kato M, Natarajan R. MicroRNA circuits in transforming growth factor-β actions and diabetic nephropathy. Semin Nephrol. 2012;32(3):253–260. doi: 10.1016/j.semnephrol.2012.04.004. - DOI - PMC - PubMed
    1. Thum T, et al. MicroRNA-21 contributes to myocardial disease by stimulating MAP kinase signalling in fibroblasts. Nature. 2008;456(7224):980–984. doi: 10.1038/nature07511. - DOI - PubMed
    1. Chau BN, et al. MicroRNA-21 promotes fibrosis of the kidney by silencing metabolic pathways. Sci Transl Med. 2012;4(121):121ra18. - PMC - PubMed
    1. Friedman SL, Sheppard D, Duffield JS, Violette S. Therapy for fibrotic diseases: nearing the starting line. Sci Transl Med. 2013;5(167):167sr1. - PubMed

Publication types

MeSH terms

Associated data

LinkOut - more resources