. 2015 Jan;125(1):157-68.
doi: 10.1172/JCI75876. Epub 2014 Nov 21.

Survivin-specific T cell receptor targets tumor but not T cells

Survivin-specific T cell receptor targets tumor but not T cells

Caroline Arber et al. J Clin Invest. 2015 Jan.

Abstract

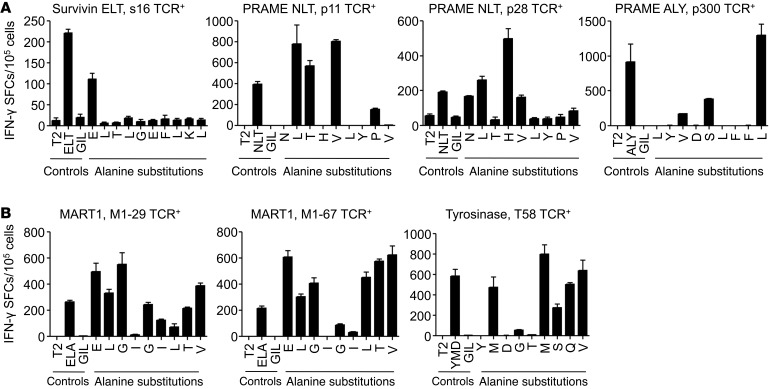
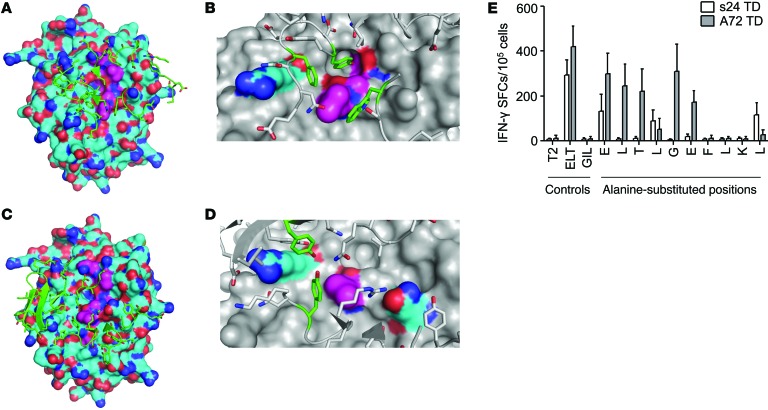
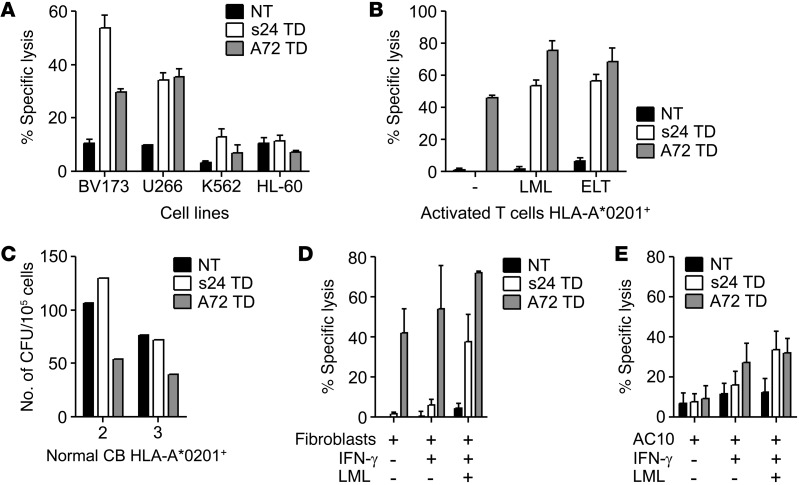
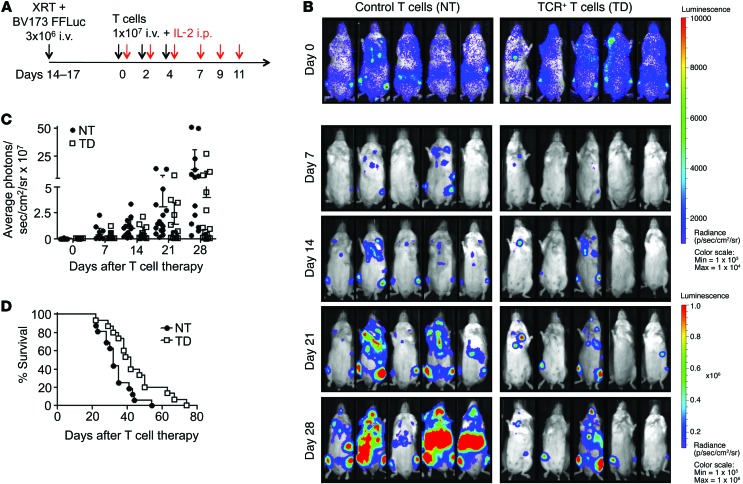
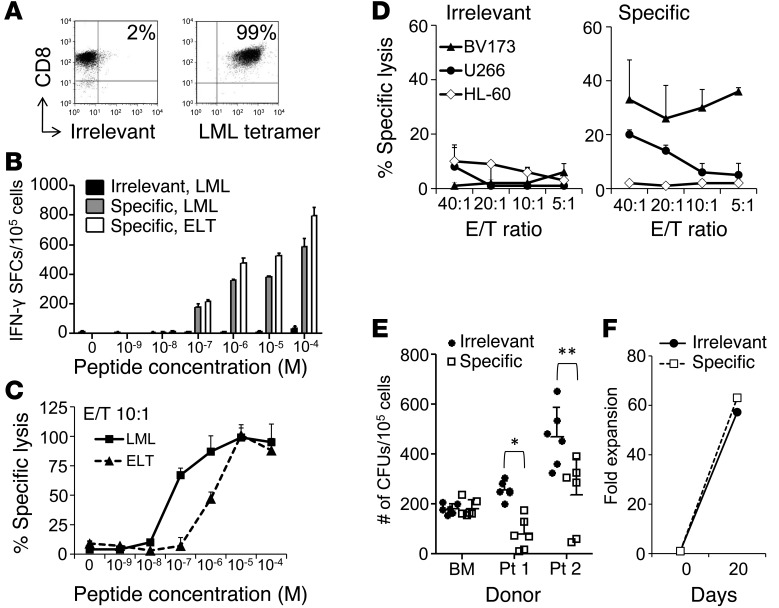
Survivin is a tumor-associated antigen (TAA) that inhibits apoptosis and is widely overexpressed in cancer cells; therefore, survivin has potential as a target for cancer immunotherapy. Application of HLA-A2-restricted survivin-specific T cell receptors (TCRs) isolated from allogeneic HLA-mismatched TCR repertoires has, however, been impeded by the inability of these TCRs to distinguish healthy cells expressing low levels of survivin from cancer cells with high survivin expression levels. Here, we identified an HLA-A2-restricted survivin-specific TCR isolated from autologous TCR repertoires that targets tumor cells in vitro and in vivo but does not cause fratricidal toxicity. Molecular modeling of the TCR-peptide-HLA ternary complexes and alanine scanning revealed that the autologously derived TCRs had tighter interactions with the survivin peptide than did fratricidal TCRs. Similar recognition patterns were observed among 7 additional TAA-specific TCRs isolated from allogeneic versus autologous repertoires. Together, the results from this study indicate that maximal peptide recognition is key for TCR selectivity and likely critical for reducing unwanted off-target toxicities. Moreover, isolating TCRs from autologous repertoires to maximize TCR selectivity has potential as a useful strategy to identify and select other shared tumor- and self-antigen-specific TCRs and ensure selective antitumor activity.


Figures

Figure 9
Figure 9. TCRs derived from autologous repertoires have a lower potential for cross-reactivity.
Alanine substitution analysis of T cells engineered to express transgenic autologous TCRs (A) and allogeneic TCRs (B) for recognition of peptide-pulsed T2 cells by IFN-γ ELISpot assay when targeting different TAAs. Data represent the mean ± SD of triplicates, with 2 donors tested for each TCR.
Figure 8
Figure 8. Different molecular recognition patterns of autologous versus allogeneic repertoire–derived survivin-specific TCRs.
(AD) Structural modeling reveals a highly epitope-specific binding interface of the novel autologous survivin-specific TCR s24. (A and C) HLA-A*0201 (cyan) and survivin ELT peptide (magenta) are represented at the surface; TCR regions directly in contact with the HLA-peptide complex are represented in green. (B and D) Residues with the most energetically favorable contacts across the binding interface are in green (TCR), cyan (HLA) or magenta (ELT peptide). (B) Trp 289, Tyr 352, and Phe 356 from the s24-TCR, Leu 4, Gly 5, and Phe 7 from the survivin peptide, and Arg 65 from the HLA. (D) Trp 244, Tyr 290 from the A72-TCR, Leu 4 from the survivin peptide, and Arg 65 and Gln 155 from the HLA. (E) Alanine substitution analysis testing s24 TD (white bars) or A72 TD (gray bars) T cells for recognition of peptide-pulsed T2 cells by IFN-γ ELISpot assay. Data represent the mean ± SD (n = 4 donors).
Figure 7
Figure 7. Fratricidal activity of allogeneic repertoire–derived survivin-specific TCR.
(AE) Comparison of TCR+ T cells transduced with the s24 survivin-specific TCR (s24 TD, white bars) with the A72 survivin-specific TCR (A72 TD, gray bars) or NT control T cells (black bars). Data represent the mean ± SD of triplicate experiments for 2 to 4 donors. (A) 51Cr-release assay against HLA-A2+survivin+ (BV173 and U266) and HLA-A2survivin+ (HL-60 and K562) cancer cell lines. Data represent the mean ± SD of triplicates for the percentage of specific lysis at an E/T ratio of 20:1. (B) 51Cr-release assay against activated HLA-A*0201+ target T cells in the absence of exogenous peptide (–) or pulsed with LML or ELT peptide. Data represent the mean ± SD of triplicates for the percentage of specific lysis at an E/T ratio of 20:1. (C) CFU assay with normal HLA-A2+ CB donors. Data represent the mean of duplicates at an E/T ratio of 10:1. 51Cr-release assay against HLA-A*0201+ fibroblasts (D) and the HLA-A*0201+ cardiomyocyte cell line AC10 (E) with IFN-γ pretreatment or IFN-γ pretreatment and pulsed with LML peptide. Data represent the mean ± SD of the percentage of specific lysis at an E/T ratio of 20:1 for 4 donors.
Figure 6
Figure 6. Survivin-specific TCR+ T cells prolong survival of mice with high leukemia burden.
(A) Experimental plan. Intravenous administration of 3 × 10⁶ BV173 FFluc cells to NSG mice after sublethal irradiation (120 cGy). T cells were infused 14–17 days later, when leukemia was disseminated and established in multiple organs as detected by BLI. T cell infusions, IL-2, and weekly BLI. (B) Time course of BLI in representative individual mice from both treatment groups. Scale: 1 × 10³ to 1 × 10⁴ photons/second/cm2/sr (day 0); 1 × 10⁵ to 1 × 10⁶ photons/second/cm2/sr (days 7–28). (C) Average photons/second/cm2/sr/mouse comparing mice treated with control T cells (NT, n = 16) or survivin-specific TCR+ T cells (TD, n = 15). The intensity signals were also log transformed, and the response profiles over time were analyzed by the robust generalized estimating equations method (P = 0.006). Data represent the mean ± SD of 3 independent experiments. (D) Kaplan-Meier survival curve of mice treated with survivin-specific TCR+ T cells (TD) or control T cells (NT). P = 0.01 by generalized Wilcoxon test.
Figure 5
Figure 5. Survivin-specific TCR–redirected T cells have in vivo antileukemic activity.
(A) Experimental plan. Intravenous administration of 3 × 10⁶ BV173-FFluc cells to NSG mice after sublethal irradiation (120 cGy), followed by T cell infusions, IL-2, and weekly BLI starting on day 18. (B) Time course of BLI in representative individual mice from both treatment groups. Scale: 5 × 10⁴ to 5 × 10⁵ photons/second/cm2/sr. (C) Average photons/second/cm2/sr per mouse, determined by BLI, comparing mice treated with control T cells (NT, n = 9, black circles) or survivin-specific TCR+ T cells (TD, n = 10, white squares). Data represent the mean ± SD. *P = 0.01 at day 32 and **P = 0.009 at day 39, by Student’s t test with Bonferroni’s correction for multiple comparisons. The intensity signals were also log transformed, and the response profiles over time were analyzed by the robust generalized estimating equations method (P < 0.0001). Data represent 2 independent experiments. (D) Kaplan-Meier survival curve of mice treated with survivin-specific TCR+ T cells (TD) or control T cells (NT). P < 0.001 by generalized Wilcoxon test.
Figure 4
Figure 4. Survivin-specific TCR–redirected T cells have antitumor activity in vitro, while lacking toxicity against normal hematopoietic stem/progenitor cells.
(A) 51Cr-release assays of survivin-specific TCR+ TD (white squares) and NT control T cells (black circles) against HLA-A*02+survivin+ cancer cell lines BV173 and U266 and the HLA-A*02survivin+ targets HL-60 and K562. Symbols indicate the mean of triplicates per donor; error bars represent the mean ± SD of the percentage of specific lysis at an E/T ratio of 20:1 (n = 12 donors). *P < 0.001; **P = 0.003 by Student’s t test. (B) HLA restriction of TCR+ TD (white symbols) and NT T cells (black symbols) assessed by preincubation of BV173 (left panel, triangles) or U266 (right panel, circles) with HLA class I–blocking Ab (dotted lines), HLA class II–blocking Ab (dashed lines), or in the absence of Ab (solid lines). Data represent the mean ± SD of 3 technical replicates from 1 donor. Cells from 2 donors were analyzed. (C) Quantification of residual tumor cells in cocultures on day 5 of TCR+ TD (open squares) and NT (black circles) T cells cultured with BV173, U266, K562, and HL-60 cells (E/T 5:1). Mean ± SD of residual tumor cells (n = 6). *P < 0.001 and ** P = 0.02 by Student’s t test. (D) IFN-γ production by TCR+ TD (white squares) and NT (black circles) T cells against BV173, U266, K562, and HL-60 cells by ELISpot assay. Symbols represent the mean of triplicates per donor; error bars indicate the mean ± SD (n = 5). *P < 0.001 and **P = 0.01 by Student’s t test. (EG) Assessment of leukemic colony formation by TCR+ TD (white squares) and NT (black circles) T cells against HLA-A*02+ CML blast crisis (n = 2) and AML (n = 3) (E), HLA-A*02 leukemic blasts (F), and HLA-A*02+ healthy donor–derived BM (n = 1) or CB (n = 4) progenitor cells (G). Data represent the mean ± SD of CFU plated in duplicate for 5 donors. *P < 0.001 by Student’s t test.
Figure 3
Figure 3. The ectopically expressed survivin-specific TCR is functional and specific, but not fratricidal, in vitro.
(AC, E, and F) Symbols represent the mean of triplicates per donor; error bars represent the mean ± SD. (A) Production of IFN-γ (ELISpot) in response to LML and ELT peptides by nontransduced (NT, black circles) and transduced (TD, white squares) T cells (n = 5). (B) Killing of LML-pulsed T2 cells (51Cr release) by NT and TD T cells, with the percentage of specific lysis at an E/T ratio of 20:1 (n = 3). (C) Evaluation of HLA restriction of the killing of LML-pulsed T2 cells by preincubation with HLA class I–blocking Ab (dotted line) or HLA class II–blocking Ab (dashed line), or in the absence of Ab (solid line) by TD T cells (white squares) and NT T cells (black squares, solid line). Data are representative of 2 independent experiments. (D) Expansion of transgenic T cells with weekly antigen-specific stimulations generated from HLA-A*02+ (black circles, solid line) or HLA-A*02 (white squares, dashed line) donors. Mean ± SD, n = 7, P = NS. (E and F). 51Cr-release assays of NT (black circles) and TD T cells (white squares) against activated HLA-A*02+ target T cells loaded or not with LML or ELT peptide. Percentage of specific lysis at an E/T ratio of 20:1 of survivin-specific TCR expressed in (E) HLA-A*02 (n = 7) or (F) HLA-A*02+ donors (n = 7).
Figure 2
Figure 2. Efficient expression of the transgenic survivin-specific TCR by polyclonal CD8+ T cells.
(A) Scheme of the retroviral vector. sd, splice donor; sa, splice acceptor. (B) Transduction efficiency detected by staining for the mCβ and the LML tetramer. Enrichment of LML tetramer+ cells during T cell expansion in the presence of LML-pulsed aAPCs (2 weekly stimulations). Representative FACS plots immediately after transduction (After TD), and after 1 (End S1) or 2 (End S2) stimulations. Numbers indicate the percentage of positive cells in each quadrant. Graph shows the mean ± SD of 4 donors. (C) Increase in LML tetramer MFI after weekly antigen-specific stimulations. Representative histogram staining with irrelevant tetramer (gray), LML tetramer after TD (black), “End S1” (blue), and “End S2” (red). Graph shows the mean ± SD of 4 donors.
Figure 1
Figure 1. Survivin-specific T cell clone with antitumor effects in the absence of toxicity.
(A) FACS analysis of the survivin-specific T cell clone stained for CD8 and the LML-specific or irrelevant tetramer. (B) T cell avidity assessed by IFN-γ ELISpot assays of the irrelevant clone against the LML peptide (black bars) and the survivin-specific clone against the LML (gray bars) or the ELT peptides (white bars). SFCs per 105 cells. Data represent the mean ± SD of triplicate experiments. (C) T cell avidity assessed by 51Cr-release assay against LML- (squares, solid line) or ELT-pulsed T2 cells (triangles, dashed line). Data show the mean ± SD of triplicates of the specific lysis at a 10:1 E/T ratio. (D) Antitumor activity by 51Cr-release assay of an irrelevant (left panel) and a survivin-specific (right panel) clone derived from the same donor against the HLA-A*02+survivin+ target cell lines BV173 and U266 and the HLA-A*02survivin+ target cell line HL-60. Data represent the mean ± SD of 3 technical replicates of 1 experiment. Two independent experiments were performed in triplicate. (E) Antileukemic activity and absence of toxicity to normal hematopoietic progenitor cells by CFU assay of the survivin-specific clone (white squares) and the irrelevant clone (black circles) against HLA-A*02+survivin+ primary leukemic blasts from 2 CML blast crisis patients and 1 HLA-A*02+ normal BM donor. Data represent the mean ± SD of 3 independent experiments performed in duplicate. *P < 0.001; **P = 0.001 by Student’s t test. (F) Absence of T cell fratricide, assessed as fold expansion over a 3-week culture period after superexpansion of the survivin-specific (white squares, dashed line) and irrelevant (black circles, solid line) clones.

References

    1. Morgan RA, et al. Cancer regression in patients after transfer of genetically engineered lymphocytes. Science. 2006;314(5796):126–129. doi: 10.1126/science.1129003. - DOI - PMC - PubMed
    1. Johnson LA, et al. Gene therapy with human and mouse T-cell receptors mediates cancer regression and targets normal tissues expressing cognate antigen. Blood. 2009;114(3):535–546. doi: 10.1182/blood-2009-03-211714. - DOI - PMC - PubMed
    1. Robbins PF, et al. Tumor regression in patients with metastatic synovial cell sarcoma and melanoma using genetically engineered lymphocytes reactive with NY-ESO-1. J Clin Oncol. 2011;29(7):917–924. doi: 10.1200/JCO.2010.32.2537. - DOI - PMC - PubMed
    1. Cheever MA, et al. The prioritization of cancer antigens: a national cancer institute pilot project for the acceleration of translational research. Clin Cancer Res. 2009;15(17):5323–5337. doi: 10.1158/1078-0432.CCR-09-0737. - DOI - PMC - PubMed
    1. Rapoport AP, et al. Combination immunotherapy using adoptive T-cell transfer and tumor antigen vaccination on the basis of hTERT and survivin after ASCT for myeloma. Blood. 2011;117(3):788–797. doi: 10.1182/blood-2010-08-299396. - DOI - PMC - PubMed

Publication types