. 2015 Apr 1;593(7):1531-50.
doi: 10.1113/jphysiol.2014.281196. Epub 2015 Jan 2.

Differential function of Gγ13 in rod bipolar and ON cone bipolar cells

Affiliations

Differential function of Gγ13 in rod bipolar and ON cone bipolar cells

Hariharasubramanian Ramakrishnan et al. J Physiol. .

Abstract

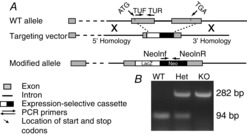
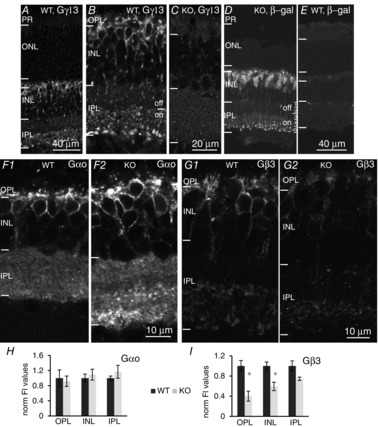
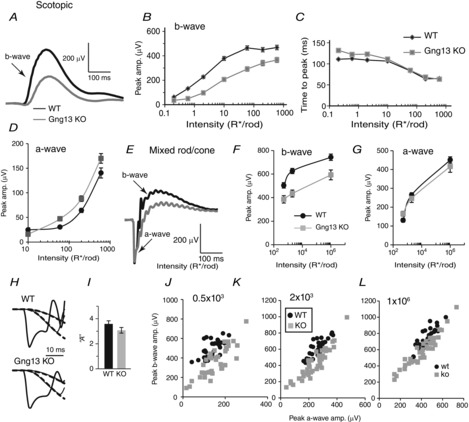
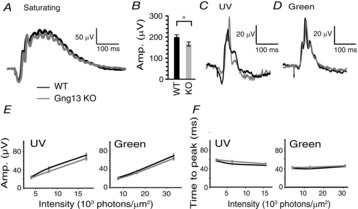
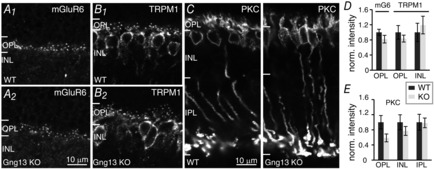
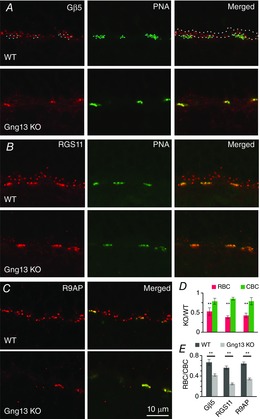
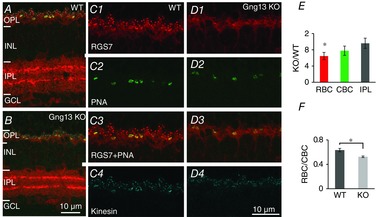
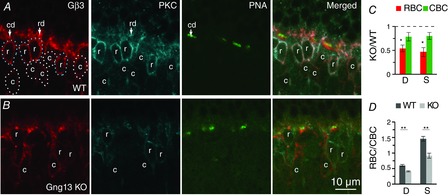
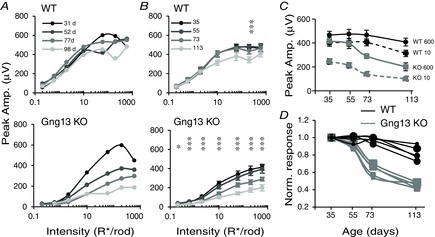
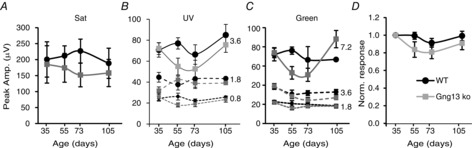
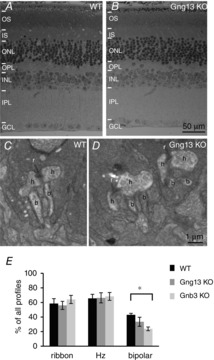
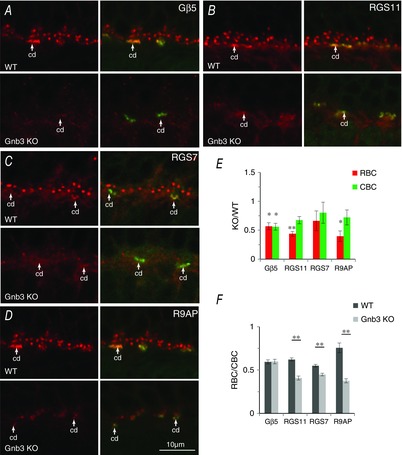
Heterotrimeric G-proteins (comprising Gα and Gβγ subunits) are critical for coupling of metabotropic receptors to their downstream effectors. In the retina, glutamate released from photoreceptors in the dark activates metabotropic glutamate receptor 6 (mGluR6) receptors in ON bipolar cells; this leads to activation of Go , closure of transient receptor potential melastatin 1 channels and hyperpolarization of these cells. Go comprises Gαo , Gβ3 and a Gγ. The best Gγ candidate is Gγ13, although functional data to support this are lacking. Thus, we tested Gγ13 function by generating Gng13(-/-) knockout (KO) mice, recording electroretinograms (ERG) and performing immunocytochemical staining. The amplitude of scotopic ERG b-waves in KO mice was lower than in wild-type (WT) mice. Furthermore, in both KO and WT mice, the ERG b-wave decreased with age; this decrease was much more pronounced in KO mice. By contrast, the photopic ERG b-waves in KO mice were hardly affected at any age. In KO mice retinas, immunostaining for Gβ3 and for the GTPase activating proteins RGS7, RGS11, R9AP and Gβ5 decreased significantly in rod bipolar cells but not in ON cone bipolar cells. Staining for Gαo and certain other cascade elements decreased only slightly. Analysis of our ON bipolar cDNA library showed that these cells express mRNAs for Gγ5, Gγ10 and Gγ11. Quantitative RT-PCR of retinal cDNA showed greater values for these transcripts in retinas of KO mice, although the difference was not significant. Our results suggest that Gγ13 contributes to mGluR6 signalling in rod bipolar cells more than in ON cone bipolar cells, and that this contribution includes both coupling the receptor and maintaining a stable localization of the mGluR6-related cascade elements.


Figures

Figure 1
Figure 1
Strategy for generating and genotyping Gng13 KO mice ES cells carrying the Gng13-null allele were obtained from KOMP. A, homologous recombination in ES cells using a bacterial artificial chromosome based construct with a Gng13 gene specific deletion and an expression selective cassette containing the LacZ reporter. The final allele lacks the entire coding region of Gng13 and part of the 3′ UTR. The positions of various primers used for genotyping are indicated. B, PCR products run on an agarose gel show the expected size products for different genotypes: TUF and TUR, 94 bp (WT and heterozygous, Het); NeoInf and NeoInR, 282 bp (KO and Het).
Figure 2
Figure 2
Absence of Gγ13 greatly reduces expression of Gβ3 in ON bipolar cells A and B, staining for Gγ13 in WT retina (lower and higher magnifications) shows its localization in dendrites, somas and axon terminals of all ON bipolar cells, and its absence elsewhere. Note staining is throughout the ON sublamina. C, staining for Gγ13 in Gng13 KO retina is absent. D, staining for the reporter LacZ in KO retina shows the exact same localization as Gγ13 in WT mice; staining is present throughout the sublaminas of the ON sublayer, although it is strongest in sublamina 5. E, staining for LacZ is absent in WT mice. F, Staining for Gαo in KO mice (F2) closely resembles staining in WT mice (F1) (5 sets). G, staining for Gβ3 in KO mice (G2) is much fainter than in WT mice (G1) (3 sets). H and I, averaged normalized pixel intensity (± SEM) for Gαo (H) and Gβ3 (I) in the OPL, INL and IPL. Values were normalized to WT average intensity. *Statistically significant difference between staining for Gβ3 in WT mice and Gng13 KO mice (in both OPL and INL but not IPL). ONL, outer nuclear layer.
Figure 3
Figure 3
Absence of Gγ13 reduces scotopic ERG b-waves Black lines and symbols indicate WT mice and grey lines and symbols indicate KO mice. A to D, scotopic conditions (dark-adapted, rod only stimulation). A, an example of the ERG responses of littermate WT and Gng13 KO mice to 10 R* per rod (flash in the scotopic range). B, average peak amplitude (amp.) (± SEM) of scotopic b-wave vs. flash intensity; responses in KO mice are reduced (depending on intensity; for WT mice, the number of records was 31–40 and, for KO mice, it was 35–48. Note that SEM for several intensities was smaller than the symbol size). C, average time to peak (± SEM) of b-wave for the same data as in B. D, peak a-wave amplitude vs. intensity for WT and KO mice; the difference in amplitude between WT and KO mice for most responses was highly significant. E to L, Mixed rod/cone input (dark-adapted, bright light stimulates both rods and cones). Data are from 24 records from 13 WT mice and 21 records from 16 KO mice. E, representative examples of ERG responses of WT and KO littermates to saturated bright light under dark-adapted conditions representing mixed rod and cone responses. F, peak b-wave amplitude vs. 3 rod-saturating intensities for WT and KO mice. The difference in amplitude between responses for WT and KO mice was highly significant. G, peak a-wave amplitude vs. 3 rod-saturating intensities for WT and KO mice; no significant difference was found. H and I, Lamb and Pugh analysis of the amplification factor ‘A’. H, examples of expanded normalized a-wave responses and their fits (dashed lines) for WT and KO mice. I, the resulting average ‘A’ values for WT and KO mice. J to L, correlograms of a- and b-waves for the three strong stimuli (indicated on the graphs in R*/rod). Each dot represents data from one ERG recording. Note that, for any a-wave amplitude, the corresponding b-wave amplitude in WT mice is greater than that in KO mice.
Figure 4
Figure 4
Absence of Gγ13 hardly affects the photopic ERG A, C and D, examples of ERG responses under light-adapted conditions representing purely cone-generated responses. A, responses to bright (saturating) photopic stimulation (1000 scot cd s m−2). B, average amplitude (Amp.) of b-wave (± SEM) in response to the saturated flash (26 records from 14 WT mice and 35 records from 18 KO mice). C, responses to a UV flash (0.0035 cd s m−2 or 3.6 × 103 photons μm–2). D, responses to a green light (4 cd s m−2 or 7.2 × 103 photons μm–2). E, average amplitude of b-wave (± SEM) vs. flash intensity for UV and green lights. F, time to peak of b-wave using same records as in E. Average responses (Amp.) under photopic conditions were similar for WT and KO mice.
Figure 5
Figure 5
Absence of Gγ13 slightly but not significantly reduces staining intensity for mGluR6, TRPM1, and PKCα A to C, immunostaining of wild type (WT) and Gng13 KO retinas as indicated. The scale bar in A applies also to B. D, average normalized (norm.) pixel intensity (± SEM) for mGluR6 staining in the OPL (mG6, n = 5 sets) and for TRPM1 staining in the OPL and INL (n = 4 sets); TRPM1 staining in INL remains unchanged but both stains in OPL are slightly reduced. E, average normalized pixel intensity for PKC staining in the OPL, INL and IPL (n = 3 sets); staining in OPL is slightly reduced.
Figure 6
Figure 6
Absence of Gγ13 significantly reduces Gβ5, RGS11 and R9AP staining intensity in the dendritic tips of RBCs but not in those of ON CBCs A to C, immunostaining for GAP proteins Gβ5 (A), RGS11 (B) and R9AP (C) in WT and in littermate Gng13 KO mice. PNA staining identifies the location of dendritic tips of ON CBCs in apposition to cone pedicles. The white dotted outline in A (right) shows an example of a ROI taken to quantify staining in dendritic tips of RBCs; blue dotted lines show ROIs drawn to quantify dendritic tips of CBCs (CBC). D, staining intensity for Gβ5, RGS11 and R9AP in KO mice relative to that in WT for RBC (red) and CBC (green) dendritic tips. For RBCs, but not for CBCs, staining intensities in KO mice showed a highly significant decrease from intensities in WT. E, same data as in D recalculated to show the staining intensities for Gβ5, RGS11 and R9AP in RBCs relative to these intensities in CBCs in the same sections. The average ratio (± SEM) for 6 (Gβ5), 7 (RGS11) and 8 (R9AP) sets is shown. For each protein, the ratio in KO mice was significantly (P < 0.01) lower than that in WT mice, indicating a greater reduction of staining intensity in the rod bipolar dendritic tips than in the cone bipolar dendritic tips.
Figure 7
Figure 7
Absence of Gγ13 significantly reduces RGS7 staining intensity in the dendritic tips of RBCs, but not in those of ON CBCs or in the IPL A and B, retinas of WT (A) and KO (B) mice triple stained for RGS7 (red), PNA (green) and kinesin (blue). Note reduced staining for RGS7 in OPL but not in IPL. C and D, the above staining in OPL is shown at higher magnifications for each protein as indicated. E, staining intensity in KO mice relative to WT mice for rod bipolar dendrites (RBC, red), ON cone bipolar dendrites as identified using PNA staining (CBC, green) and IPL (grey). The difference between KO and WT mice intensities in RBCs was significant, whereas that in CBCs was not. F, staining in rod bipolar dendrites relative to cone bipolar dendrites for WT and KO mice. Staining is significantly lower in KO than in WT mice (Student's t test; 3 sets).
Figure 8
Figure 8
Absence of Gγ13 reduces Gβ3 staining in RBCs more than in ON CBCs Triple labelling for Gβ3, PKC and PNA in WT (A) and Gng13 KO (B) retinas. PNA staining locates cone bipolar dendritic tips (cd); the rest of the OPL staining was considered as rod bipolar dendrites (rd). Somas stained for PKC are rod bipolar somas (r); somas stained for Gβ3 and not for PKC are cone bipolar somas (c). ROIs for rod bipolar somas (dotted outlines) and ON cone bipolar somas (white dotted outlines) are shown (A). Note that, in WT mice, the rod bipolar somas display brighter Gβ3 staining than the cone bipolar somas and, in KO mice, the cone bipolar somas have brighter staining. C and D, quantitative analysis of staining intensity. Average intensities per pixel were measured for the four different ROIs (rod bipolar dendrites, cone bipolar dendrites, rod bipolar somas and cone bipolar somas). C, staining intensities in dendrites (D) and somas (S) of KO RBCs (but not ON CBCs) are significantly different from that in WT cells. D, same data set as in C recalculated to show the average ratio (RBC/CBC) of Gβ3 staining intensity in the cell dendrites (D) and somas (S) in WT and KO retinas. For both dendrites and somas, the differences between these ratios for WT and KO are highly significant (4 sets of animals).
Figure 9
Figure 9
Scotopic light responses in Gng13 KO mice decrease with age A, amplitude (Amp.) of ERG b-wave vs. flash intensity of a single WT mouse and a single littermate Gng13 KO for 4 time points (in days) as indicated. With age, response curves decreased slightly for WT mice, and dramatically for KO mice. B, population average of ERG b-wave amplitudes (± SEM) for the different intensities. Twelve WT and 17 KO mice were grouped into 4 age groups. The age (in days) indicates the median of the group. A star and 3 vertical stars indicate a significant (P < 0.05) and highly significant (P < 0.0001) decline over age. C, scotopic b-wave amplitudes for two flash intensities (10, and 600 R* per rod) are plotted against age. With age, these amplitudes decline more steeply in KO mice (grey) than in WT mice (black). D, data for the 5 highest intensities in B were normalized to the youngest age and plotted against age for WT mice (black) and KO mice (grey).
Figure 10
Figure 10
Photopic light responses in Gng13 KO mice are not affected by age A to C, peak amplitudes of the b-wave for WT (black) and KO (grey) are plotted against age for the saturated flash (A) (Sat; 1000 scot cd s m–2), for the 3 intensities of UV flashes (B), and for the 3 intensities of the green flashes (C); intensities for UV and green flashes are indicated on the right side of the graphs in 103 photons μm−2. D, average normalized responses against age. All responses were normalized for each intensity level to the youngest group and were then averaged across all 7 conditions (3 intensities for UV, 3 for green light, as well as a saturating stimulus). Responses in KO are reduced with age by less than 15%.
Figure 11
Figure 11
Retinal structure in the old Gng13 KO mouse is normal A and B, semi-thin (0.5 μm thick) plastic retinal sections of 8.5-month-old WT and KO mice stained with toluidine blue; all layers appear normal. OS, outer segments; IS, inner segments; ONL, outer nuclear layer; GCL, ganglion cell layer. C and D, electron micrographs of WT mice (C) and KO mice (D) show the rod to rod bipolar synapse with a ribbon (r), two lateral horizontal cell processes (h) and the invaginating bipolar dendrites (b). In most images, only one bipolar cell is seen; profiles with 2 invaginating bipolar dendrites are shown because they could also be seen in KO. E, percentages of profiles in which at least one ribbon, one horizontal cell process (Hz) or one bipolar dendrite (bipolar) was seen for WT mice (black), Gng13 KO mice (grey) and Gnb3 KO mice (light grey). For bipolar cells, the differences between WT mice and Gng13 KO mice and that between Gng13 KO mice and Gnb3 KO mice did not reach statistical significance, although the difference between WT mice and Gnb3 KO mice did (Student's t test). Number of profiles analysed: WT, 778 from 5 mice; Gng13 KO, 847 from 3 mice; Gnb3 KO, 404 from 3 mice.
Figure 12
Figure 12
Absence of Gβ3 reduces GAP staining in the dendritic tips of RBCs more than in the tips of ON CBCs A to D, immunostaining for Gβ5 (A), RGS11 (B), RGS7 (C) or R9AP (D) (red) in WT mice and in a littermate Gnb3 KO mouse. PNA staining (green) locates the dendritic tips of ON CBCs. Cd, cone bipolar dendritic tips. E, staining intensity in KO mice relative to WT mice in RBCs (red) and CBCs (green) (3 sets for RGS7; 4 sets for the rest). For RGS11 and R9AP, staining in KO RBCs is significantly lower than WT cells, whereas staining in KO CBCs is similar to that for WT; for RGS7, the trend is similar, although the difference does not reach significance; for Gβ5, RBCs and ON CBCs decrease similarly in staining and both cell types in KO mice show staining that is significantly lower than that in WT mice. F, ratio of staining intensity for Gβ5, RGS11, RGS7 and R9AP in dendritic tips of RBCs relative to that in tips of CBCs in the same sections. For RGS11, RGS7 and R9AP, RBC/CBC is significantly lower in KO mice than in WT mice, indicating a greater reduction of staining in the rod bipolar dendritic tips.

Comment in

  • All ON pathways are not alike.
    Morgans CW. Morgans CW. J Physiol. 2015 Apr 1;593(7):1527-8. doi: 10.1113/JP270006. J Physiol. 2015. PMID: 25828643 Free PMC article. No abstract available.

Similar articles

Cited by

References

    1. Audo I, Kohl S, Leroy BP, Munier FL, Guillonneau X, Mohand-Said S, Bujakowska K, Nandrot EF, Lorenz B, Preising M, Kellner U, Renner AB, Bernd A, Antonio A, Moskova-Doumanova V, Lancelot ME, Poloschek CM, Drumare I, Defoort-Dhellemmes S, Wissinger B, Leveillard T, Hamel CP, Schorderet DF, De Baere E, Berger W, Jacobson SG, Zrenner E, Sahel JA, Bhattacharya SS. Zeitz C. TRPM1 is mutated in patients with autosomal-recessive complete congenital stationary night blindness. Am J Human Gen. 2009;85:720–729. - PMC - PubMed
    1. Blake BL, Wing MR, Zhou JY, Lei Q, Hillmann JR, Behe CI, Morris RA, Harden TK, Bayliss DA, Miller RJ. Siderovski DP. G beta association and effector interaction selectivities of the divergent G gamma subunit G gamma(13) J Biolog Chem. 2001;276:49267–49274. - PubMed
    1. Bomsel M. Mostov K. Role of heterotrimeric G proteins in membrane traffic. Mol Biol Cell. 1992;3:1317–1328. - PMC - PubMed
    1. Boyer JL, Waldo GL. Harden TK. Beta gamma-subunit activation of G-protein-regulated phospholipase C. J Biol Chem. 1992;267:25451–25456. - PubMed
    1. Breton ME, Schueller AW, Lamb TD. Pugh EN., Jr Analysis of ERG a-wave amplification and kinetics in terms of the G-protein cascade of phototransduction. Invest Ophthalmol Vis Sci. 1994;35:295–309. - PubMed

Substances

LinkOut - more resources