. 2015 Mar 15;593(6):1459-77.
doi: 10.1113/jphysiol.2014.283226. Epub 2014 Dec 22.

Inositol-1,4,5-trisphosphate induced Ca2+ release and excitation-contraction coupling in atrial myocytes from normal and failing hearts

Affiliations

Inositol-1,4,5-trisphosphate induced Ca2+ release and excitation-contraction coupling in atrial myocytes from normal and failing hearts

Felix Hohendanner et al. J Physiol. .

Abstract

Key points: Impaired calcium (Ca(2+)) signalling is the main contributor to depressed ventricular contractile function and occurrence of arrhythmia in heart failure (HF). Here we report that in atrial cells of a rabbit HF model, Ca(2+) signalling is enhanced and we identified the underlying cellular mechanisms. Enhanced Ca(2+) transients (CaTs) are due to upregulation of inositol-1,4,5-trisphosphate receptor induced Ca(2+) release (IICR) and decreased mitochondrial Ca(2+) sequestration. Enhanced IICR, however, together with an increased activity of the sodium-calcium exchange mechanism, also facilitates spontaneous Ca(2+) release in form of arrhythmogenic Ca(2+) waves and spontaneous action potentials, thus enhancing the arrhythmogenic potential of atrial cells. Our data show that enhanced Ca(2+) signalling in HF provides atrial cells with a mechanism to improve ventricular filling and to maintain cardiac output, but also increases the susceptibility to develop atrial arrhythmias facilitated by spontaneous Ca(2+) release.

Abstract: We studied excitation-contraction coupling (ECC) and inositol-1,4,5-triphosphate (IP3)-dependent Ca(2+) release in normal and heart failure (HF) rabbit atrial cells. Left ventricular HF was induced by combined volume and pressure overload. In HF atrial myocytes diastolic [Ca(2+)]i was increased, action potential (AP)-induced Ca(2+) transients (CaTs) were larger in amplitude, primarily due to enhanced Ca(2+) release from central non-junctional sarcoplasmic reticulum (SR) and centripetal propagation of activation was accelerated, whereas HF ventricular CaTs were depressed. The larger CaTs were due to enhanced IP3 receptor-induced Ca(2+) release (IICR) and reduced mitochondrial Ca(2+) buffering, consistent with a reduced mitochondrial density and Ca(2+) uptake capacity in HF. Elementary IP3 receptor-mediated Ca(2+) release events (Ca(2+) puffs) were more frequent in HF atrial myoctes and were detected more often in central regions of the non-junctional SR compared to normal cells. HF cells had an overall higher frequency of spontaneous Ca(2+) waves and a larger fraction of waves (termed arrhythmogenic Ca(2+) waves) triggered APs and global CaTs. The higher propensity of arrhythmogenic Ca(2+) waves resulted from the combined action of enhanced IICR and increased activity of sarcolemmal Na(+)-Ca(2+) exchange depolarizing the cell membrane. In conclusion, the data support the hypothesis that in atrial myocytes from hearts with left ventricular failure, enhanced CaTs during ECC exert positive inotropic effects on atrial contractility which facilitates ventricular filling and contributes to maintaining cardiac output. However, HF atrial cells were also more susceptible to developing arrhythmogenic Ca(2+) waves which might form the substrate for atrial rhythm disorders frequently encountered in HF.


Figures

Figure 1
Figure 1
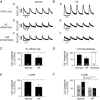
Ca2+ cycling during ECC in normal and HF left atrial myocytes A, control line scan images (a, d) and CaTs (b, e) from central (CT) and subsarcolemmal (SS) cytosolic regions of normal and HF atrial myocytes and from control (c) and HF (f) ventricular cells. Arrowheads indicate electrical stimulation. B, [Ca2+]SR traces obtained from whole-cell imaging of Fluo-5 N fluorescence in normal (left) and HF (right) atrial myocytes. Arrowheads indicate electrical stimulation. C, summary data of local CaT amplitudes in CT and SS regions of normal and HF atrial myocytes obtained from transversal line scans. Square brackets indicate significant differences at P < 0.05, one-way ANOVA. D, summary data for the centripetal Ca2+ propagation velocity in normal and HF atrial cells derived from transversal line scans. E, summary data for the CaT amplitude in normal and HF ventricular myocytes obtained from longitudinal line scans. F, summary data for the [Ca2+]SR depletion amplitude in normal and HF atrial myocytes as obtained from 2D confocal measurements of Fluo-5 N fluorescence. Panels D–F: *P < 0.05, Student's t test. Here and subsequent figures: numbers in bar graphs indicate n = number of cells.
Figure 2
Figure 2
Effect of Ang II on Ca2+ signalling during ECC in atrial cells A, electrically and caffeine-evoked CaTs in normal (top) and HF (bottom) atrial cells before (a, c; CTRL) and after (b, d) application of Ang II. B, changes of [IP3]i in normal (a) and HF (b) atrial myocytes revealed by measurement of FRET between CFP and YFP in cells expressing the IP3 biosensor FIRE1-cyt. C, diastolic [Ca2+]i during field stimulation in normal and HF myocytes under control conditions (black) or after treatment with Ang II (grey). D, CaT amplitudes during field stimulation in normal and HF myocytes under control conditions (black) or after treatment with Ang II (grey). E, SR Ca2+ load assessed from changes of [Ca2+]i induced by rapid application of 10 mm caffeine, in normal and HF myocytes under control conditions (black) or after treatment with Ang II (grey). In panels C–E square brackets indicate significant differences at P < 0.05, one-way ANOVA. F, grey bars show average increase of FIRE1-cyt FRET signal (F530/F488) after application of AngII in normal and HF myocytes. Black bars represent changes of control FRET signal over the same time interval in the absence of AngII. *P < 0.05, Student's t test.
Figure 3
Figure 3
Effect of IP3 uncaging on Ca2+ signalling during ECC in atrial cells A, change of [IP3]i in an atrial myocyte expressing FIRE1-cyt before and after IP3 uncaging. B, average percentage change of the [IP3]i-dependent FIRE1-cyt FRET signal (F530/F488) averaged over 3 s after uncaging. C and E, effect of global whole-cell IP3 uncaging on local CaTs in the subsarcolemmal (SS) and central (CT) cytosol in normal (C) and HF (E) atrial myocytes. D, same experiment as in panel C but in the presence of the IP3R blocker 2-APB. Panels C–E, bottom: summary data of IP3 uncaging effects on CaT amplitudes. *P < 0.05, Student's t test. 100% corresponds to the average [Ca2+]i levels before IP3 uncaging.
Figure 4
Figure 4
Effect of basal IICR on CaT amplitude A and B, CaTs in field stimulated normal (A) and HF (B) atrial myocytes after 24 h in culture, expressing a control (CTRL) virus (a), IP3 affinity trap (b) or m43 phosphatase (c). C and D, summary data of the percentage change of CaT amplitudes in normal and HF atrial myocytes expressing an IP3 affinity trap (C) or m43 phosphatase (D). *P < 0.05 against normal cells, Student's t test. In D, comparison of m43 phosphatase effect in normal ventricular cells. E, summary data of the effect of 2-APB on CaT amplitudes in normal and HF cells. Panels C–E: *P < 0.05, Student's t test. F, same as panel E but spatially resolved for the subsarcolemmal (SS) and the central (CT) cytosol. Square brackets indicate significant differences at P < 0.05, one-way ANOVA. In panels C–F, 100% corresponds to the average CaT amplitudes before inhibition of IP3 signalling.
Figure 5
Figure 5
Ca2+ puff activity in normal and HF atrial myocytes A and B, examples of longitudinal line scan images from permeabilized normal (A) and HF (B) myocytes under control (CTRL) conditions (a), after application of tetracaine (4 mm) (b), tetracaine + IP3 (5 μm) (c), and tetracaine + IP3 + 2-APB (10 μm) (d). nuc, nucleus; c, cytosol; e, extracellular space. C, line scan image of a Ca2+ spark (top) and Ca2+ spark profile (bottom) under control conditions in a normal atrial cell. D, line scan image of a Ca2+ puff (top) and Ca2+ puff profile (bottom) under control conditions in a normal atrial cell. E, overall frequencies of Ca2+ release events under the four conditions of panels A and B in normal (black) and HF (grey) cells. F, Ca2+ puff frequencies in the subsarcolemmal, central cytosolic and perinuclear compartments of normal (black) and HF (grey) atrial cells. Panels E and F: *P < 0.05, Student's t test.
Figure 6
Figure 6
Mitochondrial density and mitochondrial Ca2+ uptake A, average effects of Ru360 on diastolic [Ca2+]i, amplitude of AP-induced CaTs and SR Ca2+ load (CaT evoked by 10 mm caffeine). B, normal (top) and HF (bottom) atrial cell stained with Mitotracker Red FM. Raw fluorescence images and binary images used to calculate mitochondrial density. C, estimated cell volume occupied by mitochondria using Mitotracker (a) or Mitycam (b). D, effect of rapidly increasing [Ca2+]i from 0 to 5 μm on mitochondrial Ca2+ uptake in permeabilized normal and HF atrial cells. E, average effect of increasing [Ca2+]i to 5 μm on amplitude and the time to peak of [Ca2+]mito. *P < 0.05, Student's t test.
Figure 7
Figure 7
Arrhythmogenic Ca2+ waves and NCX activity in normal and HF atrial myocytes A, protocol to monitor spontaneous Ca2+ wave activity. Cells were electrically paced (arrowheads) at 0.5 Hz in 7 mm extracellular [Ca2+] to enhance SR Ca2+ loading. Ca2+ waves were quantified during a 2-min rest period after cessation of pacing. The stars mark spontaneous Ca2+ waves without global cell-wide Ca2+ release and arrows mark arrhythmogenic Ca2+ waves. B, spontaneous Ca2+ wave in a single atrial myocyte observed during a rest period after pacing. The Ca2+ wave led to subsequent global Ca2+ release by triggering an AP and SR Ca2+ release typical for atrial ECC (‘arrhythmogenic Ca2+ wave’). C, confocal 2D image from a central focal plane revealing the ‘U-shaped’ wave front (left) and normalized fluorescence profiles (F/F0) recorded along the dashed line (right). Da, frequency of spontaneous Ca2+ waves in normal and HF cells under control (CTRL) conditions (black), after the application of 2-APB (white) and SEA (grey). *P < 0.05 versus normal control; **P < 0.05 versus HF control, Student's t test. Db, latency of spontaneous Ca2+ waves. *P < 0.05, Student's t test. Dc, fraction of Ca2+ waves that induce a spontaneous AP and global CaTs (‘arrhythmogenic Ca2+ waves’) in HF atrial cells before (black) and after application of SEA (grey). In panel Dc square brackets indicate significant differences at P < 0.05, one-way ANOVA. Dd, absolute frequency of arrhythmogenic Ca2+ waves in normal and HF atrial myocytes in the absence and presence of SEA. To calculate absolute wave frequencies (panels a and d), also cells showing no waves were included. **P < 0.05 versus normal cells in the absence of SEA, Student's t test. *P < 0.05 versus control, Student's t test. Ea, protocol used to determine τCaT and τCaffeine for quantification of NCX activity. Eb, NCX activity in normal atrial cells (left), after inhibition of NCX in normal atrial cells with SEA, and in HF atrial cells. *P < 0.05 against normal cells, Student's t test.

Comment in

Similar articles

Cited by

References

    1. Ai X, Curran JW, Shannon TR, Bers DM. Pogwizd SM. Ca2+/calmodulin-dependent protein kinase modulates cardiac ryanodine receptor phosphorylation and sarcoplasmic reticulum Ca2+ leak in heart failure. Circ Res. 2005;97:1314–1322. - PubMed
    1. Alpert JS, Petersen P. Godtfredsen J. Atrial fibrillation: natural history, complications, and management. Annu Rev Med. 1988;39:41–52. - PubMed
    1. Barth E, Stammler G, Speiser B. Schaper J. Ultrastructural quantitation of mitochondria and myofilaments in cardiac muscle from 10 different animal species including man. J Mol Cell Cardiol. 1992;24:669–681. - PubMed
    1. Bassani JW, Bassani RA. Bers DM. Relaxation in rabbit and rat cardiac cells: species-dependent differences in cellular mechanisms. J Physiol. 1994;476:279–293. - PMC - PubMed
    1. Bers DM, Pogwizd SM. Schlotthauer K. Upregulated Na/Ca exchange is involved in both contractile dysfunction and arrhythmogenesis in heart failure. Basic Res Cardiol. 2002;97(Suppl. 1):I36–42. - PubMed

Publication types