. 2015 Feb;81(3):986-95.
doi: 10.1128/AEM.03018-14. Epub 2014 Nov 21.

Few highly abundant operational taxonomic units dominate within rumen methanogenic archaeal species in New Zealand sheep and cattle

Affiliations

Few highly abundant operational taxonomic units dominate within rumen methanogenic archaeal species in New Zealand sheep and cattle

Henning Seedorf et al. Appl Environ Microbiol. 2015 Feb.

Abstract

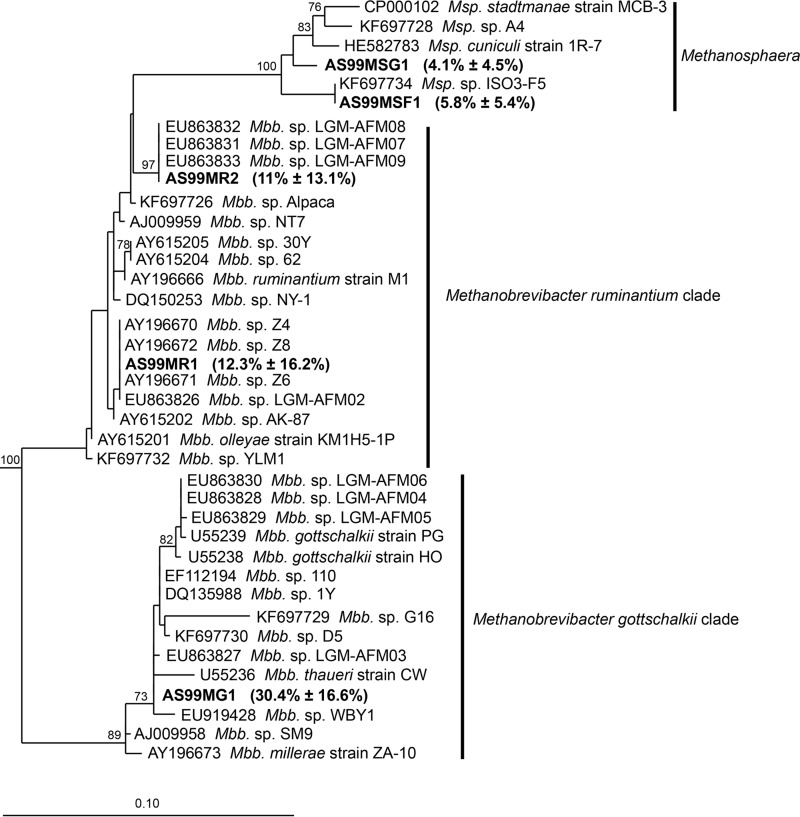
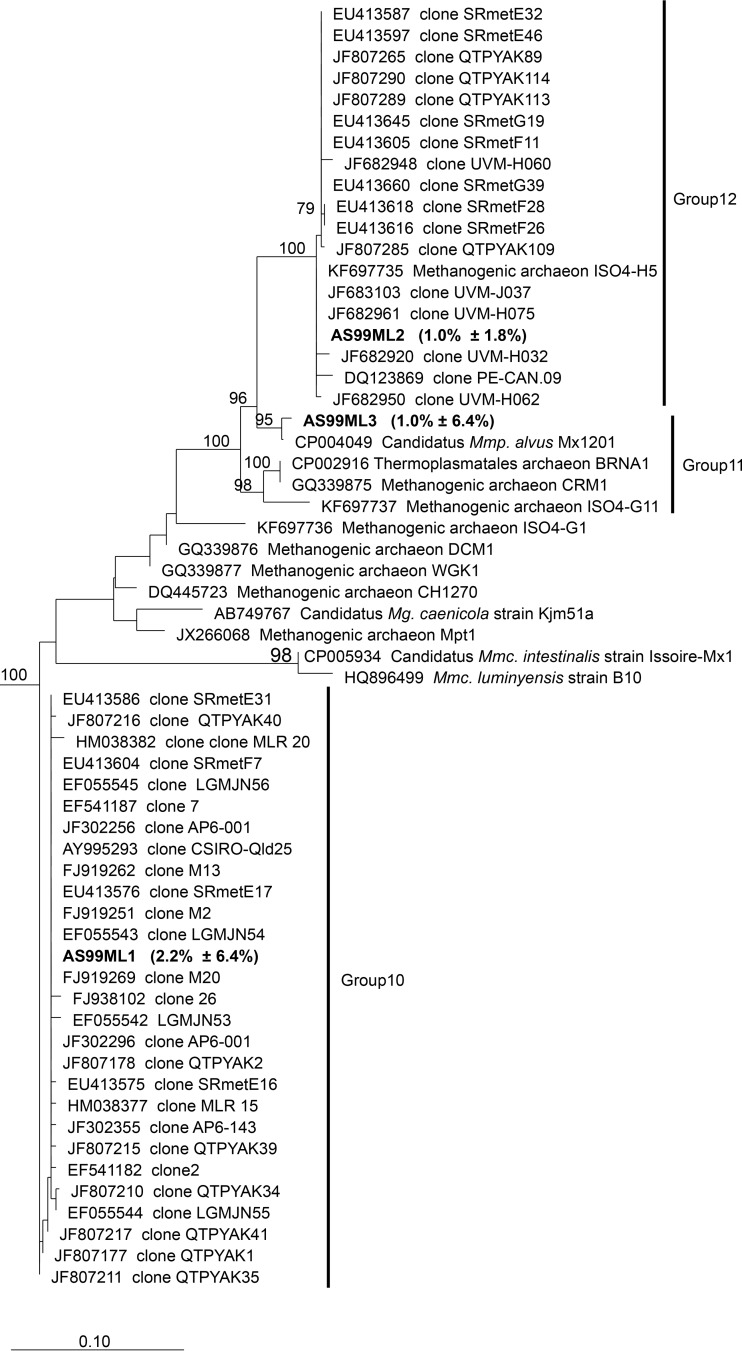
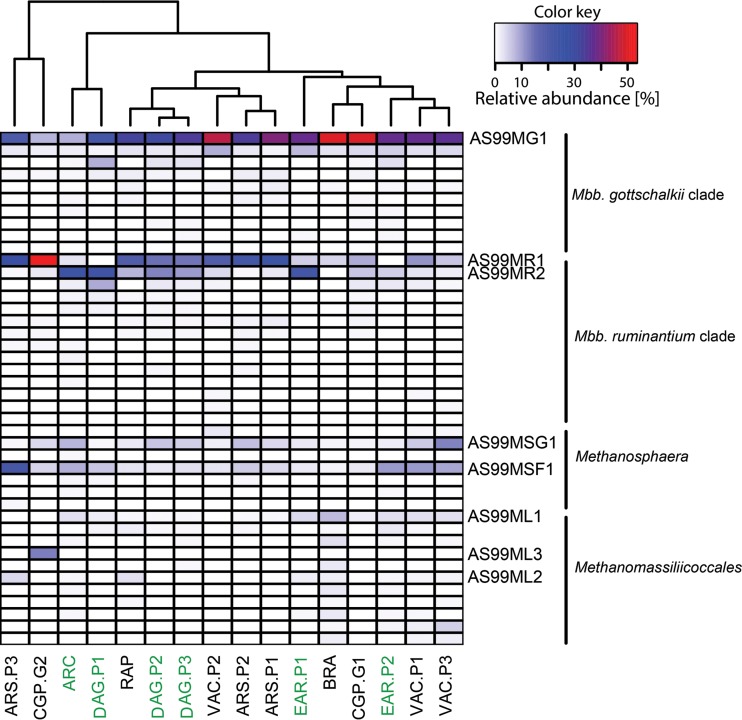
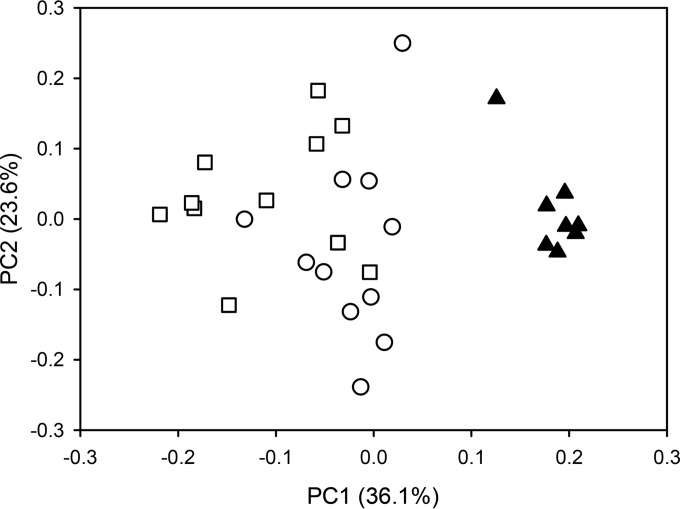
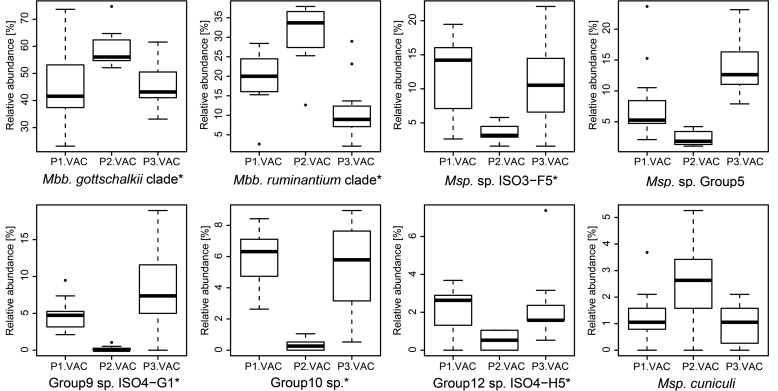
Sequencing and analyses of 16S rRNA gene amplicons were performed to estimate the composition of the rumen methanogen community in 252 samples from eight cohorts of sheep and cattle, separated into 16 different sample groups by diet, and to determine which methanogens are most prominent in the rumens of farmed New Zealand ruminants. Methanobacteriales (relative abundance ± standard deviation, 89.6% ± 9.8%) and Methanomassiliicoccales (10.4% ± 9.8%) were the two major orders and contributed 99.98% (±0.1%) to the rumen methanogen communities in the samples. Sequences from Methanobacteriales were almost entirely from only four different species (or clades of very closely related species). Each was detectable in at least 89% of the samples. These four species or clades were the Methanobrevibacter gottschalkii clade and Methanobrevibacter ruminantium clade with a mean abundance of 42.4% (±19.5% standard deviation) and 32.9% (±18.8%), respectively, and Methanosphaera sp. ISO3-F5 (8.2% ± 6.7%) and Methanosphaera sp. group5 (5.6% ± 5.7%). These four species or clades appeared to be primarily represented by only one or, in one case, two dominant sequence types per species or clade when the sequences were grouped into operational taxonomic units (OTUs) at 99% sequence identity. The mean relative abundance of Methanomassiliicoccales in the samples was relatively low but exceeded 40% in some of the treatment groups. Animal feed affected the apparent methanogen community structure of both orders, as evident from differences in relative abundances of the major OTUs in animals under different feeding regimens.


Figures

FIG 1
FIG 1
Phylogeny of Methanobacteriales isolates and highly abundant Methanobacteriales OTUs. Representative sequences of highly abundant OTUs (AS99MG1, AS99MR1, AS99MR2, AS99MSF1, and AS99MSG1) were aligned to the ARB database, version 111, using SINA-aligner (26). Phylogenetic analysis was performed on the V6-to-V8 region of the 16S rRNA gene of the aligned OTUs and 34 Methanobacteriales strains and enrichment cultures from intestinal environments. The tree was resampled 500 times, and only bootstrap values of ≥70% are shown. The dendrogram was rooted with five Methanopyrus sequences. The scale bar indicates 0.10 inferred nucleotide substitutions per position. Mbb., Methanobrevibacter; Msp., Methanosphaera.
FIG 2
FIG 2
Phylogeny of Methanomassiliicoccales sequences and highly abundant Methanomassiliicoccales OTUs. Representative sequences of highly abundant OTUs (AS99ML1, AS99ML2, and AS99ML3) were aligned to the ARB database, version 111, using SINA-aligner (26). Fifty-seven sequences of group10, group11, and group12 and of isolates and enrichment cultures were selected in RIM-DB (14). Phylogenetic analysis was performed on the V6-to-V8 region of the 16S rRNA gene of the aligned OTUs and selected database sequences. The tree was resampled 500 times, and only bootstrap values of ≥70% are shown. The dendrogram was rooted with five Methanopyrus sequences. The scale bar indicates 0.10 inferred nucleotide substitutions per position. Mmc., Methanomassiliicoccus; Mmp., Methanomethylophilus; Mg., Methanogranum.
FIG 3
FIG 3
Hierarchical clustering of sample groups based on the mean of the relative abundance of each OTU in each sample group. Samples were rarefied to 190 reads, and only OTUs with a mean relative abundance of at least 0.02 were included. These OTUs were 10 Methanobrevibacter gottschalkii clade OTUs, 14 Methanobrevibacter ruminantium clade OTUs, seven Methanosphaera OTUs, and 11 Methanomassiliicoccales OTUs. Names of animal cohorts are shown below the heat map, with the color of the font indicating the host species (green = cow, black = sheep). Heat map colors represent relative abundance of OTUs (in percent).
FIG 4
FIG 4
Effects of diet on methanogen community structure. A principal coordinate analysis plot of Bray-Curtis dissimilarities is shown. The open circles represent samples taken in period 1 (sample group P1.VAC), when sheep were fed lucerne chaffage; the closed triangles represent samples from the same sheep taken in period 2 (P2.VAC), when they were fed pasture; and the open squares represent samples from these animals in period 3 (P3.VAC), when they had been fed lucerne chaffage again. Samples were rarefied to 190 reads, and calculations of Bray-Curtis-dissimilarities were performed on OTU tables where OTUs had had been summarized to the species level.
FIG 5
FIG 5
Effect of diet on the relative abundance of methanogens. Shown are changes in the relative abundance of methanogens during serial treatments with different feeds (P1.VAC, lucerne chaffage; P2.VAC, pasture; P3.VAC, lucerne chaffage). Asterisks after the species names indicate species that are statistically significantly different between P2.VAC and the two other periods, determined by one-way ANOVA followed by a Tukey HSD post hoc test (P < 0.05).

References

    1. Yusuf RO, Noor ZZ, Abba AH, Hassan MAA, Din MFM. 2012. Methane emission by sectors: a comprehensive review of emission sources and mitigation methods. Renew Sustain Energy Rev 16:5059–5070. doi:10.1016/j.rser.2012.04.008. - DOI
    1. Clark H, Kelliher F, Pinares-Patino C. 2011. Reducing CH4 emissions from grazing ruminants in New Zealand: challenges and opportunities. Asian Australas J Anim Sci 24:295–302. doi:10.5713/ajas.2011.r.04. - DOI
    1. Joblin KN. 2005. Methanogenic archaea, p 47–53. In Makkar HPS, McSweeney CS (ed), Methods in gut microbial ecology for ruminants. Springer, Dordrecht, The Netherlands.
    1. Janssen PH, Kirs M. 2008. Structure of the archaeal community of the rumen. Appl Environ Microbiol 74:3619–3625. doi:10.1128/AEM.02812-07. - DOI - PMC - PubMed
    1. Iino T, Tamaki H, Tamazawa S, Ueno Y, Ohkuma M, Suzuki K, Igarashi Y, Haruta S. 2013. Candidatus Methanogranum caenicola: a novel methanogen from the anaerobic digested sludge, and proposal of Methanomassiliicoccaceae fam. nov. and Methanomassiliicoccales ord. nov., for a methanogenic lineage of the class Thermoplasmata. Microbes Environ 28:244–250. doi:10.1264/jsme2.ME12189. - DOI - PMC - PubMed

Publication types

LinkOut - more resources