. 2014 Nov 20;159(5):1015-1026.
doi: 10.1016/j.cell.2014.10.025. Epub 2014 Nov 13.

Genetic variation in human DNA replication timing

Affiliations

Genetic variation in human DNA replication timing

Amnon Koren et al. Cell. .

Abstract

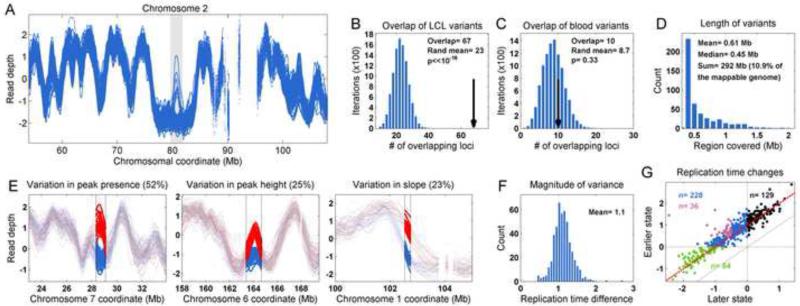
Genomic DNA replicates in a choreographed temporal order that impacts the distribution of mutations along the genome. We show here that DNA replication timing is shaped by genetic polymorphisms that act in cis upon megabase-scale DNA segments. In genome sequences from proliferating cells, read depth along chromosomes reflected DNA replication activity in those cells. We used this relationship to analyze variation in replication timing among 161 individuals sequenced by the 1000 Genomes Project. Genome-wide association of replication timing with genetic variation identified 16 loci at which inherited alleles associate with replication timing. We call these "replication timing quantitative trait loci" (rtQTLs). rtQTLs involved the differential use of replication origins, exhibited allele-specific effects on replication timing, and associated with gene expression variation at megabase scales. Our results show replication timing to be shaped by genetic polymorphism and identify a means by which inherited polymorphism regulates the mutability of nearby sequences.


Figures

Figure 1
Figure 1. DNA replication timing varies among individuals at specific loci
A. FACS-sorting cells by DNA content enables analysis of DNA copy number (by whole-genome sequencing) in G1 and S phase cells (adapted from Koren et al., 2012). B. Analysis of the ratio of DNA copy number between S- and G1-phase cells along each chromosome allows the construction of replication timing profiles; early-replicating loci have a higher average copy number in S phase cells relative to late-replicating loci. Cells from different individuals show consistent replication timing programs across most of their genomes. In this and all subsequent figures, replication timing (and read depth) data are normalized to have a genome-wide mean of zero and standard deviation of one; the y-scale thus represents z-score units. C. A genomic locus (gray shading) exhibits inter-individual variation in DNA replication timing, with only three of the six individuals exhibiting a replication origin peak structure at this locus. Black lines: smoothed replication profiles. D. An overlay of replication profiles from two individuals reveals a locus with variation in origin activity. E. The local distribution of replication timing measurements across many adjacent data windows allows statistical detection of replication timing variants. The example depicts the distributions in the genomic region shown in panel D. F-G. Replication variants in which a replication origin (or origin cluster) is active in some individuals but inactive in others, as inferred from the presence or absence of a peak in the replication profiles. H-I. Replication variants in which the average utilization or activation time of a replication origin varies among individuals, as inferred from differences in peak height.
Figure 2
Figure 2. DNA replication activity is visible in sequence data from the 1000 Genomes Project. See also Figures S1 and S2
A. Long-range fluctuations in read depth along chromosomes follow the DNA replication profile in DNA derived from cultured cells but not in DNA derived from blood. Shown are smoothed, z-normalized read depth profiles of genomic DNA from four 1000 Genomes samples derived from LCLs (red) and one DNA sample derived from blood (grey), along with the LCL replication timing profile (blue). B. Read depth is correlated with DNA replication timing to varying extents in different samples (as expected from samples with different proportions of cells in S phase), but is not correlated with GC content. Shown are partial correlations of (unsmoothed) read depth with replication timing (top) and with GC content (bottom), in each case controlling for the other variable (see Figure S1 for complete correlations and sample annotations). Each column corresponds to one of 946 individuals sequenced in the 1000 Genomes Project, sorted by their correlation between read depth and replication timing. Read depth in genomic DNA from blood samples did not correlate with replication timing. C. DNA replication timing is the major influence on read depth variation among LCL samples, as determined by principal component analysis. Each circle represents one of 882 LCL samples; color indicates the correlation of read depth with replication timing. D. The coefficients (chromosomal loadings) of the first principal component (in D) correspond to the DNA replication timing profile. E. A biological signature of the unstructured, “random” replication of inactive X chromosomes from females (Koren and McCarroll, 2014) is apparent in read depth. Inter-individual correlations of read depth along the genome of 161 individuals (see text) are reduced on the X-chromosome when comparisons involve a female sample. F. Sequencing of DNA from embryonic stem cells (ESCs) identifies ESC-specific replication timing profiles. Shown are read depth profiles of ESCs and LCLs derived from whole-genome sequencing, along with the corresponding S/G1 replication timing profiles . ESC replication timing data is from Ryba et al., 2013. G. Read depth and replication timing closely track each other within a given cell type (ESC or LCL), and equally distinguish between cell types. Quantitative genome-wide comparison of read depth and replication profiles of ESCs and LCLs (two profiles of each are shown). LCL replication timing is from this study (profile 1) and Ryba et al., 2010 (profile 2). ESC replication timing data is from Ryba et al., 2010. RD: read depth; RT: replication timing.
Figure 3
Figure 3. Variation in DNA replication timing is common in the human population. See also Figure S4
A. Patterns of read-depth variation among 1000 Genomes individuals indicate the presence of a polymorphic replication origin (grey shaded area ). This is the same replication variant shown in Figure 1C as variable in replication timing in the six individuals. B. Candidate replication variants identified in the population-based analysis of whole-genome sequence data from the 1000 Genome Project significantly overlap with replication variants identified from direct S/G1 replication profiling of six individuals. Black arrow: number of overlapping variants; blue bars: number of overlapping variants in 10,000 permutations of variant locations. C. Loci with the greatest variation in read depth among blood-derived DNA samples from the 1000 Genomes Project did not significantly overlap with variants identified by replication profiling. D. Replication variants collectively cover more than 10% of the mappable human genome. Shown is the length distribution of genomic regions affected by replication variants. E. Forms of replication variation. The frequency of each variant type is indicated. F. The size distribution of replication variants (average replication timing / read depth differences between the early and late replication state in each variant). G. Comparison of the replication timing of the early and late states in each individual replication variant locus. Red line: replication difference of 1 std; black dots: shifts between early and earlier replication; blue dots: shifts between early and late replication (purple dots are loci that shift from under -0.5 to over 0.5, i.e. the most significant changes between early and late replication); green dots: shifts between late and later replication.
Figure 4
Figure 4. Replication timing quantitative trait loci (rtQTLs)
Genetic variants underlie differences in DNA replication timing among individuals. Shown are three examples of replication variants with significant genetic association (additional examples are in Figure 5 and Figure S5). A. Variation in replication timing of a specific locus is strongly associated with SNPs that map within the locus itself. Shown are Manhattan plots of genome-wide association of genetic variants with replication timing. Red arrow: genomic location of the tested replication variant region. Black dashed line: genome-wide association significance threshold. B. Detailed genetic associations in replication variant regions (dots; right axis) along with replication (read depth) profiles (left axis) for individuals with each of the three genotypes of the most strongly associated SNPs. Yellow dots denote rtQTL SNPs that were also eQTLs for a nearby gene. C. Left panels: distribution of read depth for individuals with each of the genotypes of the SNP most strongly associated with each variant. Right panels: droplet digital PCR (ddPCR) analysis confirms that the allele associated with early replication is also over-represented in genomic DNA from heterozygous individuals, consistent with a cis-acting, allele-specific effect on DNA replication timing.
Figure 5
Figure 5. rtQTLs involve variable use of replication origins and exert long-range effects on replication timing. See also Figure S5
rtQTLs involve associations with sets of markers in the immediate vicinity of replication origins, and affect the replication timing of megabases of surrounding DNA. Plots are as in Figure 4B. The lower graphs in each panel (bold black line) show that replication timing differences gradually decrease with distance from rtQTL loci. Supplementary Figure S5 shows a zoomed-in version of all association results, as well as an additional two rtQTL loci that were not clearly associated with replication origins .
Figure 6
Figure 6. Replication timing associates with gene expression levels. See also Figures S6 and S7
Individuals whose genomes exhibit earlier replication at a replication variant locus also tend to exhibit higher average expression of genes across the entire zone of replication. A. Correlations between expression levels and replication timing, for the subset of rtQTL loci affecting the replication timing of expressed genes (16 of the 20 rtQTL loci), across 53 individuals, for each gene within the rtQTL-implicated replication variant regions. Dashed black lines: replication variant region borders; red lines: rtQTL association region. B. The correlation between replication timing and gene expression decreases as a function of gene distance from the rtQTL SNPs. C. The distribution of correlations between replication timing and gene expression across individuals, for all replication variants that contained expressed genes.
Figure 7
Figure 7. An rtQTL at the JAK2 locus
A common allele at a SNP downstream of JAK2, previously associated with increased JAK2 mutation rates, is also associated with very early replication (higher peak) of an adjacent origin in an early replicating fragile site (ERFS) region. JAK2 (dashed vertical lines) is transcribed towards the inferred replication origin (the peak). The heights of the black points show the level of association of SNPs to the replication timing of this locus, on the scale shown on the right. Diagram on the bottom depicts the location and transcriptional orientation of JAK2 compared to the direction of replication fork progression from the nearby origin.

Comment in

References

    1. Aird D, Ross MG, Chen WS, Danielsson M, Fennell T, Russ C, Jaffe DB, Nusbaum C, Gnirke A. Analyzing and minimizing PCR amplification bias in Illumina sequencing libraries. Genome Biology. 2011;12:R18. - PMC - PubMed
    1. Barlow JH, Faryabi RB, Callen E, Wong N, Malhowski A, Chen HT, Gutierrez-Cruz G, Sun H-W, McKinnon P, Wright G, Casellas R, Robbiani DF, Staudt L, Fernandez-Capetillo O, Nussenzweig A. Identification of Early Replicating Fragile Sites that Contribute to Genome Instability. Cell. 2013;152:620–632. - PMC - PubMed
    1. Deem A, Keszthelyi A, Blackgrove T, Vayl A, Coffey B, Mathur R, Chabes A, Malkova A. Break-Induced Replication Is Highly Inaccurate. PLoS Biol. 2011;9:e1000594 EP. - PMC - PubMed
    1. Degner JF, Pai AA, Pique-Regi R, Veyrieras J-B, Gaffney DJ, Pickrell JK, De Leon S, Michelini K, Lewellen N, Crawford GE, Stephens M, Gilad Y, Pritchard JK. DNaseI sensitivity QTLs are a major determinant of human expression variation. Nature. 2012;482:390–394. - PMC - PubMed
    1. Dimitriadou E, Van der Aa N, Cheng J, Voet T, Vermeesch JR. Single cell segmental aneuploidy detection is compromised by S phase. Mol Cytogenet. 2014;7:46. - PMC - PubMed

Publication types