. 2014 Nov 20;159(5):1168-1187.
doi: 10.1016/j.cell.2014.10.044.

Unraveling the biology of a fungal meningitis pathogen using chemical genetics

Affiliations

Unraveling the biology of a fungal meningitis pathogen using chemical genetics

Jessica C S Brown et al. Cell. .

Abstract

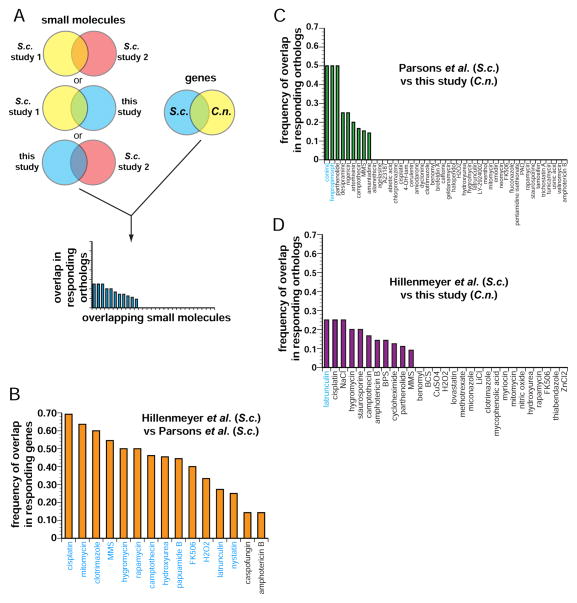
The fungal meningitis pathogen Cryptococcus neoformans is a central driver of mortality in HIV/AIDS. We report a genome-scale chemical genetic data map for this pathogen that quantifies the impact of 439 small-molecule challenges on 1,448 gene knockouts. We identified chemical phenotypes for 83% of mutants screened and at least one genetic response for each compound. C. neoformans chemical-genetic responses are largely distinct from orthologous published profiles of Saccharomyces cerevisiae, demonstrating the importance of pathogen-centered studies. We used the chemical-genetic matrix to predict novel pathogenicity genes, infer compound mode of action, and to develop an algorithm, O2M, that predicts antifungal synergies. These predictions were experimentally validated, thereby identifying virulence genes, a molecule that triggers G2/M arrest and inhibits the Cdc25 phosphatase, and many compounds that synergize with the antifungal drug fluconazole. Our work establishes a chemical-genetic foundation for approaching an infection responsible for greater than one-third of AIDS-related deaths.


Figures

Figure 1
Figure 1. Chemical-genetic profiling of C. neoformans
A) Heat map of full dataset following hierarchical clustering. Compounds are arrayed on the x-axis and gene knockouts on the y-axis. See also Tables S1–S2. B) Probability density function for pairwise correlation scores between the chemical genetic profiles of different compounds (grey) and the same compounds at different concentrations (purple) screened on different days (different batches).Scores between the chemical-genetic profiles of different concentrations of the same compounds are significantly higher than those between different compounds (Wilcoxon test, p = 2.7 × 10−176). See also Fig. S1. C) Probability density function for pairwise correlation scores between the chemical genetic profiles of different compounds (grey) and azole family compounds (purple). Pairwise comparisons between azoles exhibit higher correlation scores than non-azole compounds (Wilcoxon test, p = 2.8 × 10⁻⁶). Molecules with the highest pairwise comparisons scores are listed on the right. D) Pearson’s correlation score between two different concentrations of the same compounds. Concentrations with similar correlation scores are binned together (y-axis). For compounds with the greatest correlation scores between concentrations, Venn diagrams of significant genes (Z < −2.5) present in profiles from the same compounds at different concentrations and the small molecule structure are shown. The orange line indicates a hypergeometric p-value ≤ 0.05 E) Distribution of the number of significant phenotypes for each knockout mutant. Significant is considered |Z| > 2.5 and we identified significant phenotypes independently for each small molecule concentration. Knockout mutants with similar numbers of significant phenotypes are binned together (x-axis). F) Distribution of the number of significant phenotypes (|Z| > 2.5) for each small molecule condition/concentration. Molecules with similar numbers of significant phenotypes were binned together (x-axis) and the # phenotypes per bin is shown on the y-axis. Bin range on the x-axis is 0, 1–5, 6–10, etc. See also Fig. S1 and Tables S1–5.
Figure 2
Figure 2. Determinants of compound sensitivity
We calculated whether molecules elicited a significant response from C. neoformans ORFs that are enriched for association with specific GO terms. Terms are listed on the y-axis and the number of compounds whose responding gene knockouts associated with that GO term are listed on the x-axis. See also Table S6.
Figure 3
Figure 3. Chemical-genetic signatures of C. neoformans genes differ from orthologous S. cerevisiae genes
A) Flowchart of computation process for comparing datasets. We identified C. neoformans and S. cerevisiae orthologous genes that were present in all datasets, then compared the responses of only those genes in all the datasets. We compared genes whose knockout mutants significantly (|Z| > 2.5) responded to compound that were common in at least two of the datasets. B) Comparison between Parsons et al. and Hillenmeyer et al., comparing the response (|Z| > 2.5) of genes that have orthologs present in the C. neoformans dataset. Compounds whose profiles exhibit significant overlaps (p < 0.05) are labeled in blue. C) Comparison between our dataset and Parsons et al. Compounds whose profiles exhibit significant overlaps (p < 0.05) are labeled in blue. D) Comparison between our dataset and Hillenmeyer et al. Compounds whose profiles exhibit significant overlaps (p < 0.05) are labeled in blue.
Figure 4
Figure 4. Chemical-genetic profiling identifies genes involved in capsule biosynthesis
A) Cluster containing the chemical signatures of the pbx1Δ and cpl1Δ mutants. B) Cluster containing the chemical signatures of the cap60Δ mutants. C) Images of individual cells grown in 10% Sabouraud’s broth to induce capsule. Representative cells are shown for mutants that exhibit a statistically significant phenotype. Scale bar represents 5 μm. D) Quantification of capsule sizes from all mutants in pbx1Δ/cpl1Δ (purple labels) cluster or cap60Δ(green labels) cluster. 100 cells were measured for each strain, the error bars represents the standard deviation, and p-values were calculated using Student’s t-test. E) Colony counts from colony forming units (cfu) extracted from mouse lungs following an inhalation infection. Three mice are shown for each datapoint; the error bars represent the standard deviation and p-values were calculated using Student’s t-test.
Figure 5
Figure 5. C. neoformans Cdc25 is a target of S8 in vivo and in vitro
A) Chemical-genetic data of the growth scores of each knockout mutant grown on S8 (y-axis). The mutant that exhibited the greatest resistance is wee1Δ. The mutant strain that showed the greatest sensitivity to S8 is cnag_04462Δ. B) Structures of S8, NA8, and NSC 663284. The structure of S10 is shown in Fig. S3C. C) G2/M regulation (Morgan, 2007). D) DNA content of asynchronous C. neoformans culture split into aliquots for treatment with compounds of interest, with samples harvested at appropriate times. Data for DMSO-treated culture is shown. E) DNA content from NA8-treated culture from same starting culture as Fig. 5F. F) DNA content from S8-treated culture from same starting culture as Fig. 5F. G) Phosphatase activity of purified C. neoformans Cdc25 catalytic domain (CNAG_01572, aa442–662). H) Michaelis-Menten kinetics of S8 inhibition of CnCdc25 from in vitro phosphatase activity. A noncompetitive model of enzyme inhibition produced the best R2 value (0.94).
Figure 6
Figure 6. O2M approach for predicting compound synergy
A) Approach for predicting compound synergistic interaction. B) FICI values for fluconazole (FLC). Predicted synergistic compounds are labeled in purple and known synergistic compounds in green. Bars represent the average of two assays but both had to be FICI < 0.5 to be considered synergistic. Compounds labeled in blue are negative controls from one of two categories: 1) predicted to synergize with geldanamycin (GdA) but not FLC or 2) randomly generated list of compounds not predicted to be synergistic with either FLC or GdA. Yellow bars represent an FICI < 0.5 (synergistic) and blue bars and FICI ≥ 0.5 (not synergistic). C) FICI values for GdA. Labels and colors are analogous to those in part B. D) Contingency table of synergistic vs non-synergistic interactions with FLC. p < 0.0008 (Fisher’s exact test). E) Contingency table of synergistic vs non-synergistic interactions with GdA. p < 0.0008 (Fisher’s exact test).

References

    1. Altschul SF, Madden TL, Schaeffer AA, Zhang J, Zhang Z, Miller W, Lipman DJ. Gapped BLAST and PSI-BLAST: a new generation of protein database search programs. Nucleic Acids Res. 1997;25:3389–3402. - PMC - PubMed
    1. Anderson JB. Evolution of antifungal-drug resistance: mechanisms and pathogen fitness. Nature Reviews Microbiology. 2005;3:547–556. - PubMed
    1. Armstrong-James D, Meintjes G, Brown GD. A neglected epidemic: fungal infections in HIV/AIDS. Trends Microbiol. 2014;22:120–127. - PubMed
    1. Baryshnikova A, Costanzo M, Kim Y, Ding H, Koh J, Toufighi K, Youn JY, Ou J, San Luis BJ, Bandyopadhyay S, et al. Quantitative analysis of fitness and genetic interactions in yeast on a genome scale. Nat Meth. 2010;7:1017–1024. - PMC - PubMed
    1. Broek D, Bartlett R, Crawford K, Nurse P. Involvement of p34cdc2 in establishing the dependency of S phase on mitosis. Nature. 1991;349:388–393. - PubMed

Publication types

MeSH terms