. 2014 Nov 20;159(5):1200-1211.
doi: 10.1016/j.cell.2014.10.043.

An integrated approach reveals regulatory controls on bacterial translation elongation

Affiliations

An integrated approach reveals regulatory controls on bacterial translation elongation

Arvind R Subramaniam et al. Cell. .

Abstract

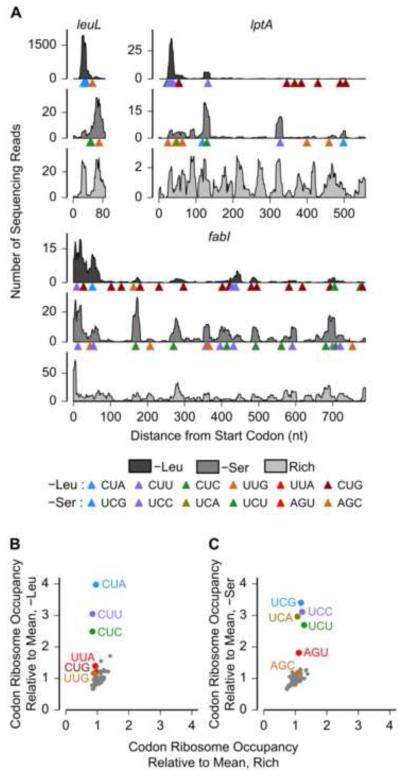
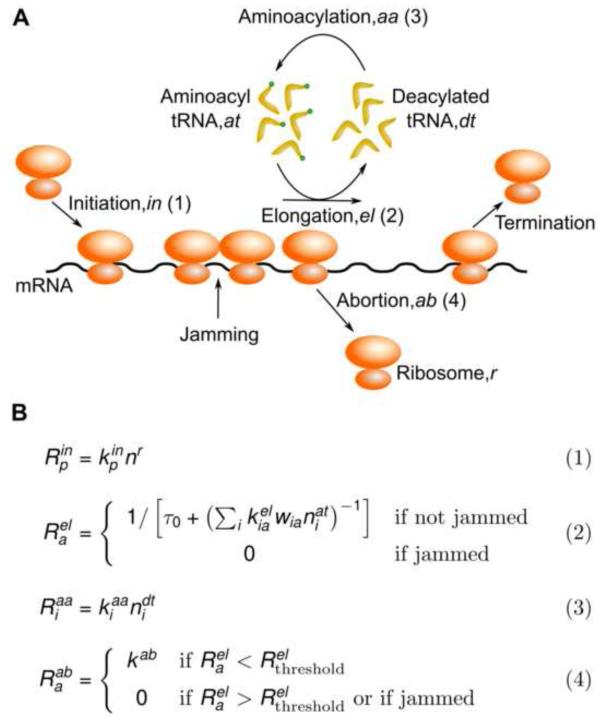
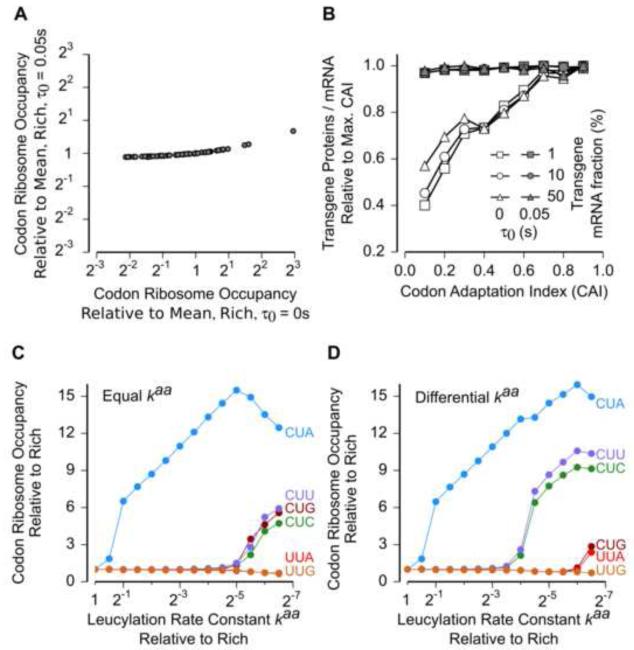
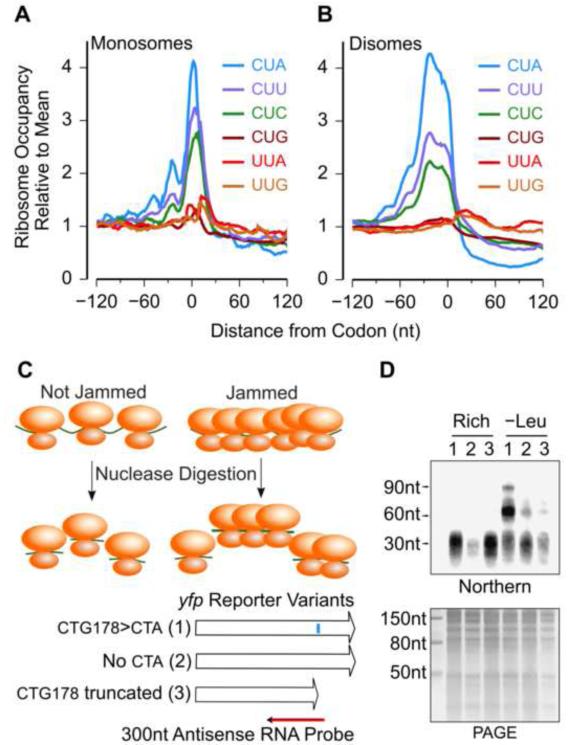
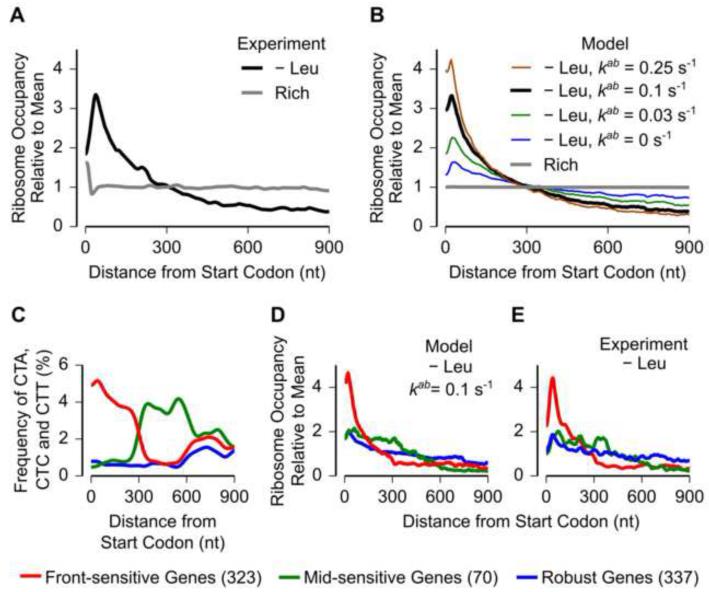
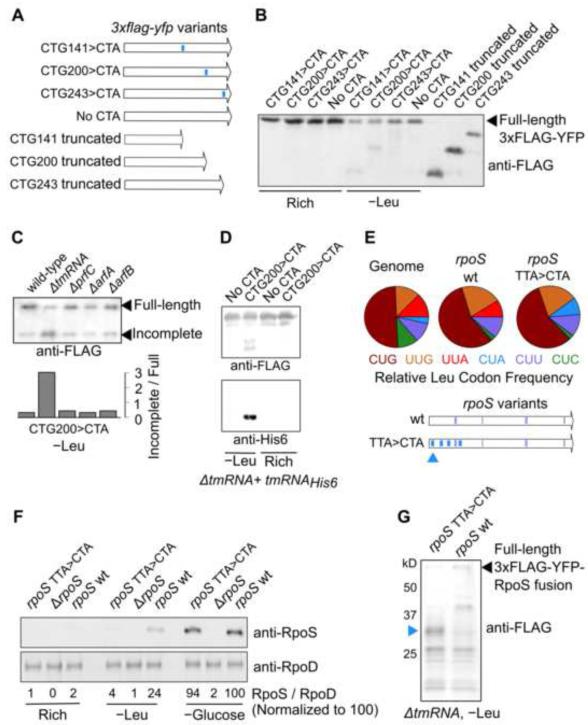
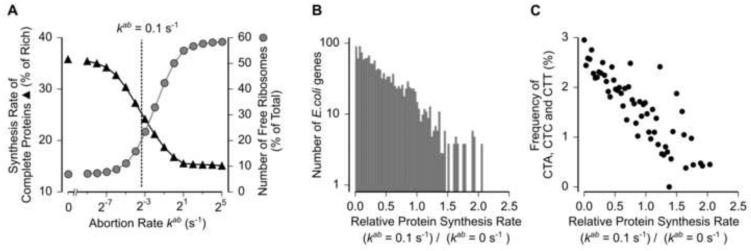
Ribosomes elongate at a nonuniform rate during translation. Theoretical models and experiments disagree on the in vivo determinants of elongation rate and the mechanism by which elongation rate affects protein levels. To resolve this conflict, we measured transcriptome-wide ribosome occupancy under multiple conditions and used it to formulate a whole-cell model of translation in E. coli. Our model predicts that elongation rates at most codons during nutrient-rich growth are not limited by the intracellular concentrations of aminoacyl-tRNAs. However, elongation pausing during starvation for single amino acids is highly sensitive to the kinetics of tRNA aminoacylation. We further show that translation abortion upon pausing accounts for the observed ribosome occupancy along mRNAs during starvation. Abortion reduces global protein synthesis, but it enhances the translation of a subset of mRNAs. These results suggest a regulatory role for aminoacylation and abortion during stress, and our study provides an experimentally constrained framework for modeling translation.


Figures

Figure 1
Figure 1
Change in Ribosome Occupancy upon Starvation for a Single Amino Acid. (A) Measured ribosome occupancy along three E. coli genes: leuL, lptA and fabI during leucine starvation (–Leu), serine starvation (–Ser) and amino acid rich growth (Rich). The horizontal axis extends from the start codon to the stop codon for each gene. Triangles indicate the positions of leucine (serine) codons along the coding sequence in the leucine (serine) starvation case. (B, C) Measured ribosome occupancy at the 61 sense codons averaged across the transcriptome. Start and stop codons are not shown. Standard errors of mean are smaller than data markers. See also Figure S1.
Figure 2
Figure 2
A Transcriptome-scale Biophysical Model of Translation. (A) Schematic of the four cellular processes modeled (initiation, elongation, aminoacylation, abortion) and the molecular species considered in the biophysical model. (B) Reaction rates, Ri, for the cellular processes shown in (A). The superscripts following Ri refer to the abbreviations for the cellular processes in (A). Subscript indices are used for distinct molecular species of the same kind (mRNA – p, tRNA – i, codon – a). The intracellular concentrations of molecular species and the values for rate constants in our whole-cell simulation are in Table S1. See also Data S1.
Figure 3
Figure 3
Elongation and Aminoacylation Kinetics Determine Ribosome Occupancy at Codons. (A) Mean ribosome occupancy at the 61 sense codons averaged across the transcriptome during nutrient-rich growth calculated from whole-cell model. Simulations were run with the time for intra-ribosomal events at a single codon, τ0, set to either 0 s (horizontal) or 0.05 s (vertical). The value of kel was chosen such that the mean elongation rate of ribosomes Rel was approximately equal to the experimentally measured value of 20 s−1 in both cases. (B) Amount of transgene proteins produced per mRNA upon overexpression during nutrient-rich growth calculated from whole-cell model as a function of codon adaptation index (CAI) and the transgene fraction. All data points corresponding to a single transgene mRNA fraction were normalized by the data point at CAI = 0.9. (C, D) Mean ribosome occupancy at the six leucine codons as a function of leucylation rate constant calculated from whole-cell model. The leucylation rate constants of the five leucine tRNA isoacceptors were set either equal (C) or different (D). In the differential case (D), the leucylation rate constants were in the proportion 1.5: 0.5: 1: 0.5: 0.5 (Leu1 through Leu5). See also Figure S2.
Figure 4
Figure 4
Ribosome Traffic Jams at Ribosome Pause Sites. (A) Measured monosome occupancy from −120 nt to +120 nt around the six leucine codons during leucine starvation. The monosome occupancy was averaged across all occurrences of each codon in the transcriptome. (B) Measured disome occupancy from −120 nt to +120 nt around the six leucine codons during leucine starvation. The disome occupancy was averaged across all occurrences of each codon in the transcriptome. (C) Nuclease footprinting assay for detecting ribosome traffic jams on yfp reporter mRNAs. The blue vertical bar along the first variant indicates the location of the CTG200>CTA substitution. Northern blotting was performed using a 32P-labeled antisense RNA complementary to the 300 nt mRNA region from −250 nt to +50 nt of the CTG200>CTA substitution. (D) Upper panel: Northern blot of nuclease-digested polysomes for the three yfp variants; Lower panel: Polyacrylamide gel corresponding to the Northern blot. Numbers above individual lanes correspond to the three yfp variants in (C). The size markers on the left of the Northern blot were inferred by aligning it to the polyacrylamide gel image. The arrows at 30 nt, 60 nt and 90 nt indicate the approximate locations of monosomes, disomes and trisomes respectively. See also Figure S3.
Figure 5
Figure 5
Translation abortion determines the distribution of ribosomes along mRNAs during amino acid starvation. (A) Measured ribosome occupancy along mRNAs averaged across the transcriptome (1518 genes). (B) Ribosome occupancy along mRNAs averaged across the transcriptome (1518 genes) calculated from the whole cell model. The abortion rate constant kab was varied. Leucine starvation was modeled as a constant 100-fold reduction in the leucylation rate constant, kaa, Leu. (C) Codon frequency of the three leucine codons, CTA, CTC and CTT, in three sets of genes (red, green, blue) with different intragenic distributions of these codons. The number of genes in each class is shown in parentheses in the legend. The codon frequency distribution was smoothed using a Gaussian window of 30 nt width. (D) Ribosome occupancy averaged across the three sets of genes during leucine starvation calculated from the whole-cell model. (E) Measured ribosome occupancy averaged across the three sets of genes during leucine starvation. Ribosome occupancy profiles in all panels were smoothed using a sliding window of 30 nt. Each ribosome occupancy profile was normalized to have a mean value of 1. See also Figure S4.
Figure 6
Figure 6
Translation abortion and its effectors during amino acid starvation. (A) Schematic of 3xflag-yfp reporter variants with either single CTG>CTA substitutions (indicated in blue) or truncated at one of three locations. (B) Western blot using Anti-FLAG antibody for the 3xflag-yfp variants shown in (A). (C) Western blot with Anti-FLAG antibody of the CTG200>CTA variant of yfp during leucine starvation in strains with deletion of one of four different genes encoding factors that mediate translation abortion (tmRNA, prfC, arfA, arfB). ‘Wild-type’ refers to the parent leucine auxotroph strain. The lower panel indicates the densitometric ratio of these two bands. (D) Upper panel – Immunoprecipitation with Anti-FLAG antibody of CTG200>CTA yfp variant expressed during leucine starvation in a ΔtmRNA strain with a tmRNAHis6 mutant. Lower panel – tmRNAHis6 activity detected with an Anti-His6 antibody. (E) Pie charts – Relative frequency of the six leucine codons across all coding sequences in the genome, in the rpoS wild-type coding sequence, and in the rpoS synonymous variant. Four TTA codons were replaced by CTA codons in the rpoS synonymous variant at the locations indicated by thick blue bars. The thin blue and green bars correspond to the location of the CTC and CTT codons in the rpoS wt and synonymous variant. Blue triangle indicates the location of the first ribosome pause site encoded by the CTA codon during leucine starvation. (F) Western blot against the RpoS protein (upper panel) and RpoD protein (lower panel) during nutrient-rich growth, leucine starvation and glucose starvation. The rpoS wild-type coding sequence at the native chromosomal locus was either deleted (ΔrpoS) or replaced by the rpoS TTA>CTA synonymous variant without additional selection markers. Numbers between the two panels indicate the normalized densitometric ratio of the RpoS and RpoD bands for each lane. (G) Western blot with Anti-FLAG antibody against 3XFLAG-YFP-RpoS fusion proteins during leucine starvation. Approximate molecular weight in kilodaltons (kD) was estimated using a protein ladder. Blue triangle corresponds to the approximate location of the expected truncated peptide caused by ribosome abortion at the first pause site in the rpoS TTA>CTA synonymous variant [indicated as a blue triangle in (E)]. See also Figure S5 and Table S2.
Figure 7
Figure 7
Effect of Translation Abortion on Protein Expression. (A) Effect of varying abortion rate constant (kab) on the number of free ribosomes in the cell (grey circles) and the global synthesis rate of complete proteins (black triangles) during leucine starvation calculated from whole-cell model. The value kab = 0.1 s−1 that fits the measured ribosome occupancy (black line in Figure 5B) is indicated as a dashed line. (B) Effect of non-zero abortion rate constant on the synthesis rate of individual E. coli proteins during leucine starvation calculated from the whole-cell model. (C) Average frequency of the three leucine codons CTA, CTC and CTT for genes in each of the histogram bins in (B). Only genes with greater than ten leucine codons were considered in (B) and (C). See also Figure S6.

References

    1. Abo T, Ueda K, Sunohara T, Ogawa K, Aiba H. SsrA-mediated protein tagging in the presence of miscoding drugs and its physiological role in Escherichia coli. Genes Cells. 2002;7:629–638. - PubMed
    1. Andersson SG, Kurland CG. Codon preferences in free-living microorganisms. Microbiol. Rev. 1990;54:198–210. - PMC - PubMed
    1. Bilgin N, Ehrenberg M. Mutations in 23 S Ribosomal RNA Perturb Transfer RNA Selection and can Lead to Streptomycin Dependence. J. Mol. Biol. 1994;235:813–824. - PubMed
    1. Bordbar A, Monk J, King Z, Palsson B. Constraint-based models predict metabolic and associated cellular functions. Nat Rev Genet. 2014;15 - PubMed
    1. Bremer H, Dennis P. Modulation of Chemical Composition and Other Parameters of the Cell at Different Exponential Growth Rates. EcoSal Plus. 2008 - PubMed

Publication types

MeSH terms

Associated data