. 2014 Oct 23;159(3):530-42.
doi: 10.1016/j.cell.2014.09.026. Epub 2014 Oct 16.

Organelle-based aggregation and retention of damaged proteins in asymmetrically dividing cells

Affiliations

Organelle-based aggregation and retention of damaged proteins in asymmetrically dividing cells

Chuankai Zhou et al. Cell. .

Abstract

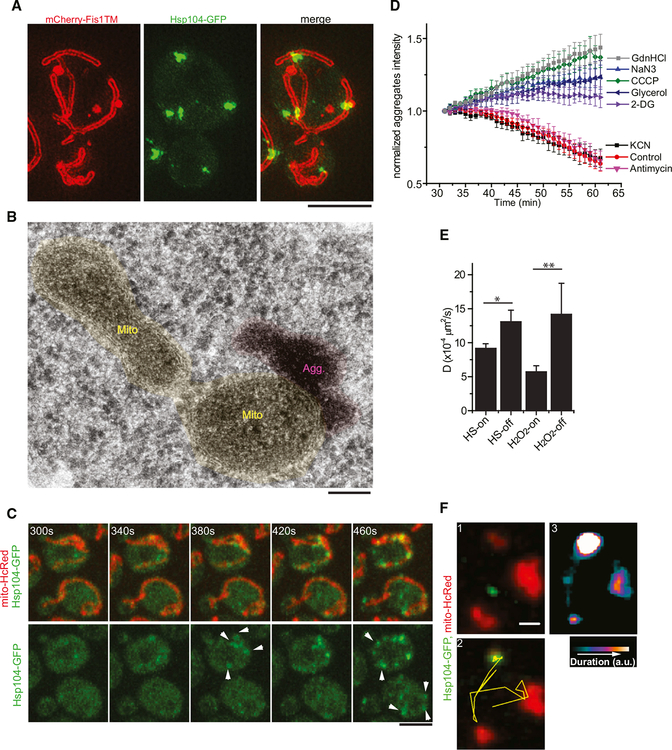
Aggregation of damaged or misfolded proteins is a protective mechanism against proteotoxic stress, abnormalities of which underlie many aging-related diseases. Here, we show that in asymmetrically dividing yeast cells, aggregation of cytosolic misfolded proteins does not occur spontaneously but requires new polypeptide synthesis and is restricted to the surface of ER, which harbors the majority of active translation sites. Protein aggregates formed on ER are frequently also associated with or are later captured by mitochondria, greatly constraining aggregate mobility. During mitosis, aggregates are tethered to well-anchored maternal mitochondria, whereas mitochondria acquired by the bud are largely free of aggregates. Disruption of aggregate-mitochondria association resulted in increased mobility and leakage of mother-accumulated aggregates into the bud. Cells with advanced replicative age exhibit gradual decline of aggregates-mitochondria association, likely contributing to their diminished ability to rejuvenate through asymmetric cell division.


Figures

Figure 1.
Figure 1.. Coaggregation of Cytosolic Misfolded Proteins with Newly Synthesized Polypeptides
(A) Sequential protein aggregation experiment in which cells expressing Hsp104-GFP from its endogenous promoter and mCh-Ubc9ts (briefly induced with Gal1 promoter) were treated for 10 min with A2C. After A2C washout, HS or H2O2 treatment was applied to induce aggregation of mCh-Ubc9ts. Top: experimental scheme and two possible outcomes; bottom: representative cell images from HS experiment. (B) Left: selected frames from a representative movie showing recruitment of cytosolic mCh-Ubc9ts to pre-existing A2C-induced aggregates (labeled with Hsp104-GFP) during HS. Right: quantification showing gradual depletion of cytosolic mCh-Ubc9ts, while aggregate-associated mCh-Ubc9ts signal increased. (C) Selected frames from the fluorescence recovery after photobleaching experiment in which A2C-treated cells with mCh-Ubc9ts were photobleached with a 561nm laser before being subjected to HS. Top: experimental scheme with two possible outcomes. Bottom: frames from a representative movie showing no accumulation of mCh-Ubc9ts fluorescence into A2C-induced Hsp104-GFP-containing aggregates upon HS. (D) Delayed mCh-Ubc9ts aggregation during heat shock. The culture of same strain as in (A) was heat shocked for indicated time at 42°C, and representative cells are shown. (E) Two possible pathways leading to recruitment of mCh-Ubc9ts to pre-existing aggregates. Possibility 1: misfolded GFP-Ubc9ts monomers directly add to existing aggregates. Possibility 2: misfolded GFP-Ubc9ts monomers first spontaneously form oligomers and then merge with existing aggregates. (F) Molecular brightness of diffusing GFP-Ubc9ts or GFP-luciferase species as a function of time during 42°C HS, as determined by FCS. Plots shown mean and SEM from >20 FCS runs from at least nine cells per time point for GFP-Ubc9ts or GFP-luciferase and >9 FCS runs from >3 cells for each time point for 1x and 2xGFP, used as controls for monomer or dimer brightness. Scale bar for all panels, 4 μm. Time stamps in (B) and (C) refer to time after temperature shift. See also Figure S1 and Movie S1.
Figure 2.
Figure 2.. Active Translation Is Required for Stress-Induced Protein Aggregation
(A) Sequential protein aggregation experiment in which cells of the same strain as in Figure 1A were first heat shocked at 42°C to induce mCh-Ubc9ts aggregates, followed by A2C treatment. Left: schematic and two possible outcomes. Right: selected frames from a time-lapse movie of A2C-induced aggregation. Arrowheads follow new Hsp104-GFP-labeled aggregates outside of existing aggregates. (B) Cycloheximide blocks protein aggregation induced by HS. Left: examples of cells with different treatment as indicated. Right: quantification of aggregate amounts from different treatments. WT, wild-type; CHXr, cycloheximide-resistant strain (Δrpl42a rpl42bP56Q); CHX, cycloheximide; DMSO, solvent control. Histogram shows the average (3–4 experiments, >80 cells per experiment) amount of aggregates per cell normalized to the DMSO control (set at 100%). Error bars show SEM. ***p < 0.001, **p < 0.01, *p < 0.05. (C) Aggregates induced by indicated stress conditions in the presence or absence of CHX. Left, representative images of cells. Right, quantification of aggregate amount as in (B). All scale bars, 2 μm. See also Figure S1 and Movie S2.
Figure 3.
Figure 3.. ER and Mitochondria Are Main Organelle Hosts for Protein Aggregation
(A) Representative SIM images showing association of protein aggregates (Hsp104-GFP) with ER (labeled with mCherry-tagged transmembrane domain of the ER protein Scs2) induced with 6 min HS at 42°C. (B) Thin-sectioning EM showing association of protein aggregates (magenta) with ER (blue) and mitochondria (yellow). (C) Fast confocal time-lapse imaging of HS-induced aggregate emergence (Hsp104-GFP) on the surface of ER (DsRed-HDEL). Arrows follow emerging aggregates and the time stamps indicate the time since start of the movie. (D) Representative pseudocolored three-channel confocal images showing simultaneous association of HS-induced aggregates (Hsp104-GFP) with ER (DsRed-HDEL) and mitochondria (mito-BFP). Images were taken after 6 min HS at 42°C, followed by 10 min recovery at 30°C. (E) Percentage of aggregates with illustrated spatial relationship with ER and mitochondria quantified from tricolor confocal microscopy after 6 min of HS and 10 min recovery. Histogram shows mean and SEM from four experiments of >100 aggregates examined per experiment. (F) Left: thin-sectioning EM showing association of protein aggregates (magenta) with ER (blue) and mitochondria (yellow) near organelle contact sites. Right: a plane from of 3D reconstruction of serial sections. Scale bars for (B) and (F), 100 nm. Scale bars for all other images, 4 μm. See also Figure S2 and Movie S3.
Figure 4.
Figure 4.. Mitochondria Play Key Roles in the Dissolution and Dynamics of Aggregates
(A) Representative SIM images showing association of HS aggregates (Hsp104-GFP) with mitochondria (labeled with the mitochondria outer membrane marker mCh-Fis1TM). Scale bar, 4 μm. (B) Thin-sectioning EM images showing association of protein aggregates (magenta) with mitochondria (yellow). Scale bar, 100 nm. (C) Fast confocal time-lapse images of HS-induced aggregates emerging from the surface of mitochondria. Arrowheads follow newly formed aggregates, and the time stamps indicate the time since the start of the movie. Scale bar, 4 μm. (D) Quantification of aggregate dissolution kinetics after HS under indicated conditions. Plots are normalized Hsp104-GFP-labeled aggregate intensity as a function of time from >3 movies of a field of cells (50–100 cells per field) starting from the 30 min frame when aggregates in the control no longer grew in brightness. GdnHCl, guanidine hydrochloride; NaN3, sodium azide; CCCP, carbonyl cyanide m-chlorophenyl hydrazine; 2-DG, 2-deoxy-d-glucose; KCN, potassium cyanide. (E) Diffusion coefficients of aggregates between two different pools of aggregates induced by heat shock or H2O2. HS-on or H2O2-on, mitochondria-associated aggregates; HS-off or H2O2-off, aggregates not associated with mitochondria. Aggregates (>500) from two movies/strain were tracked. (F) Two frames near the beginning (1) and end (2) of a time-lapse movie tracking the motion of a H2O2-induced aggregate (green) relative to mitochondria (red).(2) has the aggregate trajectory (yellow line) superimposed. Heatmap in (3) shows duration of aggregate staying at a given location. Scale bar, 1 μm. See also Figure S3 and Movies S4 and S5.
Figure 5.
Figure 5.. Mitochondria Confine Protein Aggregates during Asymmetric Segregation
(A) Left: montage of a representative movie showing that mitochondria inheritance does not result in movement of mitochondria-associated aggregates into the bud. Right: trajectories of aggregates (all colors, except red lines) and mitochondrial tips (red lines) from the same movie. Blue and red dots associated with the more extended tracks represent the beginning and end of these tracks, respectively. Time stamps indicate the time since the start of the movie. This representation applies also to (B)–(D). See also Movie S6. (B) Left: montage of a representative movie showing that Dnm1-GFP foci in the mother remain largely stationary as mitochondria extended into the bud. Right: trajectories of Dnm1-GFP foci (black and blue lines) and mitochondrial tips (red lines) from the same movie. Blue arrowhead follows an aggregate moving with mitochondria into the bud; white arrowhead points to one staying in the mother. See also Movie S7A. (C) Left: montage of a representative movie showing the extension of mitochondria into bud (blue arrowhead) and the relative immobility of Mdm34-GFP foci in mother cell. Right: trajectories of Mdm34 foci and mitochondrial tip from the same movie. See also Movie S7B. (D) Left: montage of a representative movie showing the restrained motion of mitochondrial nucleoids labeled with Abf2-GFP within mother, contrasting extension of mitochondrial tip into bud. The two white arrowheads follow the front most (near bud neck) maternal nucleoids. Blue arrow-heads follow a part of Abf2 foci that split and move into bud with mitochondria. Right: trajectories of nucleoids (all colors, except red lines) and mito-chondrial tip (red lines) from the same movie. See also Movie S7C. All scale bars, 4 μm.
Figure 6.
Figure 6.. Association with Mitochondria Contributes to Mother Retention of Aggregates
(A) Representative images and quantification of aggregates-mitochondria colocalization in Δfis1, Δdnm1, and Δmdv1 cells. Δfis1SRD and WTSRD: colocalization from random distribution (SRD) simulated using parameters measured from respective cells. Histogram shows mean and SEM from 3–4 experiments with >150 aggregates per experiment. Scale bars, 2 mm. Statistical representation as in Figure 2. (B) Average diffusion coefficients of all aggregates in WT and Δfis1 mutant. Histogram shows mean and SEM of diffusion coefficient calculated from >100 aggregate trajectories per strain. (C) Diffusion coefficients of aggregates associated (Δfis1-on) or not associated with mitochondria (Δfis1-off) in Δfis1 cells using same analysis as in Figure 4E. Histogram shows mean and SEM from >3 movies with >50 budding cells per movie examined. See also Movie S9. (D) Percentage of cells showing at least one MTB aggregate leakage among all budding cells observed in time-lapse movies. Histograms show mean and SEM from at least three movies with >50 budding cells per movie. (E and F) Quantification of aggregate number per cell (E) and size (average intensity of aggregates) (F) in Δfis1 and WT. Histograms show mean and SEM from at least three movies with >50 budding cells per movie. (G) Montage showing how majority of aggregate leakage occurred in WT and Δfis1 cells. In WT cells (top), aggregates that leaked into the bud were usually associated with bud-bound mitochondrial extension; in Δfis1cells, the majority of leaked aggregates were not associated with bud-bound mitochondrial extension. Arrowheads point to example MTB aggregates. Scale bars, 2 μm. See also Movie S10. (H) Percentage of MTB-leaking aggregates that were not associated with bud-bound mitochondrial extension among all MTB-leaking aggregates in wild-type and Δfis1. Histogram shows mean and SEM from at least three movies with ~30 MTB leakage events per movie observed. See also Figure S4 and Movies S8, S9, and S10.
Figure 7.
Figure 7.. Aggregate-Mitochondria Interaction in Aging Cells and Summary Model
(A) Example images of natural (left panels) or HS-induced (right panels) aggregates, labeled with Hsp104-GFP, in relationship to mitochondria in cells of 7–10 or 15–17 generations old. Scale bar, 4 μm. (B) Quantification showing a gradual decline of mitochondrial association of naturally occurring Hsp104-containing aggregates in cells with increasing replicative age. Histograms shows mean and SEM from at least three experiments with >100 aggregates examined per experiment. SRD, aggregate-mitochondria colocalization from simulated random distribution using parameters measured from the aged cells. See also Figure S4. (C) Model for organelle-based formation and segregation of protein aggregates. (1) Active polysomes, which are enriched on ER, provide the newly translated peptides that either fold into native proteins or misfold and aggregate on ER surface, a process exaggerated under stress. (2) Native proteins denatured under stress aggregate to sites—initiated by newly translated peptides on ER—frequently close to mitochondria. (3) Aggregates formed away from mitochondria move along ER and are eventually captured by mitochondria. (4) Association of aggregates at site of ER-mitochondria juxtaposition constrains the mobility of aggregates. (5) During bud formation, stable anchorage of mother mitochondria is also reflected by constrained motion of many mitochondrial components, such as nucleoids. (6) Mitochondria that rapidly extend into the bud are likely to acquire these components from either the bud neck region or new assembly. The combination of (5) and (6) explains retention of protein aggregates in the mother during mitochondria inheritance. (7) Disruption of aggregate-mitochondria association by certain mutations or during aging promotes spreading of aggregates into the bud.

References

    1. Altmann K, Frank M, Neumann D, Jakobs S, and Westermann B (2008). The class V myosin motor protein, Myo2, plays a major role in mitochondrial motility in Saccharomyces cerevisiae. J. Cell Biol. 181, 119–130. - PMC - PubMed
    1. Arrasate M, Mitra S, Schweitzer ES, Segal MR, and Finkbeiner S (2004). Inclusion body formation reduces levels of mutant huntingtin and the risk of neuronal death. Nature 431, 805–810. - PubMed
    1. Ashe MP, De Long SK, and Sachs AB (2000). Glucose depletion rapidly inhibits translation initiation in yeast. Mol. Biol. Cell 11, 833–848. - PMC - PubMed
    1. Böckler S, and Westermann B (2014). Mitochondrial ER contacts are crucial for mitophagy in yeast. Dev. Cell 28, 450–458. - PubMed
    1. Boldogh IR, Ramcharan SL, Yang HC, and Pon LA (2004). A type V myosin (Myo2p) and a Rab-like G-protein (Ypt11p) are required for retention of newly inherited mitochondria in yeast cells during cell division. Mol. Biol. Cell 15, 3994–4002. - PMC - PubMed

Publication types

MeSH terms

Substances

LinkOut - more resources