. 2014 Nov 6;159(4):775-88.
doi: 10.1016/j.cell.2014.10.027.

Deterministic progenitor behavior and unitary production of neurons in the neocortex

Affiliations

Deterministic progenitor behavior and unitary production of neurons in the neocortex

Peng Gao et al. Cell. .

Abstract

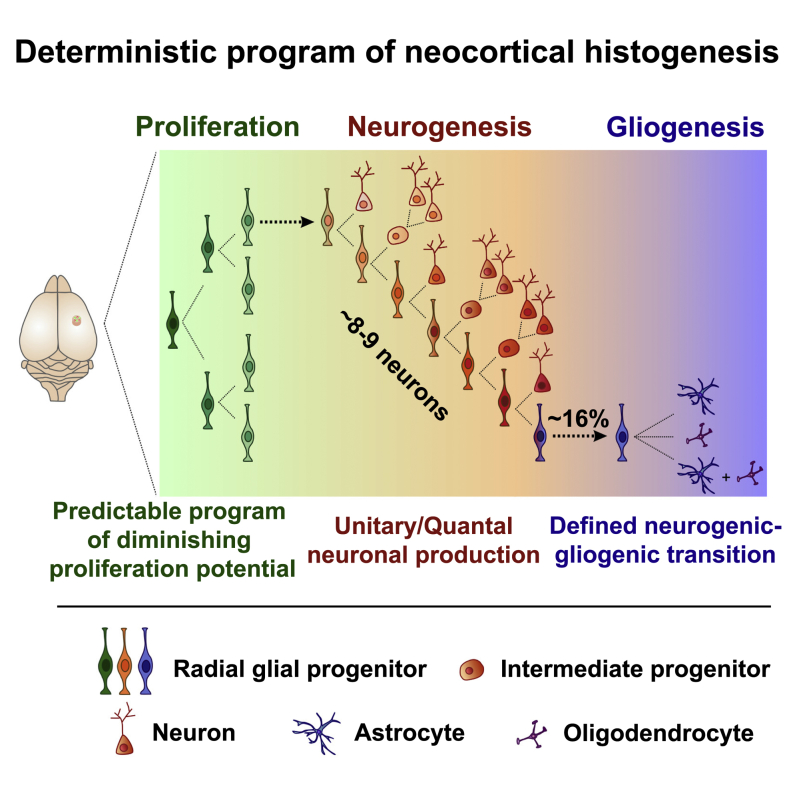
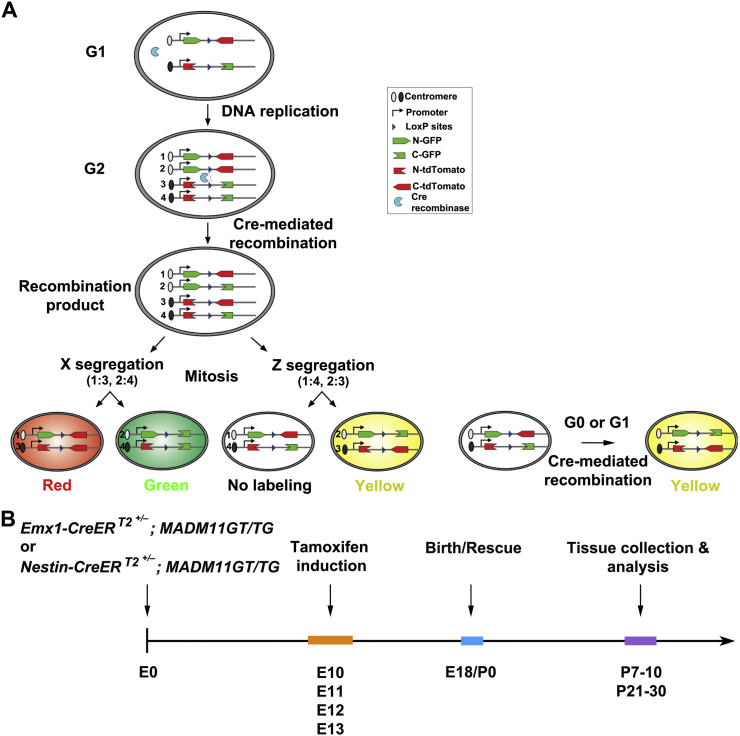
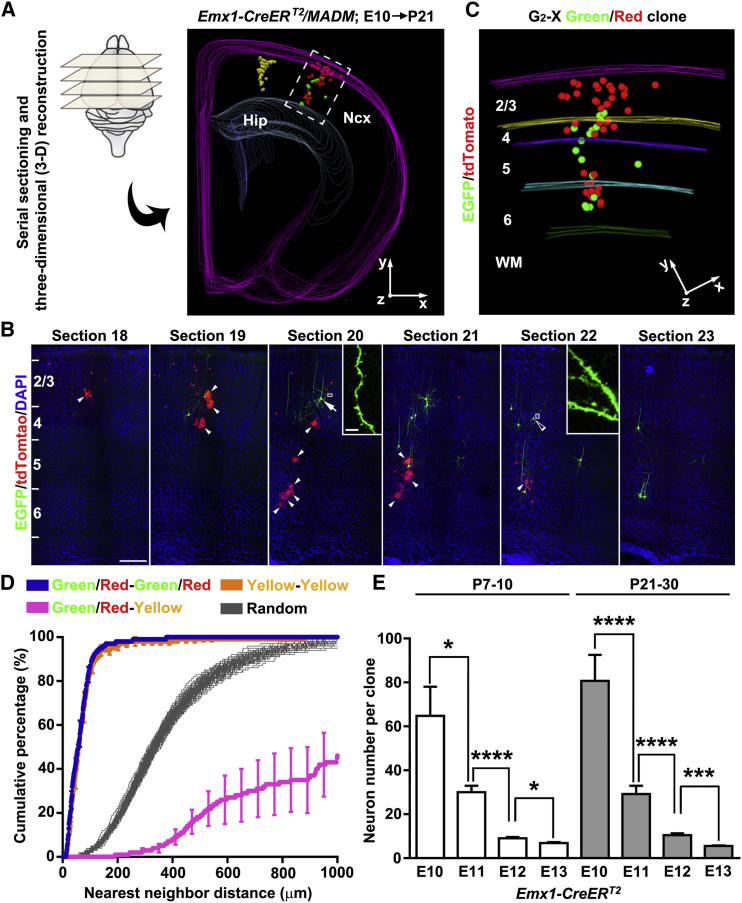
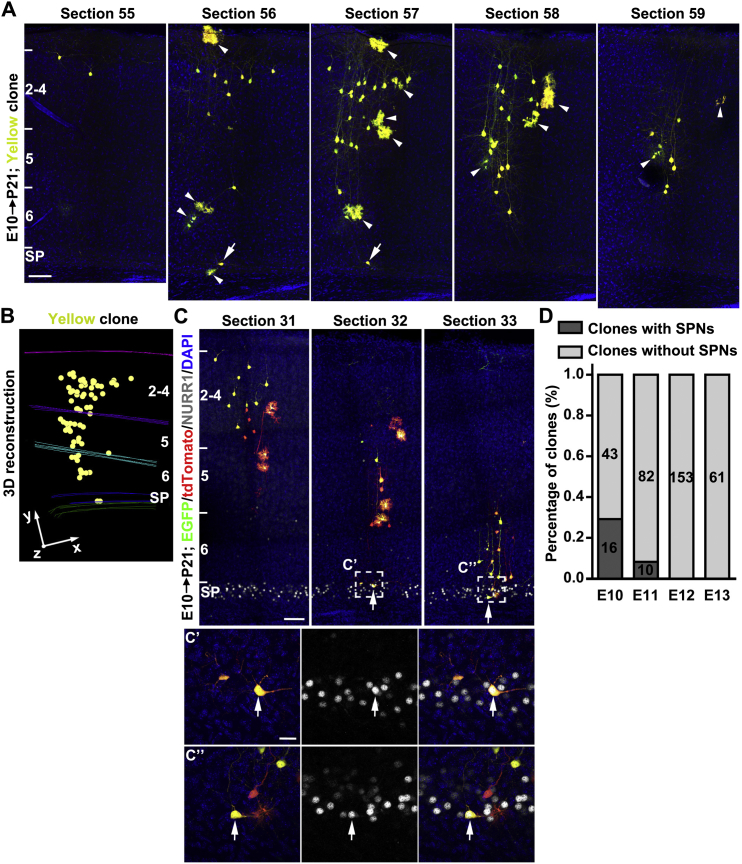
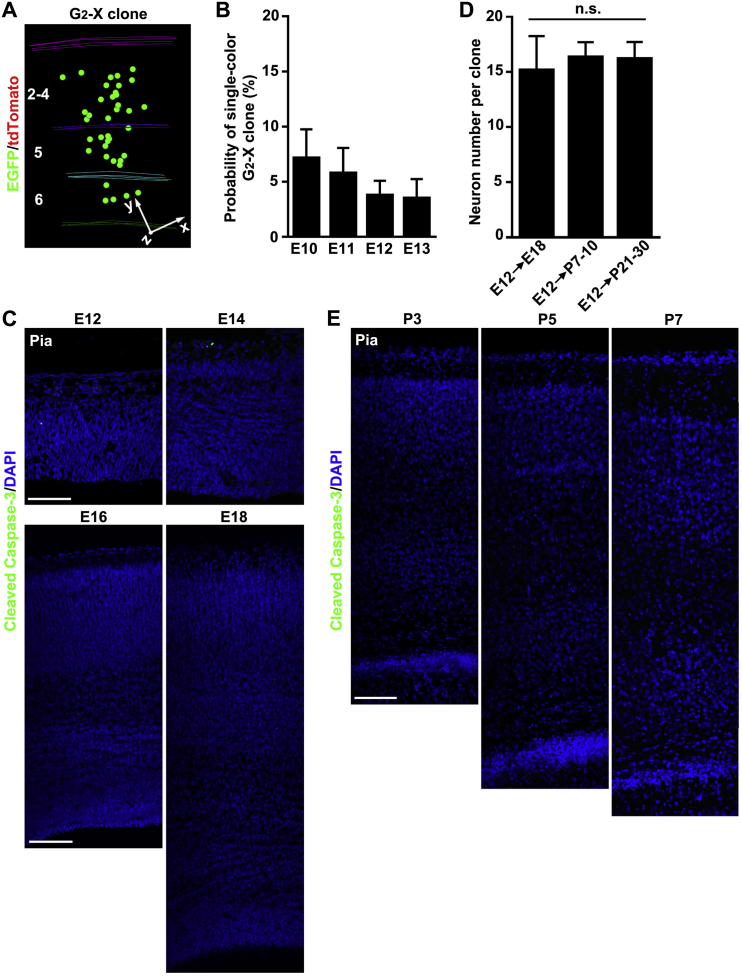
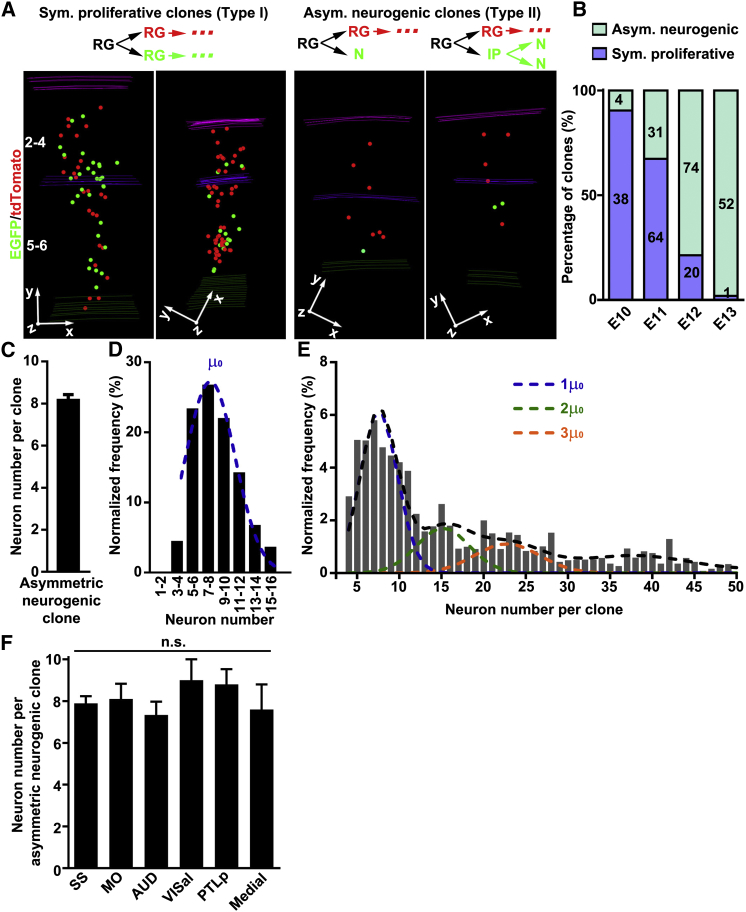
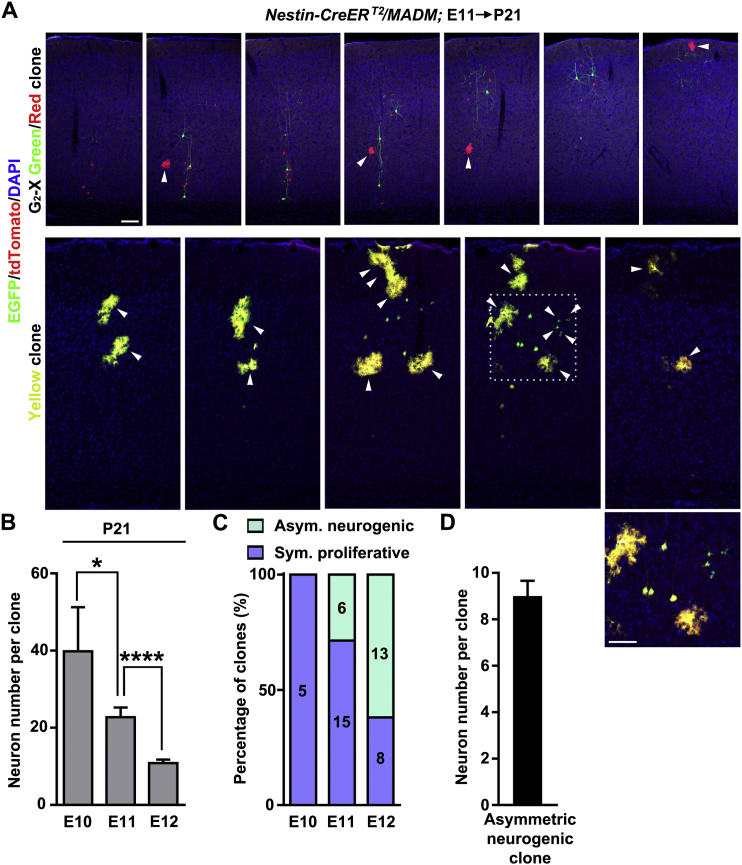
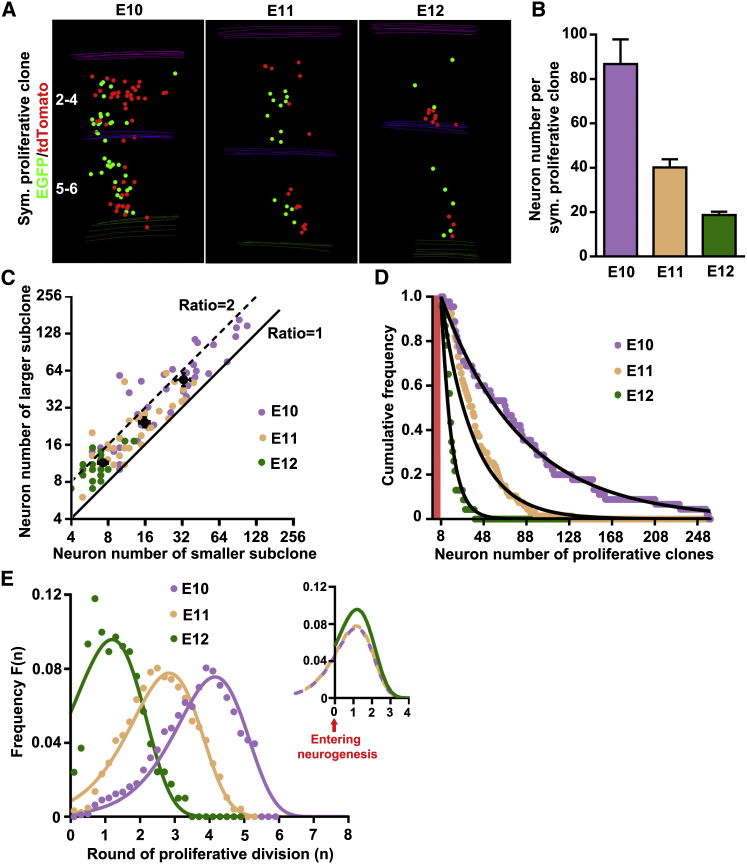
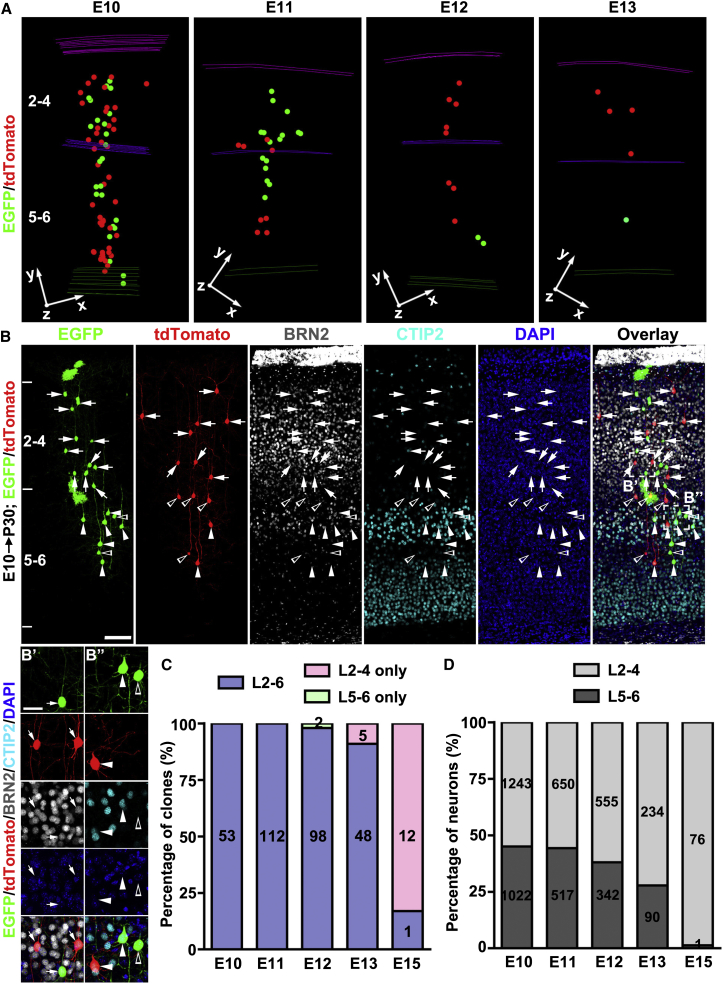
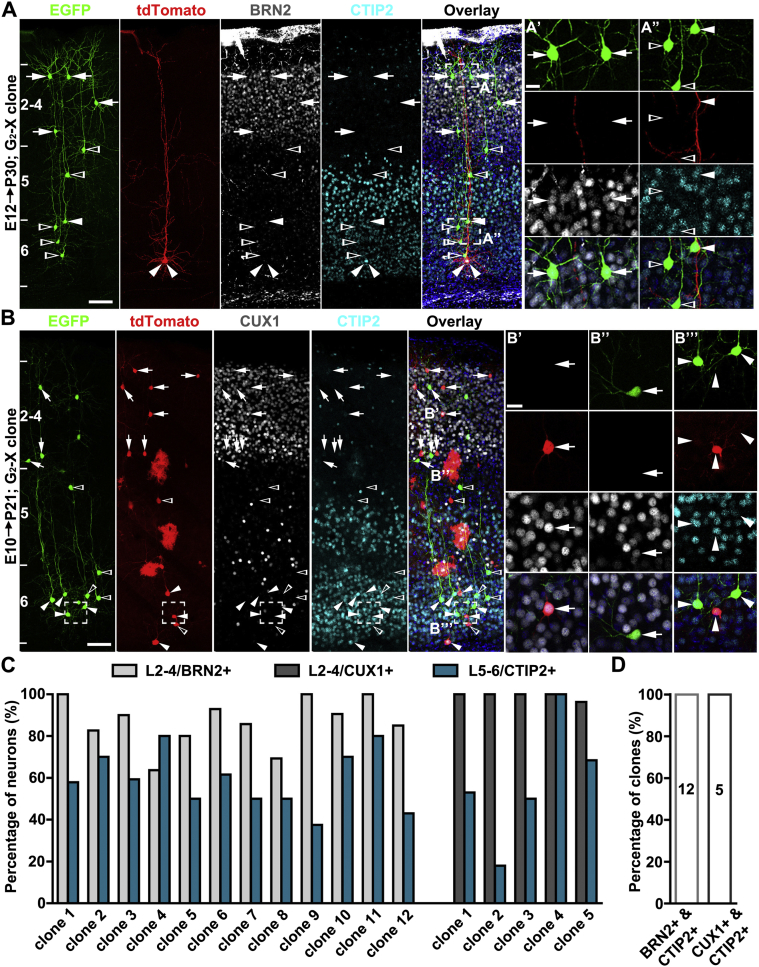
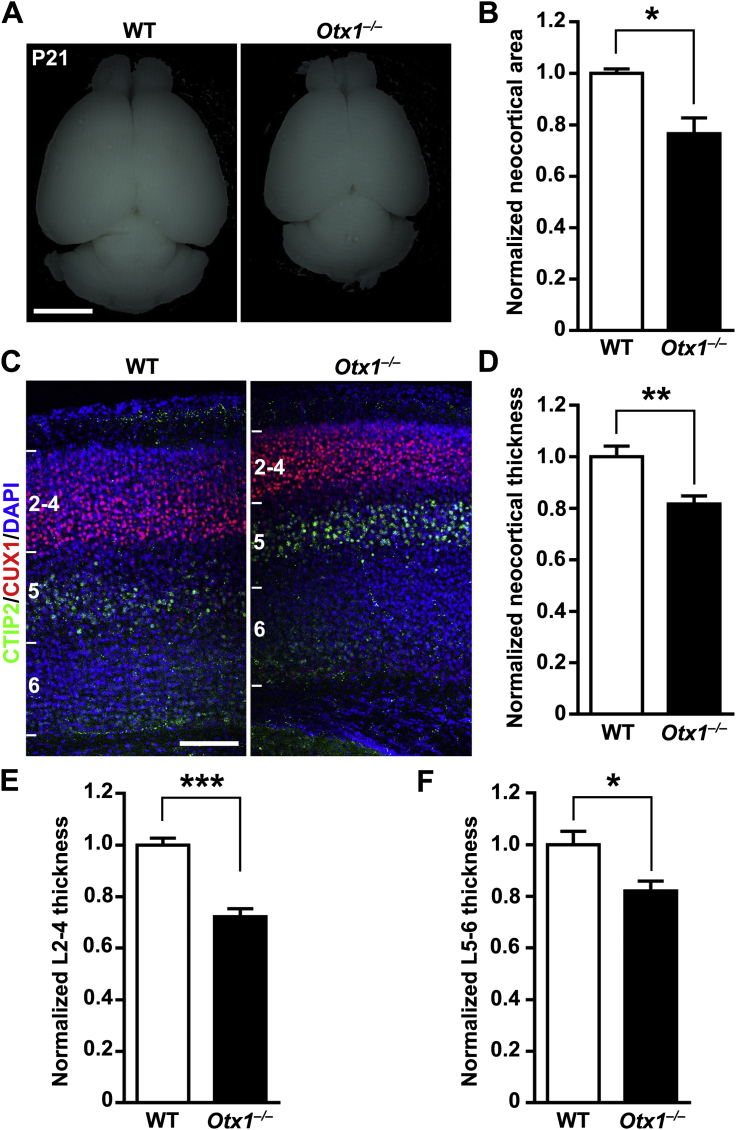
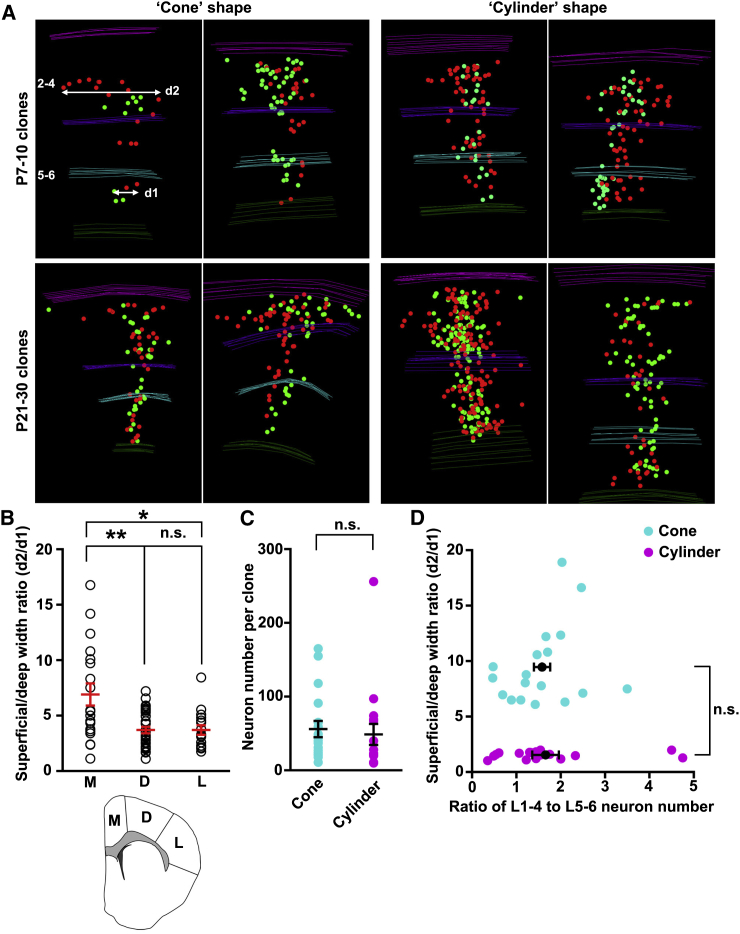
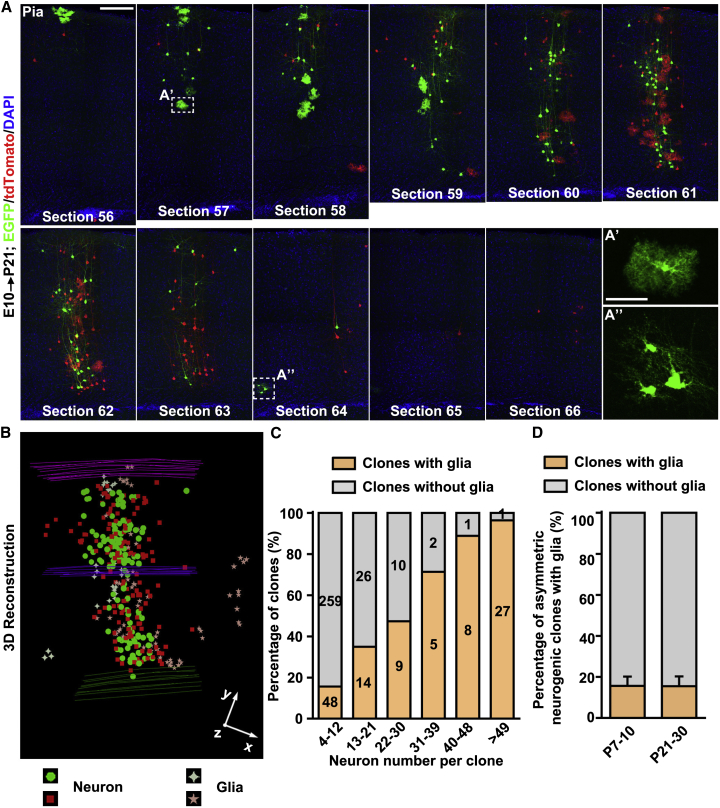
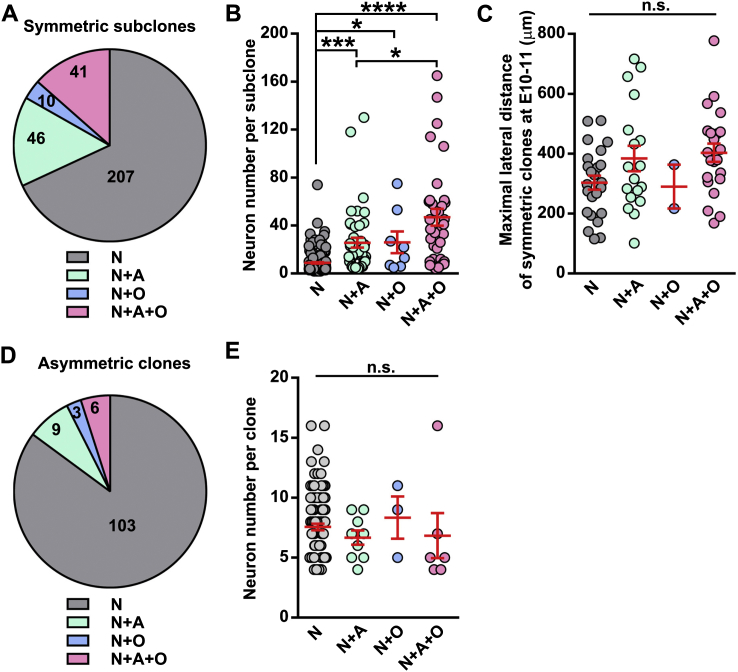
Radial glial progenitors (RGPs) are responsible for producing nearly all neocortical neurons. To gain insight into the patterns of RGP division and neuron production, we quantitatively analyzed excitatory neuron genesis in the mouse neocortex using Mosaic Analysis with Double Markers, which provides single-cell resolution of progenitor division patterns and potential in vivo. We found that RGPs progress through a coherent program in which their proliferative potential diminishes in a predictable manner. Upon entry into the neurogenic phase, individual RGPs produce ?8-9 neurons distributed in both deep and superficial layers, indicating a unitary output in neuronal production. Removal of OTX1, a transcription factor transiently expressed in RGPs, results in both deep- and superficial-layer neuron loss and a reduction in neuronal unit size. Moreover, ?1/6 of neurogenic RGPs proceed to produce glia. These results suggest that progenitor behavior and histogenesis in the mammalian neocortex conform to a remarkably orderly and deterministic program.


Figures

None
Graphical abstract
Figure S1
Figure S1
Outline of MADM-Based Clonal Analysis of Neocortical Excitatory Neuron Production and Organization, Related to Figure 1 (A) Schematic of MADM labeling. (B) Experimental paradigm of MADM-based clonal analysis. A single dose of TM treatment is performed at E10, E11, E12 or E13, and brains are analyzed at P7-10, when neuronal migration in the neocortex is mostly finished, or P21-30, when neocortical development is largely complete.
Figure 1
Figure 1
Clonal Analysis of Neocortical Excitatory Neuron Genesis and Organization Using MADM (A) Serial sectioning and 3D reconstruction of a MADM-labeled P21 brain treated with TM at E10. Colored lines indicate the contours of the brain and colored dots represent the cell bodies of labeled neurons. The x/y/z axes indicate the spatial orientation of the clone with the y axis parallel to the brain midline and pointing dorsally. Similar display is used in subsequent 3D reconstruction images. Hip, hippocampus; Ncx, neocortex. (B) Confocal images of the green/red G2-X clone. Consecutive brain sections were stained with the antibodies against EGFP (green) and tdTomato (red) and with DAPI (blue). Layers are shown to the left. Arrow indicates an excitatory pyramidal neuron with a prominent apical dendrite, and open arrowhead indicates an excitatory stellate neuron. Arrowheads indicate glial cells. High-magnification images of their dendrites with numerous spines are shown in insets. Scale bars, 200 μm and 10 μm. (C) High-magnification 3D reconstruction image of the green/red G2-X clone. Colored lines indicate the layer boundary. WM, white matter. (D) NND analysis of MADM-labeled neurons in the P21-30 neocortex treated with TM at E10. Data are presented as mean ± SEM. (E) Quantification of MADM clone size (P7–P10: E10, n = 24; E11, n = 69; E12, n = 48; E13, n = 28; P21–P30: E10, n = 22; E11, n = 38; E12, n = 47; E13, n = 25). Data are presented as mean ± SEM. (p < 0.05, ∗∗∗p < 0.001, and ∗∗∗∗p < 0.0001). See also Figures S1 and S2 and Movies S1 and S2.
Figure S2
Figure S2
MADM Labeling of Yellow Clones and Clones with Subplate Neurons in the Neocortex, Related to Figure 1 (A) Confocal images of a yellow clone in Figure 1A. Arrowheads indicate glial cells and arrows indicate two neurons in the subplate zone. Scale bar: 100 μm. (B) 3-D reconstruction image of neurons in the yellow clone. (C) Confocal images of a yellow clone containing two subplate neurons (SPNs, arrows) expressing NURR1 (white). High magnification images of SPNs (broken lines, C’ and C’’) are shown at the bottom. Scale bars: 100 μm and 25 μm. (D) Percentage of clones labeled at different embryonic stages containing SPNs.
Figure S3
Figure S3
No Substantial Apoptosis in the Embryonic and Postnatal Neocortex, Related to Figure 2 (A) 3-D reconstruction image of a single colored (green fluorescent only) G2-X clone. (B) Quantification of apoptosis rate of the daughter cell of dividing progenitors inferred from the occurrence of single colored G2-X clones. Data are presented as mean ± SEM. Note that the rate of the daughter cell apoptosis is less than 4%–7%. (C) Confocal images of E12, E14, E16 and E18 neocortices stained with the antibody against Cleaved Caspase-3 (green), a marker for apoptotic cells, and with DAPI (blue). Note no substantial apoptosis in the embryonic neocortex. Scale bar: 100 μm. (D) Quantification of the size of clones labeled at E12 and analyzed at E18, P7-10 and P21-30. Data are presented as mean ± SEM. n.s., not significant. Note that the clonal size is similar at different postnatal stages, indicating no substantial excitatory neuron apoptosis postnatally. (E) Confocal images of P3, P5 and P7 neocortices stained with the antibody against Cleaved Caspase-3 (green) and with DAPI (blue). Scale bar: 100 μm.
Figure 2
Figure 2
Unitary Production of Excitatory Neurons by RGPs (A) 3D reconstruction images of representative symmetric proliferative (left) and asymmetric neurogenic (right) clones. Schematics of the clone are shown at the top. RG, radial glia; N, neuron; IP, intermediate progenitor. (B) Percentage of symmetric proliferative division versus asymmetric neurogenic division at different embryonic stages. (C) Quantification of the size of asymmetric neurogenic clones labeled at E10–E12 (n = 109). (D) Clone size distribution of the asymmetric neurogenic clones at E10–E12 fitted by a Gaussian distribution, indicating an average RGP output of ∼8–9 neurons (mean μ0 = 8.4, SD δ = 2.6; fitting error = 5.3%; blue broken line; termed “Unitary Gaussian”). (E) Gaussian fitting of the overall clone size variation. The 192 clones with a size of up to 50 neurons were fitted by the sum (black line) of a series of Gaussians centered on integer multiples of the mean of Unitary Gaussian in D (1μ0, 2μ0,0; colored lines; higher-order Gaussians are not plotted for clarity). (F) Quantification of the size of asymmetric neurogenic clones located in different neocortical areas (SS, 7.9 ± 0.3, n = 44; MO, 8.1 ± 0.7, n = 10; AUD, 7.3 ± 0.6, n = 15; VISal, 9.0 ± 1.0, n = 2; PTLp, 8.8 ± 0.7, n = 5; Medial, 7.6 ± 1.2, n = 10). SS, somatosensory cortex; MO, motor cortex; AUD, auditory cortex; VISal, visual cortex; PTLp, posterior parietal association areas; Medial, including anterior cingulate area, dorsal peduncular area, infralimbic area, prelimbic area, and retrosplenial area. Data are presented as mean ± SEM. n.s., not significant. See also Figures S3 and S4.
Figure S4
Figure S4
Neocortical Excitatory Neuron Clones Labeled Using Nestin-CreERT2/MADM, Related to Figure 2 (A) Confocal images of a green/red G2-X clone (top) and a yellow clone (bottom) in a P21 brain treated with TM at E11. Arrowheads indicate glial cells. A high magnification image of labeled neurons and glia (broken lines) is shown as an inset. Scale bars: 100 μm. (B) Quantification of the clone size (E10, n = 5; E11, n = 21; E12, n = 21). Data are presented as mean ± SEM. (p < 0.05; ∗∗∗∗p < 0.0001). (C) Percentage of symmetric proliferative division versus asymmetric neurogenic division at different embryonic stages. (D) Quantification of the size of asymmetric neurogenic clones (n = 19). Data are presented as mean ± SEM.
Figure 3
Figure 3
Defined Temporal Program in Diminishing Proliferative Potential by RGPs (A) 3D reconstruction images of representative type I symmetric proliferative clones labeled at different developmental stages. (B) Quantification of the size of symmetric proliferative clones labeled at E10 (n = 38), E11 (n = 64), and E12 (n = 20). Data are presented as mean ± SEM. (C) Scatterplot of the size of the larger versus smaller sister subclones of individual symmetric proliferative clones. Black dots and bars represent the mean and SEM at each developmental stage. (D) Cumulative frequency distribution of the size of symmetric proliferative clones labeled at different developmental stages. Red shaded area indicates no proliferative clone with a size less than eight neurons. (E) Normalized distribution of the round(s) of symmetric proliferative division of the founder RGPs in symmetric proliferative clones prior to neurogenic division. Dots represent individual proliferative clones, and lines represent the estimated distribution of the clones based on the exponential fitting in (D). The overlay of lines is shown in the inset (n = 0 indicates entering neurogenesis).
Figure 4
Figure 4
Individual RGPs Produce Both Deep- and Superficial-Layer Excitatory Neurons (A) 3D reconstruction images of representative clones labeled at different embryonic stages. Note that all clones contain both superficial (2–4) and deep (5–6) layer neurons. (B) Confocal images of an E10 clone stained with the antibodies against EGFP (green), tdTomato (red), BRN2 (white), and CTIP2 (cyan) and with DAPI (blue). High-magnification images of representative superficial (B’) and deep (B’’) layer neurons (broken lines) are shown at the bottom. Arrows indicate neurons positive for BRN2, arrowheads indicate neurons positive for CTIP2, and open arrowheads indicate neurons negative for BRN2 or CTIP2. Scale bars, 100 μm and 25 μm. (C) Percentage of clones containing both superficial and deep-layer neurons versus those containing only superficial- or deep-layer neurons. (D) Percentage of neurons in the clones located in superficial or deep layers. See also Figure S5.
Figure S5
Figure S5
G2-X Clones Contain Both Superficial- and Deep-Layer Neurons, Related to Figure 4 (A) Confocal images of a representative asymmetric neurogenic G2-X clone stained with the antibodies against EGFP (green), tdTomato (red), BRN2 (white) and CTIP2 (cyan), and with DAPI (blue). High magnification image of representative superficial (A’) and deep (A’’) layer neurons (broken lines) are shown to the right. Arrows indicate neurons positive for BRN2, arrowheads indicate neurons positive for CTIP2, and open arrowheads indicate neurons negative for BRN2 or CTIP2. Scale bars: 100 μm and 20 μm. (B) Confocal images of a representative symmetric proliferative G2-X clone stained with the antibodies against EGFP (green), tdTomato (red), CUX1 (white) and CTIP2 (cyan), and with DAPI (blue). Arrows indicate neurons positive for CUX1, arrowheads indicate neurons positive for CTIP2, and open arrowheads indicate neurons negative for CUX1 or CTIP2. High magnification images of representative superficial (B’ and B’’) and deep (B’’’, broken lines) layer neurons are shown to the right. Scale bars: 100 μm and 20 μm. (C) Percentage of L2-4 and L5-6 neurons of individual clones labeled at E10-12 that are positive for BRN2+ or CUX1+ and CTIP2+, respectively. Note all the clones contain BRN2+ or CUX1+ and CTIP2+ neurons. (D) Percentage of clones labeled at E10-12 that contain both BRN2+ or CUX1+ and CTIP2+ neurons.
Figure 5
Figure 5
OTX1 Regulates the Production of Deep- and Superficial-Layer Neurons and Unitary Neuronal Output of RGPs (A) Outline of MADM-based mosaic knockout analysis of Otx1 in RGPs undergoing asymmetric neurogenic division. Note that tdTomato labels Otx1–/– cells and EGFP labels wild-type cells within the clone. RG, radial glia; N, neuron; IP, intermediate progenitor. (B) 3D reconstruction images of representative G2-X clones in mosaic Otx1-MADM neocortices. Schematics of the clone are shown at the top. (C) Quantification of the size of the majority population arising from renewing RGPs in mosaic asymmetric neurogenic Otx1-MADM clones (∗∗p < 0.01). (D) Quantification of the size of the minority population arising from IPs or Ns in mosaic asymmetric neurogenic Otx1-MADM clones (n.s., not significant). (E) Quantification of the number of superficial-layer neurons in the majority population (p < 0.05). (F) Quantification of the number of deep-layer neurons in the majority population (p < 0.05). (G) Quantification of the unitary size of asymmetric neurogenic clones (p < 0.05; n.s., not significant). Data are presented as mean ± SEM in (C)–(G). (WT, n = 22 from 5 brains; Otx1–/–, n = 28 from 5 brains). See also Figure S6.
Figure S6
Figure S6
Microcephaly and Reduction in Neocortical Thickness in Otx1–/– Mice, Related to Figure 5 (A) Whole-mount images of representative P21 wild-type (Otx1+/+) and Otx1–/– brains. Note the clear microcephaly of Otx1–/– brains. Scale bar: 500 μm. (B) Quantification of the area of the neocortex. Note ∼25% reduction in the neocortical area of Otx1–/– brains compared to wild-type littermate controls. Data are presented as mean ± SEM. (n = 4; p < 0.05). (C) Confocal images of representative P11 wild-type and Otx1–/– neocortices stained for CUX1 (red) and CTIP2 (green), the superficial and deep layer neuron markers, and with DAPI (blue). Note the reduction in the overall thickness of the neocortex as well as the thickness of both the superficial (2-4) and deep (5-6) layers. Scale bar: 100 μm. (D–F) Quantification of the thickness of all layers (D), and the superficial (E) and deep (F) layers across different neocortical areas. Data are presented as mean ± SEM. (3 regions along the dorsolateral axis from 4 sections were analyzed for each condition; p < 0.05; ∗∗p < 0.01; ∗∗∗p < 0.001).
Figure 6
Figure 6
Spatial Organization of Neocortical Excitatory Neuron Clones (A) 3D reconstruction images of representative clones that are “cone” shaped (left) and “cylinder” shaped (right) at P7–P10 (top) and P21–P30 (bottom) labeled at E10–E12. (B) Quantification of the ratio of the maximal lateral dispersion in the superficial layer 2/3 in all dimensions (d2) to that in the deep layer 6 (d1) (see A) for clones located in different regions of the neocortex (medial [M], n = 19; dorsal [D], n = 33; lateral [L], n = 16; see inset at the bottom). Individual circles represent a single clone. Mean and SEM are shown in red (p < 0.05 and ∗∗p < 0.01; n.s., not significant). (C and D) No correlation between the clone shape and the clone size (C) or the ratio of neuron number in the superficial (2–4) and deep (5–6) layers (D). Each dot indicates a clone and black lines indicate mean ± SEM. See also Movies S3 and S4.
Figure 7
Figure 7
Predictable Rate of RGP Transitioning from Neurogenesis to Gliogenesis (A) Confocal images of an E10–P21 green/red G2-X clone that contains both green and red glial cells. High-magnification images of an astrocyte (A’) and a few oligodendrocytes (A’’) are shown in insets. Scale bars, 200 μm and 50 μm. (B) 3D reconstruction image of the clone in (A). (C) Percentage of all clones with or without glia with regard to the number of neurons in the clone. (D) Percentage of asymmetric neurogenic clone with or without glia at P7–P10 and P21–P30. Data are presented as mean ± SEM. See also Figure S7.
Figure S7
Figure S7
Relationship between Neurogenesis and Gliogenesis, Related to Figure 7 (A) Percentage of symmetric subclones that contain neurons only (N), neurons and astrocytes (N+A), neurons and oligodendrocytes (N+O) or neuron, astrocytes and oligodendrocytes (N+A+O). (B) Number of neurons per subclones that contain N, N+A, N+O or N+A+O. Each cycle represents one subclone and red lines represent mean ± SEM. ∗∗∗∗p < 0.0001; ∗∗∗p < 0.001; p < 0.05. (C) Maximal lateral distance between neurons of symmetric subclones that contain N, N+A, N+O or N+A+O. n.s., not significant. (D) Percentage of asymmetric neurogenic clones that contain N, N+A, N+O or N+A+O. (E) Number of neurons per asymmetric neurogenic clones that contain N, N+A, N+O or N+A+O. n.s., not significant.

References

    1. Acampora D., Mazan S., Avantaggiato V., Barone P., Tuorto F., Lallemand Y., Brûlet P., Simeone A. Epilepsy and brain abnormalities in mice lacking the Otx1 gene. Nat. Genet. 1996;14:218–222. - PubMed
    1. Angevine J.B., Jr., Sidman R.L. Autoradiographic study of cell migration during histogenesis of cerebral cortex in the mouse. Nature. 1961;192:766–768. - PubMed
    1. Anthony T.E., Klein C., Fishell G., Heintz N. Radial glia serve as neuronal progenitors in all regions of the central nervous system. Neuron. 2004;41:881–890. - PubMed
    1. Bayraktar O.A., Doe C.Q. Combinatorial temporal patterning in progenitors expands neural diversity. Nature. 2013;498:449–455. - PMC - PubMed
    1. Betizeau M., Cortay V., Patti D., Pfister S., Gautier E., Bellemin-Ménard A., Afanassieff M., Huissoud C., Douglas R.J., Kennedy H., Dehay C. Precursor diversity and complexity of lineage relationships in the outer subventricular zone of the primate. Neuron. 2013;80:442–457. - PubMed

Publication types

Substances