. 2014 Nov 6;159(4):814-28.
doi: 10.1016/j.cell.2014.10.026.

Spatial map of human T cell compartmentalization and maintenance over decades of life

Affiliations

Spatial map of human T cell compartmentalization and maintenance over decades of life

Joseph J C Thome et al. Cell. .

Abstract

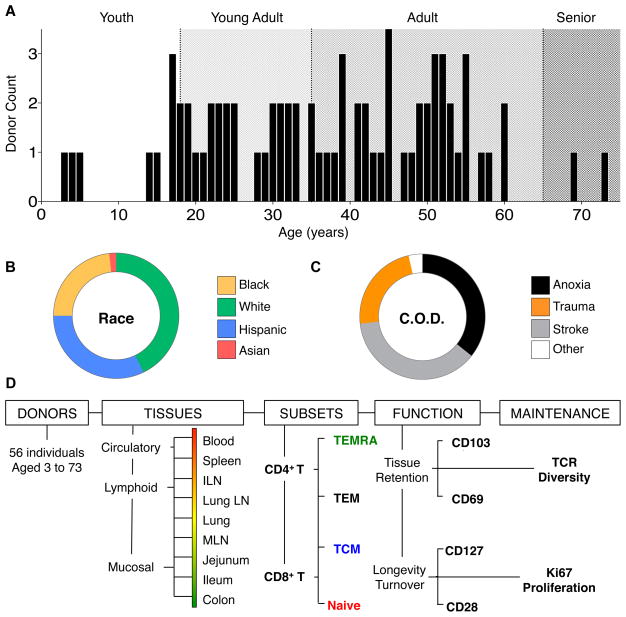
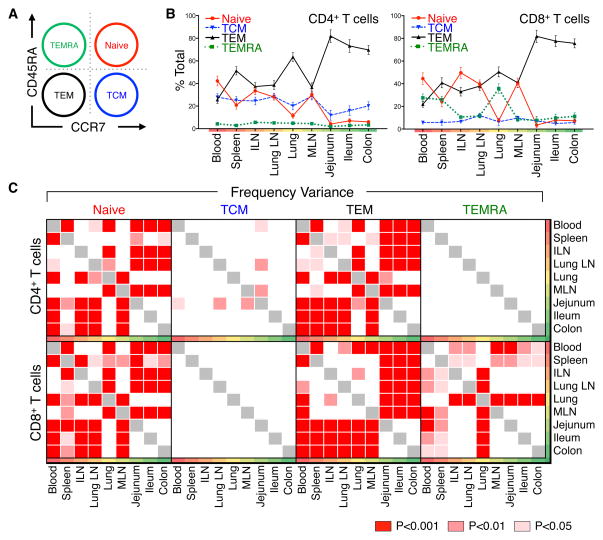
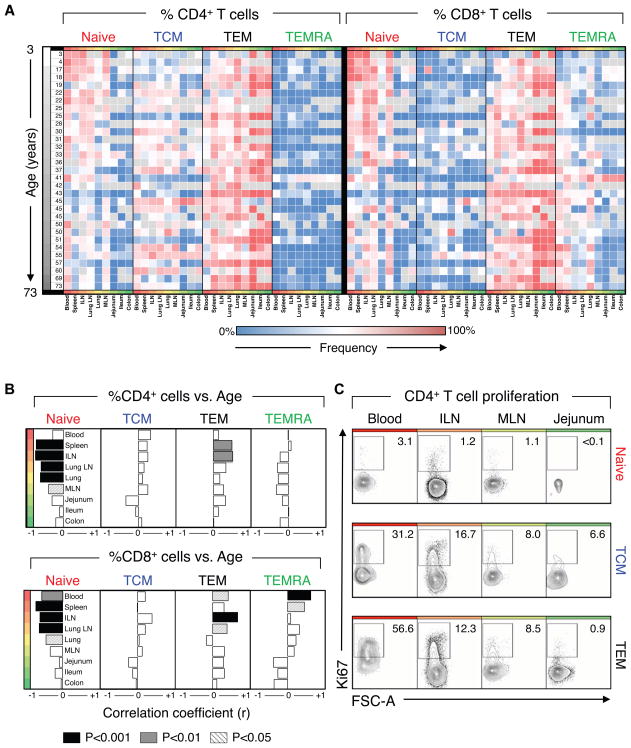
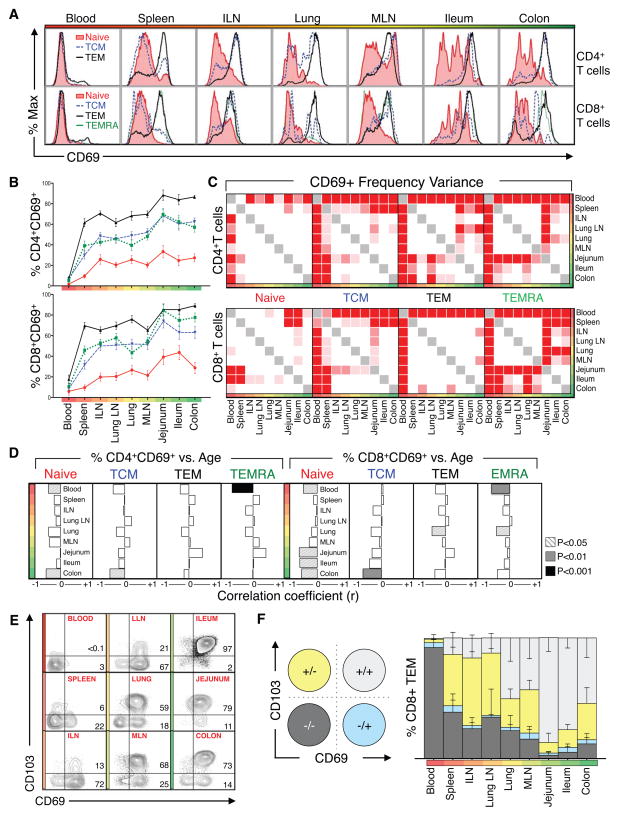
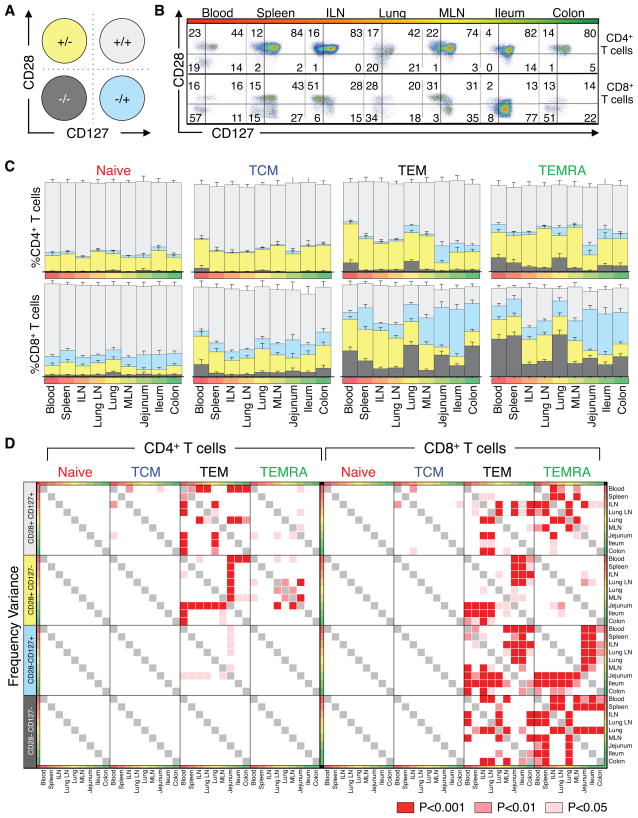
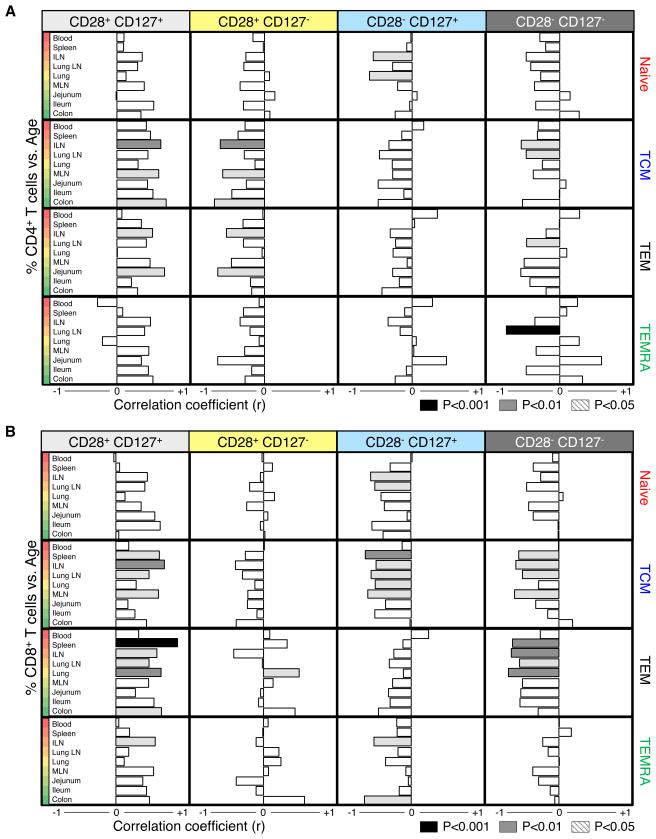
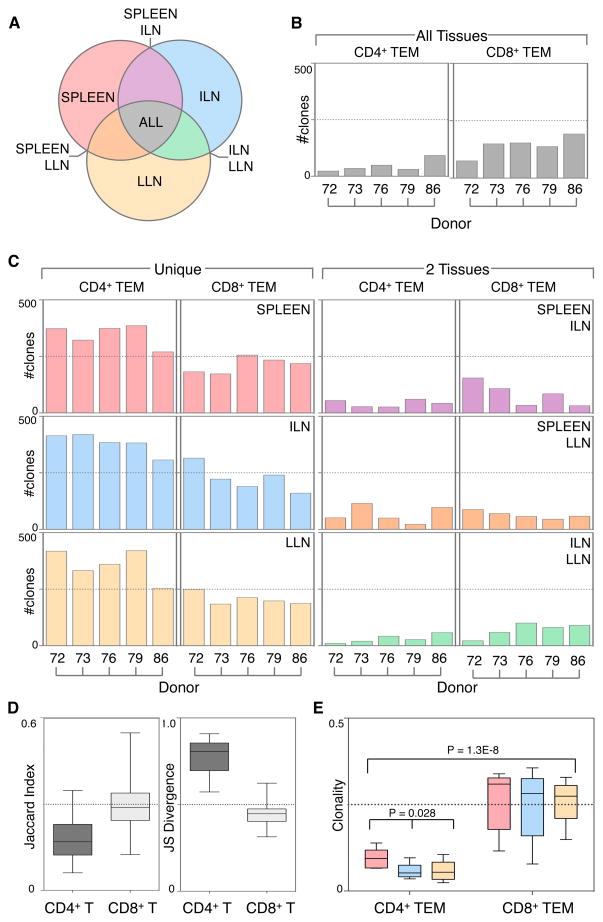
Mechanisms for human memory T cell differentiation and maintenance have largely been inferred from studies of peripheral blood, though the majority of T cells are found in lymphoid and mucosal sites. We present here a multidimensional, quantitative analysis of human T cell compartmentalization and maintenance over six decades of life in blood, lymphoid, and mucosal tissues obtained from 56 individual organ donors. Our results reveal that the distribution and tissue residence of naive, central, and effector memory, and terminal effector subsets is contingent on both their differentiation state and tissue localization. Moreover, T cell homeostasis driven by cytokine or TCR-mediated signals is different in CD4+ or CD8+ T cell lineages, varies with their differentiation stage and tissue localization, and cannot be inferred from blood. Our data provide an unprecedented spatial and temporal map of human T cell compartmentalization and maintenance, supporting distinct pathways for human T cell fate determination and homeostasis.


Figures

Figure 1
Figure 1. Characteristics of the human donor population and analysis overview
Lymphocyte frequency, distribution, function and maintenance was assessed in 9 tissue sites acquired from 56 deceased organ donors, aged 3–73. (A) Age distribution of analyzed donors grouped into four life stages: Youth (0–5 years, white), Young Adult (16–35 years, light gray), Adult (36–65 years, gray), and Senior (66+ years, dark gray). (B) Race distribution of the organ donor population: White (green), Hispanic (blue), Black (yellow), and Asian (red). (C) Cause of death distribution of the organ donor population: Cerebrovascular stroke (gray), Head Trauma (orange), Anoxia (black), other causes (white). Characteristics of each individual donor including age, gender, height, weight, cause of death and serology are detailed in Table S1. (D) Flow chart of different parameters investigated and the analyses performed for this study from 56 donors, with blood and 8 tissues from each donor, analyzing 8 distinct CD4+ and CD8+ T cell subsets in terms of their function, proliferation, TCR diversity and homeostasis.
Figure 2
Figure 2. Tissue Distribution of naïve, memory and terminal effector subsets remains consistent between diverse donors
Frequency of lymphocytes in 9 tissue sites isolated from organ donors was quantified by flow cytometry. (A) Gating strategy used to identify T cell subsets (CD3+ CD19CD4+ or CD3+ CD19CD8+ cells) based on CD45RA and CCR7 expression defining: CD45RA+/CCR7+ (Naïve, red), CD45RA/CCR7+ (“Central Memory” or TCM, blue), CD45RA/CCR7 (“effector-memory”, TEM, black), and CD45RA+/CCR7 (“Terminal effector” or TEMRA, green). Colors and abbreviations are used consistently throughout. (B) Mean frequency (±SEM) of each subset expressed as a percent of total CD4+ (left) and CD8+ (right) T cells in circulation, spleen, lymphoid tissue and mucosal sites (ordered from blood, red; to mucosal sites, green). Individual means and additional descriptive statistics are listed in Table S3. (C) Distribution variance between CD4+ and CD8+ T cell subset frequencies in 31 donors (Table S2) was assessed for each tissue by two-way ANOVA and adjusted for multiple comparisons by a Holm-Sidak correction. Significant frequency variances between tissue pairs are expressed as p-values with red- and pink-shaded boxes indicating significant differences (p<0.001, red; p<0.01, light red; p<0.05, pink) and white boxes indicating no significant difference in subset frequency between anatomic sites. Individual p-values are listed in Table S4.
Figure 3
Figure 3. Temporal dependence of T cell distribution varies by subset and compartment
Lymphocyte frequency was quantified in 9 tissues from donors aged 3 to 73. (A) Heatmap of CD4+ and CD8+ T cell subset frequency (ranging from 0% (blue) to 100%, (red)) in individual donors from youngest (white) to oldest (black), from blood to lymphoid to mucosal sites. (B) Spearman correlation analysis of changes in lymphocyte tissue distribution with increasing age shows temporal changes in subset distribution in circulating and lymphoid sites. Correlation strength and directionality (r=−1, left to r=+1, right) is shown for each tissue ordered from blood to lymphoid to mucosal tissues. Correlation significance for each tissue is denoted by shading (p<0.05, striped; p<0.01, gray; p<0.001, black). Individual r- and p-values are listed in Table S5.) (C) Ex vivo analysis of proliferation of naïve, TCM, and TEM CD4 T cell subsets in different tissue sites. Ki67 expression by CD4+ naïve (red), TCM (blue), and TEM (black) CD3+ T cell subsets in blood, ILN, MLN, and jejunum from Donor 93. Compiled Ki67 data from multiple donors are in Figure S3B.
Figure 4
Figure 4. CD69 expression marks T cell compartmentalization in tissue sites
(A) Representative flow cytometry histograms showing CD69 expression by CD4+ (top) and CD8+ (bottom) naïve (red), TCM (blue), TEM (black), and TEMRA (green) cell subsets from donor #101. (B) Mean frequency (+− SEM) of CD69+ CD4+ and CD8+ T naïve, TCM, TEM, and TEMRA cell subsets among blood, lymphoid and mucosal tissues. Data shown are compiled from 29 donors (Table S2). (C) Distribution variance of CD69+CD4+ (top) and CD8+ (bottom) naïve, TCM, TEM, and TEMRA subsets in blood, lymphoid and mucosal tissues from (B). (D) Spearman correlation analysis of changes in CD69+ subset tissue distribution with increasing age. Correlation strength and directionality (r=−1, left to r=+1, right) is shown for each tissue. Correlation significance for each tissue is denoted by shading (p<0.05, striped; p<0.01, gray; p<0.001, black; not significant, white). Individual r- and p-values are listed in Table S5) (E) Representative flow cytometry plots showing CD103/CD69 expression patterns by CD8+ TEM subsets in circulation, lymphoid, and mucosal tissues. Number in upper and lower right quadrants indicate %CD69+CD103+ and %CD69+CD103 cells, respectively. (F) Overall distribution of TEM subpopulations delineated by CD69 and CD103 expression: CD69+CD103+, light gray; CD69+CD103, blue; CD69 CD103+, yellow; and CD69 CD103, dark gray. Graphs shows mean frequencies (±SEM) of these subsets among CD8+ TEM from nine tissues compiled from 10 donors with each tissue representing 5 or more donors. Individual donors used are indicated in Table S2.
Figure 5
Figure 5. CD28 and CD127 expression reveal distinct homeostatic patterns in lymphoid and mucosal tissues
Coordinate expression of CD28 and CD127 by CD4+ and CD8+ naïve, TCM, TEM, and TEMRA subsets was analyzed. (A) Diagram showing the 4 subpopulations delineated by CD28/CD127 expression: CD28+ CD127+, light gray; CD28 CD127+, blue; CD28+ CD127, yellow; and CD28 CD127, dark gray T cells. (B) Representative flow cytometry plots showing pattern of CD28 and CD127 expression by CD4+ (top) and CD8+ (bottom) TEM cells. (C) Frequency (±SEM) of these functional subsets in (B) within CD4+ (top) and CD8+ (bottom) naïve, TCM, TEM, and TEMRA subsets. Individual frequencies from each of 23 donors are in Table S3. (D) Variance between CD4+ (left) and CD8+ (right) CD127/CD28 subset frequencies within naïve, TCM, TEM, and TEMRA subsets was assessed for each tissue by two-way ANOVA and corrected by Holm-Sidak for multiple comparisons. Significant variation among tissues is denoted by colored squares (p<0.001, red; p<0.01, light red; p<0.05, pink). Individual p-values for each tissue are listed in Table S4.
Figure 6
Figure 6. Temporal dependence of T cell subset maintenance is site-specific
Correlation between increasing age and frequency of (A) CD4+ and (B) CD8+ naïve, TCM, TEM, and TEMRA subsets divided by expression of CD127 and CD28 was determined in each tissue. Correlation degree (bar length) and directionality (left, negative; right, positive) are shown for each population and subset: CD28+CD127+ (light gray), CD28+CD127 (yellow), CD28CD127+ (blue), and CD28CD127 (dark gray). Significant correlation is denoted by bar shading (p<0.001=black, p<0.01=gray, p<0.05=light gray). Individual r- and p-values for each tissue and subset are shown in Table S5.
Figure 7
Figure 7. Differential clonal compartmentalization and TCR diversity between CD4+ and CD8+ TEM cells
(A) TCR clonal distribution among and between three tissue sites from five individual donors. Venn diagram schematic showing how TCR clones were grouped according to their tissue distribution indicated by colored shading: TCR sequences unique to spleen (pink), ILN (blue), and LLN (yellow); sequences shared by spleen and LLN but not ILN (orange), spleen and ILN but not LLN (purple), ILN and LLN but not spleen (green); sequences shared by all three tissues (spleen, ILN and LLN) indicated by gray shading. (B) Clonal TCR sequence overlap of CD4+ and CD8+ TEM in all 3 tissues (spleen, ILN, and LLN) from 5 donors aged 24–55 (Table S1) is shown for the top 500 TCR sequences. (C) Number of unique TCR clones in each site (left graphs), and clones that were shared specifically between two tissues indicated (right graphs) for CD4+ and CD8+ TEM from five individual donors. TCR sequence data are listed in Table S6. (D) Left: Jaccard index values of CD4+ (dark gray) and CD8+ (light gray) TEM clones from combined spleen, ILN, and LLN are shown for 5 donors to quantify population similarity. Right: Jensen-Shannon (JS) divergence indices quantify population diversity of CD4+ (dark gray) and CD8+ (light gray) TEM from combined spleen, ILN, and LLN of 5 donors. Individual donor and tissue Jaccard indices and Jensen-Shannon indices are shown in Figure S6A. (E) Clonality of TCR sequences is shown for CD4+ and CD8+ TEM from spleen (pink), ILN (blue), and LLN (yellow) among 5 donors. Box plots denote 25th to 75th percentile and whiskers indicate minimum and maximum values.

References

    1. Ahmed R, Bevan MJ, Reiner SL, Fearon DT. The precursors of memory: models and controversies. Nat Rev Immunol. 2009;9:662–668. - PubMed
    1. Bankovich AJ, Shiow LR, Cyster JG. CD69 suppresses sphingosine 1 -phosophate receptor-1 (S1P1) function through interaction with membrane helix 4. J Biol Chem. 2010;285:22328–22337. - PMC - PubMed
    1. Campbell JJ, Bowman EP, Murphy K, Youngman KR, Siani MA, Thompson DA, Wu L, Zlotnik A, Butcher EC. 6-C-kine (SLC), a lymphocyte adhesion-triggering chemokine expressed by high endothelium, is an agonist for the MIP-3beta receptor CCR7. J Cell Biol. 1998;141:1053–1059. - PMC - PubMed
    1. Campbell JJ, Murphy KE, Kunkel EJ, Brightling CE, Soler D, Shen Z, Boisvert J, Greenberg HB, Vierra MA, Goodman SB, et al. CCR7 expression and memory T cell diversity in humans. J Immunol. 2001;166:877–884. - PubMed
    1. Casey KA, Fraser KA, Schenkel JM, Moran A, Abt MC, Beura LK, Lucas PJ, Artis D, Wherry EJ, Hogquist K, et al. Antigen-Independent Differentiation and Maintenance of Effector-like Resident Memory T Cells in Tissues. J Immunol. 2012;188:4866–4875. - PMC - PubMed

Publication types

MeSH terms

Substances