. 2014 Nov 6;159(4):869-83.
doi: 10.1016/j.cell.2014.10.019.

ATRX directs binding of PRC2 to Xist RNA and Polycomb targets

Affiliations

ATRX directs binding of PRC2 to Xist RNA and Polycomb targets

Kavitha Sarma et al. Cell. .

Erratum in

  • Cell. 2014 Nov 20;159(5):1228
  • Cell. 2015 Jan 29;160(3):568-9

Abstract

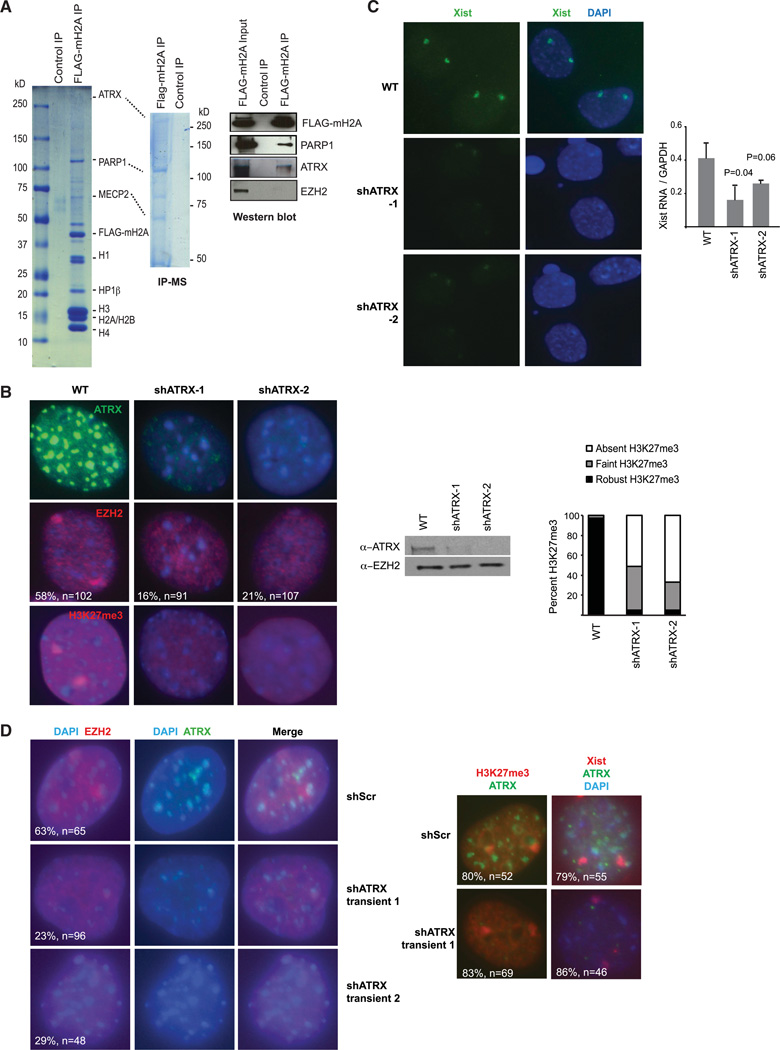
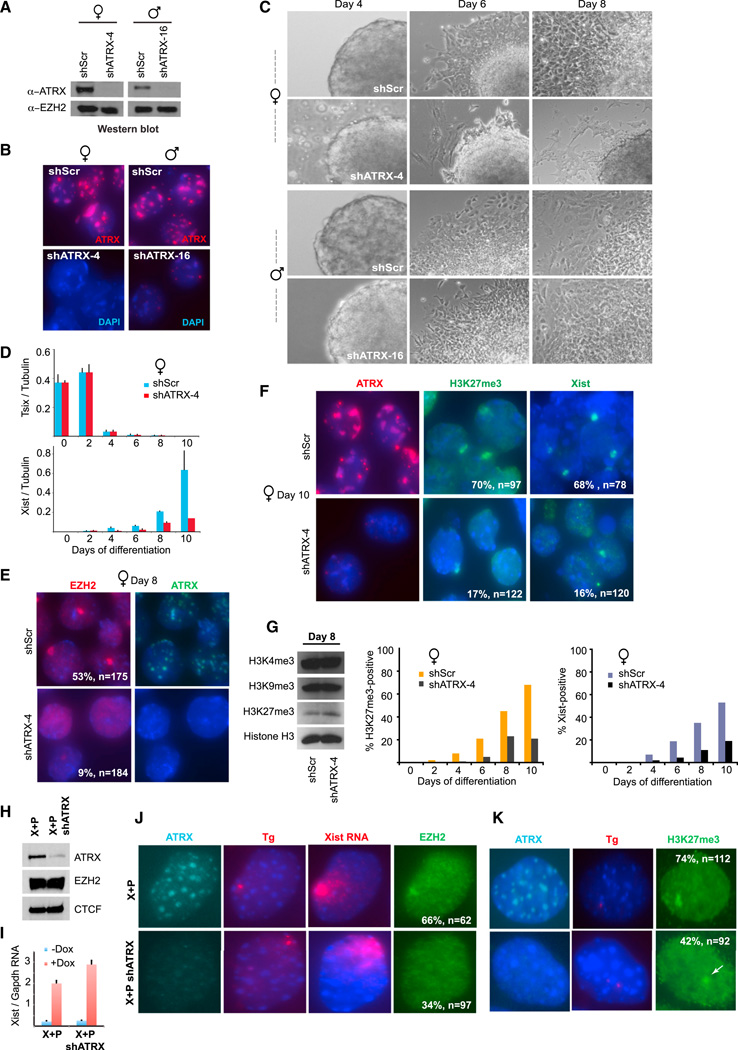
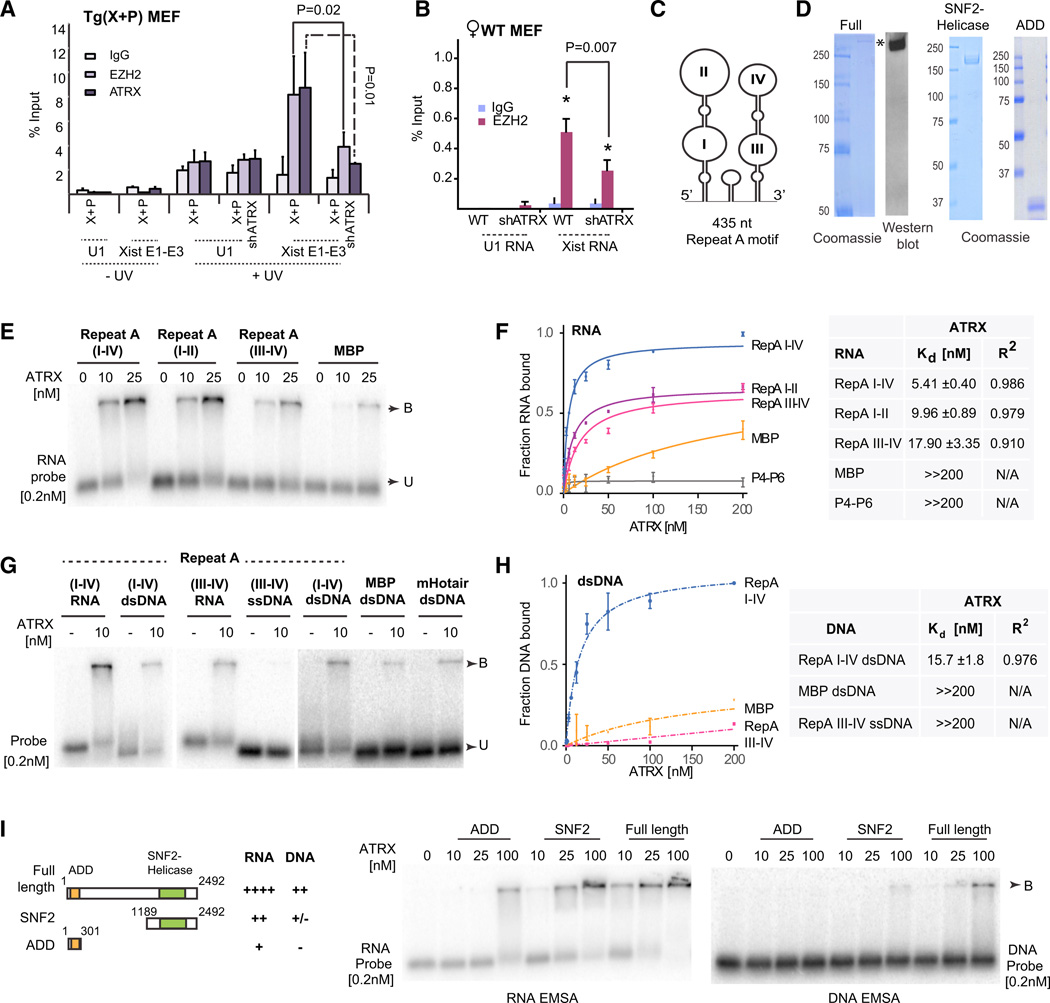
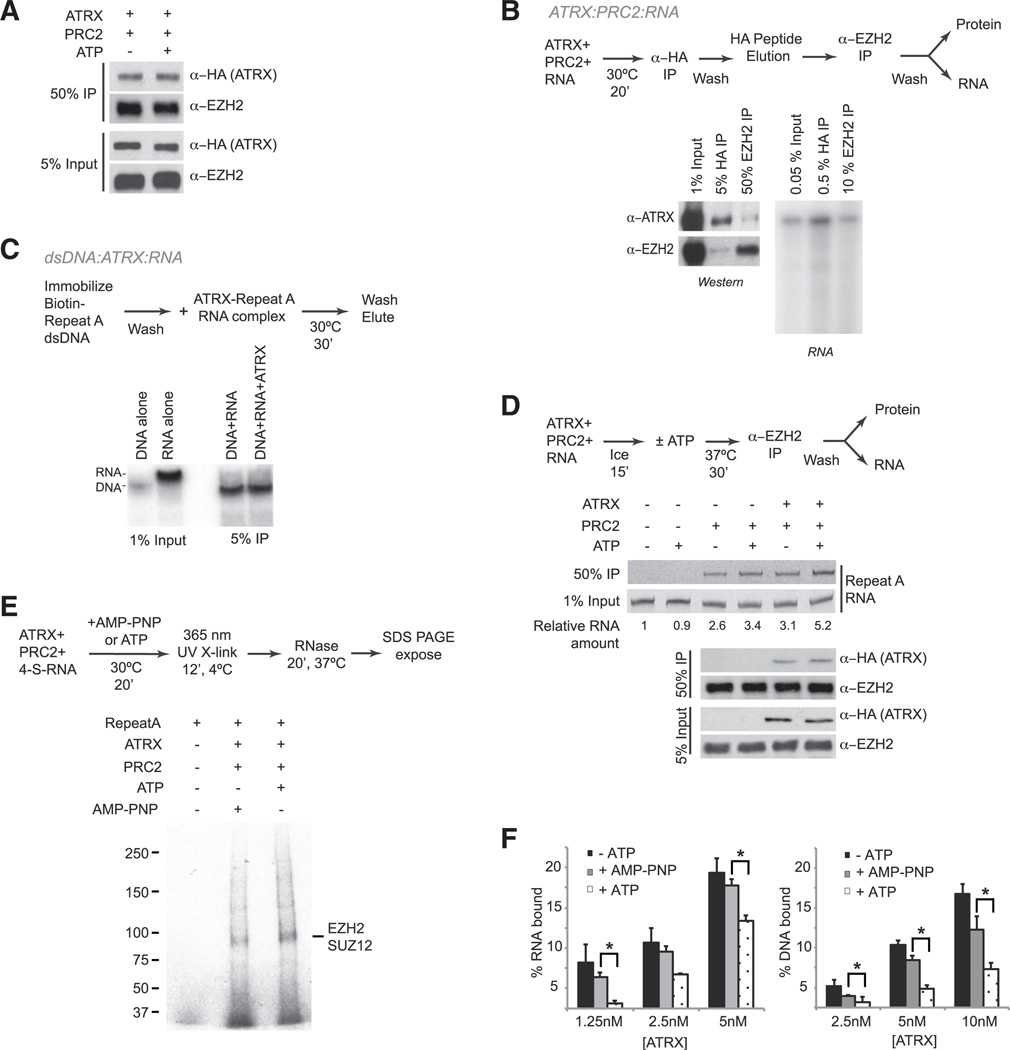
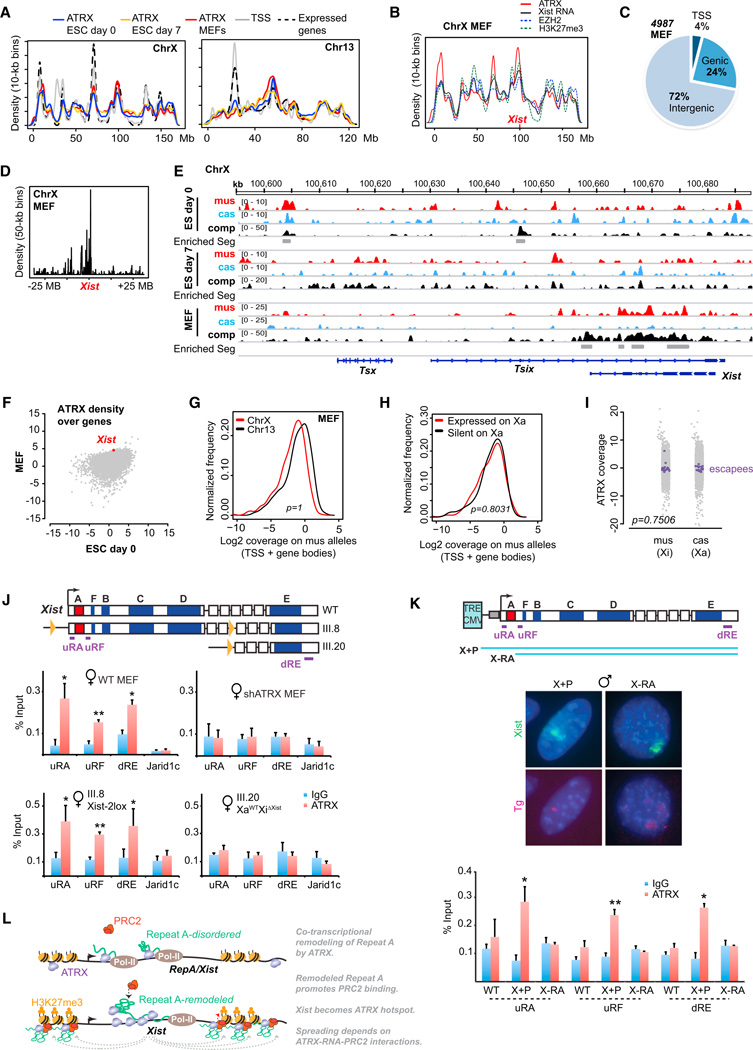
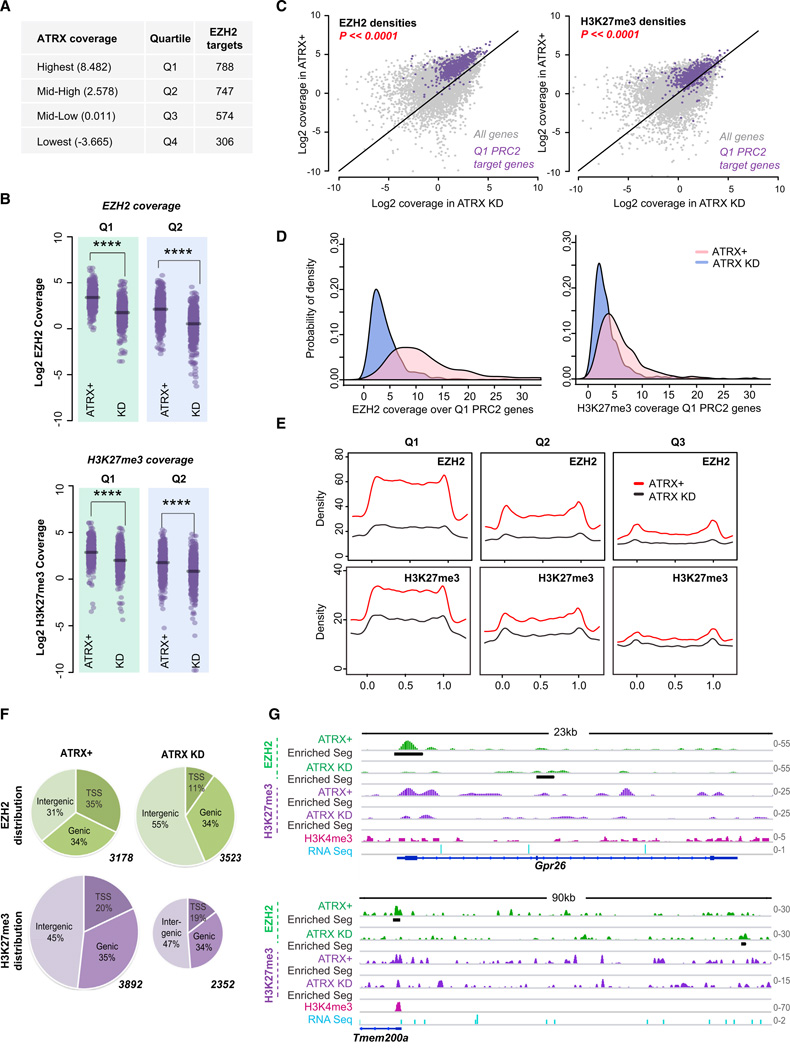
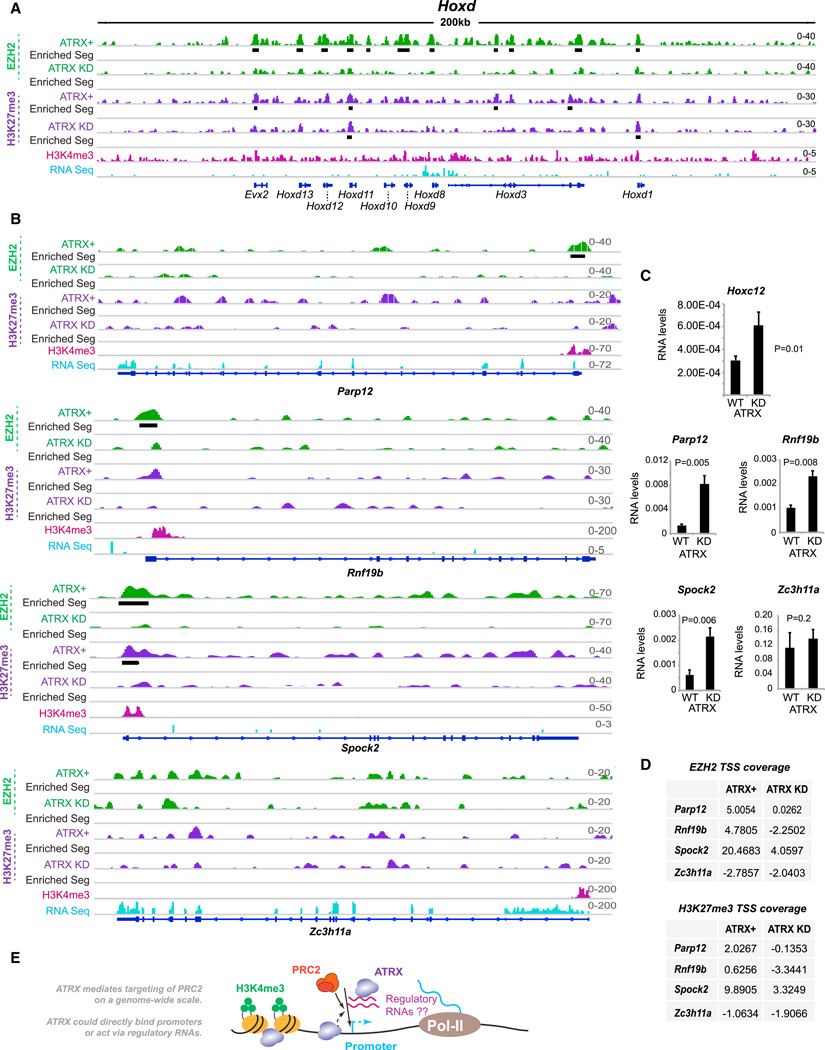
X chromosome inactivation (XCI) depends on the long noncoding RNA Xist and its recruitment of Polycomb Repressive Complex 2 (PRC2). PRC2 is also targeted to other sites throughout the genome to effect transcriptional repression. Using XCI as a model, we apply an unbiased proteomics approach to isolate Xist and PRC2 regulators and identified ATRX. ATRX unexpectedly functions as a high-affinity RNA-binding protein that directly interacts with RepA/Xist RNA to promote loading of PRC2 in vivo. Without ATRX, PRC2 cannot load onto Xist RNA nor spread in cis along the X chromosome. Moreover, epigenomic profiling reveals that genome-wide targeting of PRC2 depends on ATRX, as loss of ATRX leads to spatial redistribution of PRC2 and derepression of Polycomb responsive genes. Thus, ATRX is a required specificity determinant for PRC2 targeting and function.


Figures

Figure 1
Figure 1. A Proteomics Screen Identifies ATRX as a Candidate XCI Regulator
(A) IP-MS: Colloidal blue staining of FLAG IP from control (293F) and FLAG-mH2A-expressing 293 run on a 4%–20% (left) and a 6% (right) SDS gradient gel. FLAG IP was validated by western blot. (B) Left: Immunostaining of ATRX, EZH2, and H3K27me3 in WT and two independent stable ATRX-KD MEF lines (shATRX-1, -2). Sample size (n) and %EZH2 association with Xi are shown. Middle: western blot showing ATRX depletion but constant EZH2 levels in shATRX-1 and shATRTX-2 female MEFs. Right: Patterns of H3K27me3 observed, n = 100–150 per experiment. (C) Left: Xist RNA FISH in indicated fibroblast lines. Right: qRT-PCR analyses of Xist RNA levels. Standard error (SE) bars from three independent experiments are shown with Student’s t test P values. (D) Left: Immunostaining of ATRX and EZH2 in MEFs transiently transfected with scrambled shRNA (shScr) and two shATRX constructs (shATRX-1, shATRX-2). Right: H3K27me3 staining and Xist RNA FISH show no change in the intensity or foci number after transient ATRX KD.
Figure 2
Figure 2. ATRX Is Required for Initiation of XCI during ES Cell Differentiation
(A) Western blot of ATRX and EZH2 after stable ATRX KD. (B) ATRX immunostaining after stable ATRX-KD. (C) Representative phase contrast images of embryoid bodies during a differentiation time course. (D) qRT-PCR analysis of Tsix and Xist RNA, normalized to tubulin RNA, during a differentiation time course. SE from three independent experiments shown. (E) Immunostaining of EZH2 and ATRX at day 8 of differentiation, (n) and % with EZH2 Xi foci are indicated. (F) Immunostaining of ATRX and H3K27me3 and Xist RNA FISH at day 10 of differentiation, (n) and % positive are shown. (G) Left: western blot of indicated histone marks in day 8 ESCs. Graphs: Time course of Xist upregulation and acquisition of H3K27me3foci. n = 80–120 per time point. (H) Western blot for ATRX, EZH2, and CTCF (control) in transgene (X+P) cells and in the same cell line expressing shATRX (X+P shATRX). (I) qRT-PCR of Xist RNA before and after doxycycline induction in transgenic cells. SE from three independent experiments shown. (J,K) Immunostaining of ATRX, EZH2 (J), and H3K27me3 (K), and Xist RNA/DNA FISH in indicated cells lines after 24 hr dox induction. % with shown pattern and sample size (n) are indicated.
Figure 3
Figure 3. ATRX Binds RNA and Stimulates RNA Binding to PRC2
(A,B) RIP ± UV crosslinking in X+P transgenic MEFs after dox-induction for 24 hr (A) or WTMEF(B) Primers spanning Xist exons 1–3 and U1 snRNAs were used for qPCR. One percent input was processed in parallel. SE from three independent experiments. P values calculated using Student’s t test. (C) One possible structure of Repeat A (Maenner et al., 2010). (D) Coomassie stain of purified full-length FLAG-ATRX-HA (left), C-terminal SNF2/helicase (middle), and N-terminal ADD (right) domains. (E) RNA EMSA with ATRX at indicated concentrations and 0.2 nM of each probe. B, bound; U, unbound probe. (F) Left: Binding Isotherms of ATRX for indicated RNAs. SE from three independent experiments shown. Right: table summarizing Kd’s and R2 values. ≫200 nM indicates Kd’s out of the assay range. N/A, not applicable. (G) EMSA of ATRX with different RNA, dsDNA, or ssDNA probes. (H) Left: Binding Isotherms of ATRX for indicated DNAs. SE for three independent experiments shown for each point. Right: table summarizing Kd’s and R2 values. ≫200 nM indicates Kd’s out of the assay range. N/A, not applicable. (I) RNA and DNA EMSAs using ATRX truncation mutants, with summary of results.
Figure 4
Figure 4. A Ternary Complex of ATRX, PRC2, and RNA, with Stimulation of PRC2 Binding in an ATP-Dependent Manner
(A) FLAG-ATRX-HA binding to PRC2 ± ATP in the absence of RNA. HA-immunoprecipitated material was probed with α-EZH2 antibodies for western. (B) Tandem IP to detect ternary complex formation between ATRX, Repeat A RNA, and PRC2. (C) Binding reaction to test for simultaneous association of ATRX with RNA and DNA. RNA and DNA can be discerned by their different electrophoretic mobilities. (D) Top: Inverted image of RNA gel showing Repeat A RNA recovered after EZH2 IP ± ATRX and ± ATP. Bottom: western blot showing protein levels in input and recovered after IP. Representative results from three independent experiments shown. (E) Photocrosslinking of PRC2 and Repeat A RNA in the presence of ATRX with ATP or AMP-PNP. Representative results from 5 biological replicates shown. (F) Filter binding of ATRX binding to Repeat A RNA (left) or DNA (right) ± ATP and +AMP-PNP. ATRX concentrations are indicated and SE from three independent experiments shown. *p < 0.05.
Figure 5
Figure 5. An ATRX Hot Spot at the Xist Locus Requires Function of Repeat A
(A) Chromosome-wide profiles of ATRX coverage on Xi and Chr13 show input-normalized ATRX density over 10 Kb bins, gene (TSS) density, and the density of transcriptionally active genes based on previous data (Yang et al., 2010). (B) Allele-specific analysis: Normalized densities (10-kb bins, smoothened) of Xist RNA, EZH2, H3K27me3 (Pinter et al., 2012; Simon et al., 2013), and ATRX in female MEFs along X. (C) ATRX peak distribution in MEFs across promoter (TSS+/−3 kb), genie, and intergenic regions. (D) ATRX densities at 50-kb resolution across 50 Mb of the Xic, centered on Xist. (E) Allele-specific ATRX ChIP-seq tracks showing M. musculus (mus), M. castaneus (cas), and composite (comp) reads across the Xist locus in day 0 and 7 ESC and MEFs. Comp track includes all aligned reads, both allelic and nonallelic. Positions of peaks/enriched segments (gray bars) are shown under comp tracks. Representative autosomal tracks (Chr13) shown in Figure S4C. (F) ATRX genie densities for all genes in MEFs (y axis) and ESC (x axis). (G) ATRX coverages on gene bodies of mus alleles for ChrX and Chr13 in female MEFs. KS test, p = 1. (H) Log2 ATRX coverage densities for Xi genes classified as “expressed on Xa” (FPKM ≥ 1) or “silent on Xa” (FPKM < 1). KS test, p = 0.80 (I) ATRX coverage on XCI escapees (purple) on mus or cas alleles. Grey, all other ChrX genes. P value was computed between mus and cas escapees using KS test. (J) Map of Xist alleles in WT, XaWT Xi2lox (III.8), and the conditional Xist deletion XaWT XiΔXist (III.20) MEF lines, with ChIP-qPCR amplicon positions and ChIP-qPCR results (graphs) for ATRX. Averages of three independent ATRX ChIP expressed as % of input, with SE shown. *p < 0.05. **p < 0.005 (Student’s t test). (K) RNA/DNA FISH for Xist RNA and transgenic DNA in the transgenic X+P and X-RA male MEF lines after 24h dox-induction. Map of transgenes shown on top. Bottom graph: ChIP-pPCR of corresponding WT and transgenic MEF lines 24h after dox-induction of Xist. Averages of three independent ChIP-qPCR experiments shown with SE. *p < 0.05. **p < 0.005 (Student’s t test). (L) Model: RepA/Xist RNAs cotranscriptionally recruit ATRX. ATRX may be “poised” to bind RNA via Repeat A dsDNA. ATRX remodels Repeat A RNA motif and enhances binding of PRC2. The Xist locus becomes an ATRX hot spot. Spreading depends on the ATRX-RNA-PRC2 interactions.
Figure 6
Figure 6. Global Roles of ATRX in Regulating PRC2 Localization and Function
(A) RefSeq genes (21,677) divided into equal quartiles (Q1-Q4) based on ATRX coverage. Average ATRX coverages and number of EZH2 target genes (peaks) in each quartile are shown. (B) Dot plots showing Log2 densities of EZH2 and H3K27me3 in ATRX+ versus ATRX KD MEFs for each quartile. ****p ≪ 0.0001, as calculated by the Student’s t test. (C) Scatterplot of EZH2 and H3K27me3 densities in Log2 scale overall genes (gray dots) and Q1 PRC2 target genes (purple dots) in ATRX+ or ATRX KD MEFs. The difference between ATRX+ and ATRX KD cells of Q1 PRC2 target genes is highly significant (p < 2.2 × 10⁻¹⁶, Student’s t test) for both epitopes. (D) Probability density function for EZH2 and H3K27me3 based on coverages over the Q1-PRC2 target genes in the indicated MEF samples. (E) Metagene profiles of EZH2 (top) and H3K27me3 (bottom) coverage. The metagenes are scaled 0 to 1 from genie start (TSS, x = 0) to end (TTS, x = 1). (F) Distribution of EZH2 and H3K27me3 peaks in indicated MEF samples. Peaks are categorized as TSS (+/— 3Kb), genie, or intergenic. Total number of peaks called for each data set is indicated next to each chart. (G) ChIP-seq tracks showing EZH2 and H3K27me3 densities in ATRX+ and ATRX-KD MEFs. Black bars, significantly enriched segments. H3K4me3 (pink) and RNA Seq (blue) tracks are as published (Yang et al., 2010; Yildirim et al., 2012).
Figure 7
Figure 7. Loss of EZH2 from Target Genes as a Result of ATRX Knockdown Results in Activation of These Genes
(A, B) Left panel: ChIP-seq tracks of the Hoxd cluster (A) or individual genes (B) showing EZH2 and H3K27me3 patterns in ATRX+ and ATRX-KD MEFs. Black bars, statistically significant enriched segments. H3K4me3 (pink) and RNA Seq (blue) tracks were previously published (Yang et al., 2010; Yildirim et al., 2012). (C) qRT-PCR analysis of expression levels before and after ATRX KD. Averages and SE of three independent experiments shown with Student’s t test P values. (D) EZH2 and H3K27me3 coverages over TSS before and after ATRX KD. (E) Model: ATRX-dependent targeting of PRC2 on a genome-wide scale. ATRX mediates targeting either by directly binding DNA, or via regulatory RNAs such as those in the PRC2 interactome.

Similar articles

Cited by

References

    1. Baumann C, De La Fuente R. ATRX marks the inactive X chromosome (Xi) in somatic cells and during imprinted X chromosome inactivation in trophoblast stem cells. Chromosoma. 2009;118:209–222. - PMC - PubMed
    1. Brown CJ, Hendrich BD, Rupert JL, Lafreniere RG, Xing Y, Lawrence J, Willard HF. The human XIST gene: analysis of a 17 kb inactive X-specific RNA that contains conserved repeats and is highly localized within the nucleus. Cell. 1992;71:527–542. - PubMed
    1. Cardoso C, Timsit S, Villard L, Khrestchatisky M, Fontés M, Colleaux L. Specific interaction between the XNP/ATR-X gene product and the SET domain of the human EZH2 protein. Hum. Mol. Genet. 1998;7:679–684. - PubMed
    1. Chadwick BP, Willard HF. Multiple spatially distinct types of facultative heterochromatin on the human inactive X chromosome. Proc. Natl. Acad. Sci. USA. 2004;101:17450–17455. - PMC - PubMed
    1. Cifuentes-Rojas C, Hernandez AJ, Sarma K, Lee JT. Regulatory interactions between RNA and polycomb repressive complex 2. Mol. Cell. 2014;55:171–185. - PMC - PubMed

Publication types