. 2014 Nov;2014(49):187-97.
doi: 10.1093/jncimonographs/lgu014.

When do changes in cancer survival mean progress? The insight from population incidence and mortality

Affiliations

When do changes in cancer survival mean progress? The insight from population incidence and mortality

Hyunsoon Cho et al. J Natl Cancer Inst Monogr. 2014 Nov.

Abstract

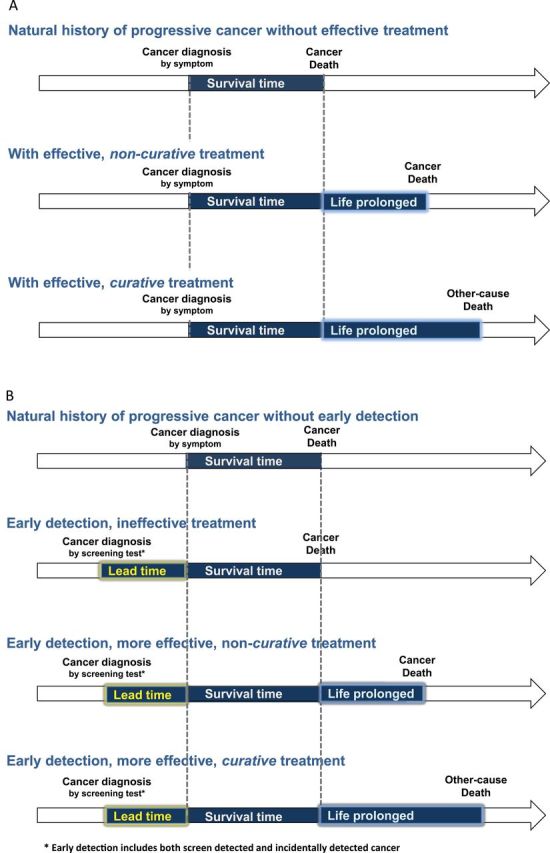
Background: It is often assumed that increases in cancer survival reflect true progress against cancer. This is true when these increases are accompanied by decreased burden of disease: Fewer people being diagnosed or dying from cancer (ie, decreased incidence and mortality). But increased survival can also occur even when incidence is increasing and mortality is unchanged.

Objective: To use trends in cancer burden-incidence and mortality-to illustrate when changes in survival reflect true progress.

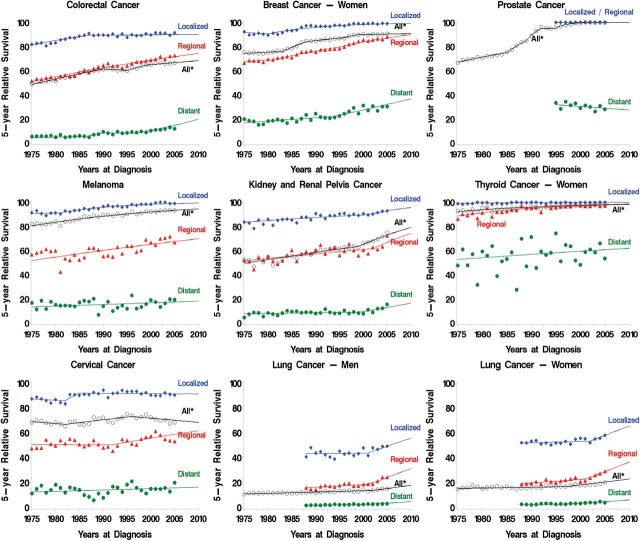
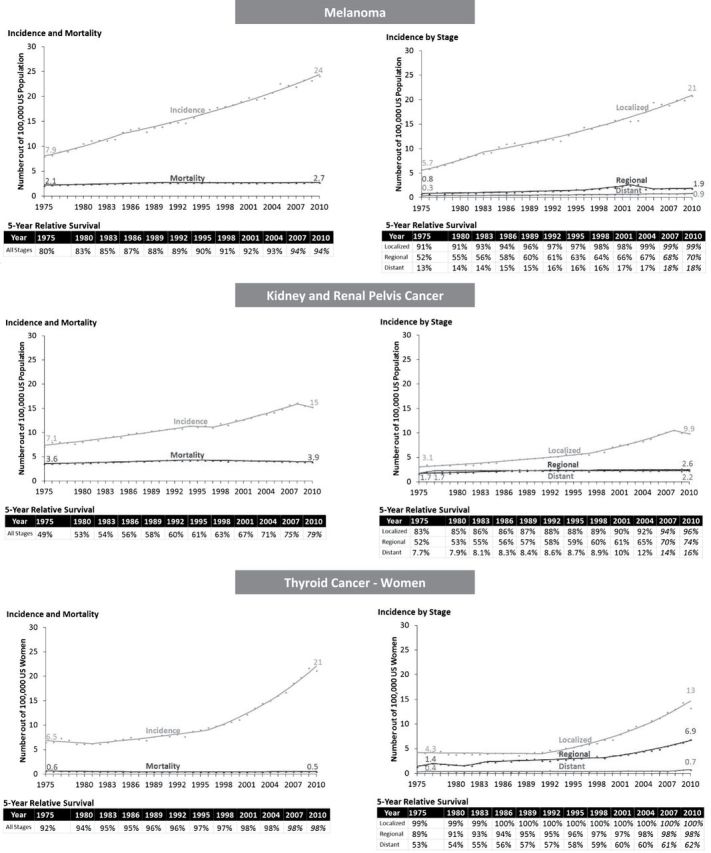
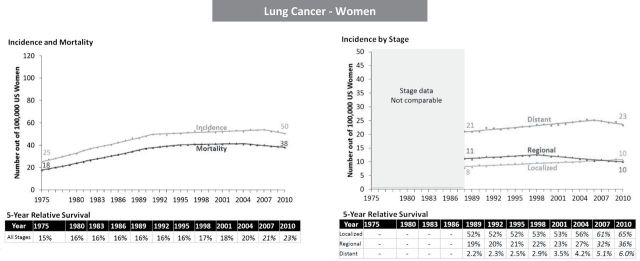
Methods: Using data from 1975 to 2010 collected by the Surveillance, Epidemiology, and End Results Program (incidence, survival) and the National Center for Health Statistics (mortality), we analyzed US trends in five-year relative survival, age-adjusted incidence, and mortality for selected cancers to identify patterns that do and do not reflect progress.

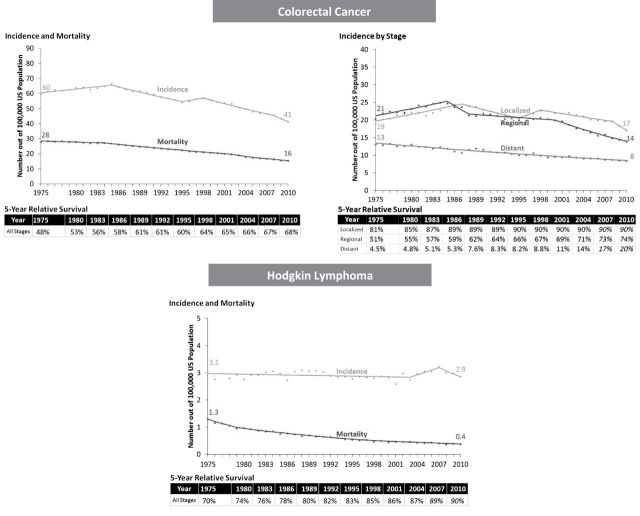
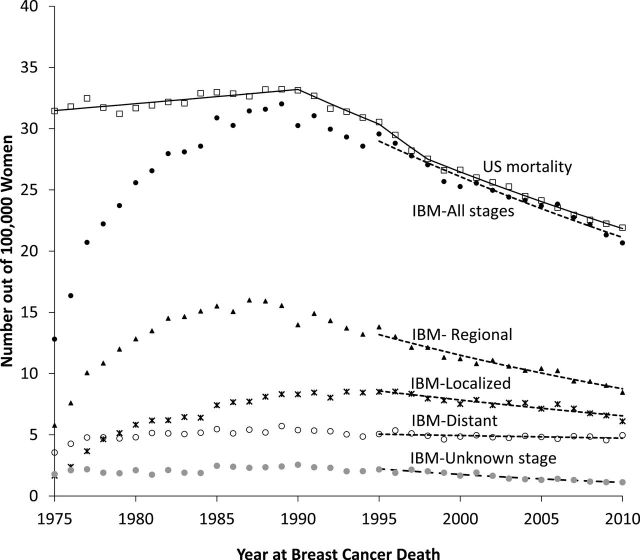
Results: Among the nine common cancers examined, survival increased in seven, and changed little or not at all for two. In some cases, increased survival was accompanied by decreased burden of disease, reflecting true progress. For example, from 1975 to 2010, five-year survival for colon cancer patients improved (from 48% to 68%) while cancer burden fell: Fewer cases (incidence decreased from 60 to 41 per 100,000) and fewer deaths (mortality decreased from 28 to 16 per 100,000), a pattern explained by both increased early detection (with removal of cancer precursors) and more effective treatment. In other cases, however, increased survival did not reflect true progress. In melanoma, kidney, and thyroid cancer, five-year survival increased but incidence increased with no change in mortality. This pattern suggests overdiagnosis from increased early detection, an increase in cancer burden.

Conclusions: Changes in survival must be interpreted in the context of incidence and mortality. Increased survival only represents progress when accompanied by a reduction in incidence, mortality, or ideally both.


Figures

Figure 1.
Figure 1.
Trends in five-year relative survival by stage (local, regional, distant and all stages)—selected cancer sites (Hodgkin lymphoma not shown). Symbols represent observed values, lines represent estimated values from the joinpoint survival models. *All= All stages.
Figure 2.
Figure 2.
Progress: Increase in survival, lower disease burden. Symbols represent observed values, lines represent estimated values from the joinpoint regression models. Five-year relative survivals are estimated from the joinpoint survival models and projected values are italicized.
Figure 3.
Figure 3.
Progress: Little or no increase in survival, lower disease burden. Symbols represent observed values, lines represent estimated values from the joinpoint regression models. Five-year relative survivals are estimated from the joinpoint survival models and projected values are italicized.
Figure 4.
Figure 4.
Mixed progress: Increase in survival, increased incidence, decreased mortality. Symbols represent observed values, lines represent estimated values from the joinpoint regression models. Five-year relative survivals are estimated from the joinpoint survival models and projected values are italicized.
Figure 5.
Figure 5.
No progress: Increase in survival, higher disease burden. Symbols represent observed values, lines represent estimated values from the joinpoint regression models. Five-year relative survivals are estimated from the joinpoint survival models and projected values are italicized.
Figure 6.
Figure 6.
No progress: Little or no increase in survival, higher disease burden. Symbols represent observed values, lines represent estimated values from the joinpoint regression models. Five-year relative survivals are estimated from the joinpoint survival models and projected values are italicized.
Figure 7.
Figure 7.
Age-adjusted breast cancer mortality rates for women diagnosed with breast cancer in the Surveillance, Epidemiology, and End Results (SEER)-9 areas. Includes all breast cancer deaths from women diagnosed with breast cancer between 1975 and 2010. US mortality is obtained from data at the National Center for Health Statistics (NCHS) and incidence-based mortality (IBM) is based on incidence diagnosed from 1975 from SEER-9 area. Symbols represent observed values, lines represent estimated values from the joinpoint regression models. For IBM, joinpoint regression models were fitted to the deaths observed after 1995 to account for follow-up years need to mirror the US mortality rates from NCHS.
Figure 8.
Figure 8.
Changes in survival time. Survival time extended are highlighted in light blue (life prolonged) and yellow (lead time). The scenarios assume that cancer diagnosis shorten life expectancy. A) Survival time extended with effective treatment assuming no early detection. B) Survival time extended with lead time bias under early detection.

Similar articles

Cited by

References

    1. Philipson T, Eber M, Lakdawalla DN, Corral M, Conti R, Goldman DP. An analysis of whether higher health care spending in the United States versus Europe is ‘worth it’ in the case of cancer. Health Aff (Millwood). 2012;31(4):667–675. - PMC - PubMed
    1. Woloshin S, Schwartz LM. How a charity oversells mammography. BMJ. 2012;345:e5132. - PubMed
    1. Dickman PW, Adami HO. Interpreting trends in cancer patient survival. J Intern Med. 2006;260(2):103–117. - PubMed
    1. Chu KC, Miller BA, Feuer EJ, Hankey BF. A method for partitioning cancer mortality trends by factors associated with diagnosis: an application to female breast cancer. J Clin Epidemiol. 1994;47(12):1451–1461. - PubMed
    1. Joinpoint: Joinpoint Regression Program [computer program]. Version 4.0.4. http://surveillance.cancer.gov/joinpoint/ Bethesda, MD: Surveillance Research Program, National Cancer Institute; 2013.

Publication types