

doi: 10.1038/srep07173.
Heterogeneous red blood cell adhesion and deformability in sickle cell disease
Affiliations
- PMID: 25417696
- PMCID: PMC4241514
- DOI: 10.1038/srep07173
Item in Clipboard
Heterogeneous red blood cell adhesion and deformability in sickle cell disease
Sci Rep.
.
Abstract
We present a microfluidic approach that allows simultaneous interrogation of RBC properties in physiological flow conditions at a single cell level. With this method, we studied healthy hemoglobin A (HbA) and homozygous sickle hemoglobin (HbS) containing RBCs using whole blood samples from twelve subjects. We report that HbS-containing RBCs are heterogeneous in terms of adhesion and deformability in flow.
Figures
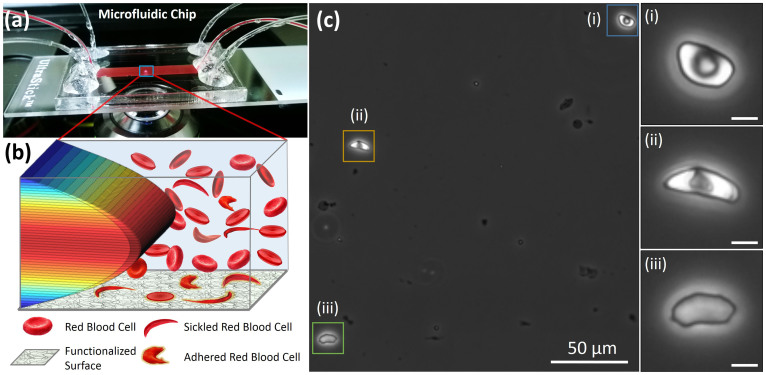
(a) Microfluidic chip contains 50 µm high channels and can interrogate unprocessed whole blood. A microchip was placed on an automated microscope stage for high resolution image recording and analysis of single RBCs. (b) Depiction of flowing and adhered RBCs on Fibronectin functionalized surface in the presence of 3D laminar flow velocity profile in the microfluidic chip. (c) Heterogeneity in adhered sickle RBC morphology was observed in microfluidic channels. RBCs from the same blood sample with different levels of sickling effect is shown: (i) mildly affected RBC, (ii) moderately affected RBC, and (iii) highly affected RBC (Scale bar represents 5 µm length).
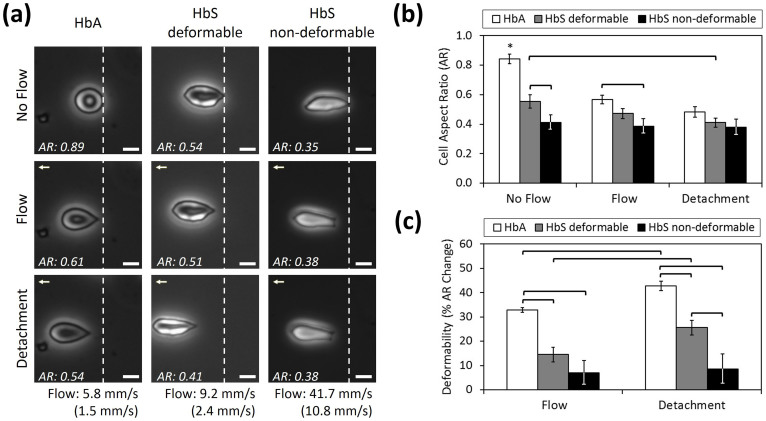
(a) Healthy and sickle RBCs at no flow, flow and at detachment conditions are shown. Flow velocities that result in detachment of RBCs in different experimental groups are noted, as bulk and as in the vicinity of the cells (in parentheses), below each column. White dashed lines denote the initial positions of RBCs at no flow condition. Flow direction is denoted with arrowhead. Scale bar represents 5 µm length. Aspect Ratio (AR) of cells in each frame are provided at the lower left of the images. Representative videos showing the behavior of each cell type in flow are provided in Supporting Information. (b) Cell AR of different RBC groups were measured at no flow, flow, and at detachment. While HbA cells present a continuous decrease in AR from no flow to detachment, HbS non-deformable cells conserved their initial AR all the way through detachment. (c) Deformability (% cell AR change with respect to no flow condition) of healthy and sickle RBCs. Deformability of HbA and HbS deformable RBCs increased significantly from flow to detachment, whereas HbS non-deformable RBCs stayed the same. Data shown is based on 14 individual RBCs (3 HbA, 6 HbS deformable and 5 HbS non-deformable RBCs) from 12 different subjects (3 normal and 9 with SCD). The horizontal lines between individual groups represent statistically significant difference based on one way ANOVA test with Fisher's post-hoc test for multiple comparisons (n = 3–6, p<0.05). Error bars represent the standard error of the mean.
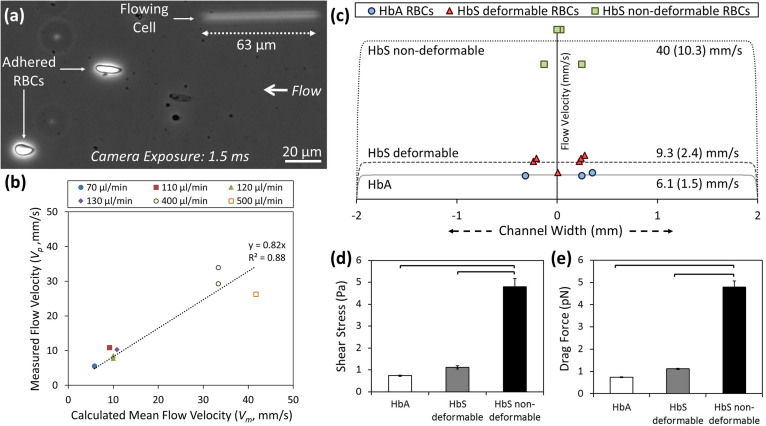
(a) Sequential images of RBCs during flow were recorded using an inverted microscope in phase contrast mode and a charge coupled device (CCD) camera. We observed both adhered and free flowing RBCs in image analysis. (b) Shown is correlation between the locally measured flow velocity and calculated mean flow velocity within the microchannels (Pearson correlation coefficient of 0.94, p<0.001). HbS non-deformable RBCs detached at relatively higher flow velocity, shear stress, and drag force compared to HbA or HbS deformable RBCs. (c) Relative positions of adhered RBCs in microchannels with respect to channel width (x- axis) and flow velocities (dotted lines), as bulk and as in the vicinity of the cells (in parentheses), at detachment instant. HbS non-deformable RBCs were significantly different than HbA and HbS deformable RBCs in terms of: (c) flow velocity, (d) shear stress, and (e) drag force at detachment. There is no difference between HbA and HbS deformable RBCs in terms of shear stress and drag force levels (p>0.05). Data shown is based on 14 individual RBCs (3 HbA, 6 HbS deformable and 5 HbS non-deformable RBCs) from 12 different subjects (3 normal and 9 with SCD). The horizontal lines between individual groups represent statistically significant difference based on one way ANOVA parametric test with Fisher's post-hoc test for multiple comparisons (n = 3–6, p<0.05). Error bars represent the standard error of the mean.
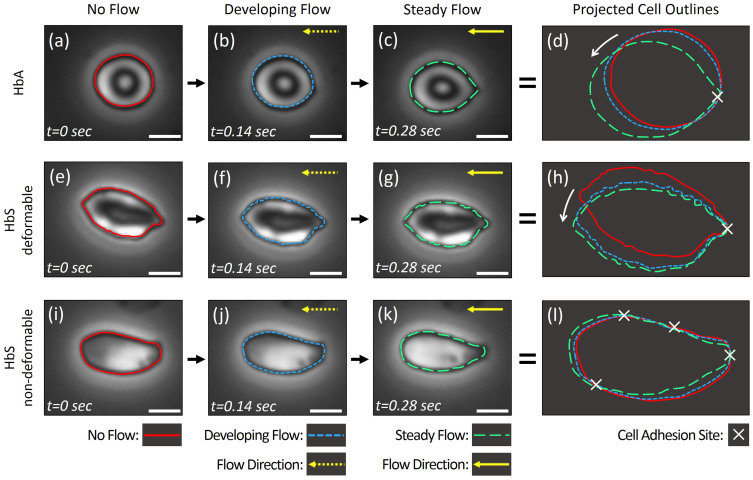
Outlines of individual RBCs in three consecutive frames taken over 0.28 seconds were projected to reflect the motion of the cells in response to initiation of fluid flow, for: (a–d) HbA-containing RBCs, (e–h) HbS-containing deformable RBCs, and (i–l) HbS-containing non-deformable RBCs (see representative videos, supporting information). HbA (a–d) and HbS deformable (e–h) cells displayed cell adhesion at a single site, which acts as a pivot (d, h), resulting in rotational motion (denoted with a white arrow in d and h) in response to fluid flow (horizontal yellow arrows). HbS non-deformable cells displayed no rotational motion and showed multiple sites of adhesion, as determined in projected cell outline analysis (l). Scale bars represent 5 µm length.
References
-
- Barabino G. A., Platt M. O. & Kaul D. K. Sickle cell biomechanics. Annu Rev Biomed Eng 12, 345–367 (2010). - PubMed
-
- Alexy T. et al. Rheologic behavior of sickle and normal red blood cell mixtures in sickle plasma: implications for transfusion therapy. Transfusion 46, 912–918 (2006). - PubMed
-
- Hebbel R. P. Beyond hemoglobin polymerization: the red blood cell membrane and sickle disease pathophysiology. Blood 77, 214–237 (1991). - PubMed
-
- Ferrone F. A. Polymerization and sickle cell disease: a molecular view. Microcirculation 11, 115–128 (2004). - PubMed
-
- Noguchi C. T. & Schechter A. N. Sickle hemoglobin polymerization in solution and in cells. Annu Rev Biophys Biophys Chem 14, 239–263 (1985). - PubMed
Publication types
MeSH terms
Substances
LinkOut - more resources
Full Text Sources
Other Literature Sources
Miscellaneous
