. 2014 Nov 24:5:5535.
doi: 10.1038/ncomms6535.

Large-scale mutational analysis of Kv11.1 reveals molecular insights into type 2 long QT syndrome

Affiliations

Large-scale mutational analysis of Kv11.1 reveals molecular insights into type 2 long QT syndrome

Corey L Anderson et al. Nat Commun. .

Abstract

It has been suggested that deficient protein trafficking to the cell membrane is the dominant mechanism associated with type 2 Long QT syndrome (LQT2) caused by Kv11.1 potassium channel missense mutations, and that for many mutations the trafficking defect can be corrected pharmacologically. However, this inference was based on expression of a small number of Kv11.1 mutations. We performed a comprehensive analysis of 167 LQT2-linked missense mutations in four Kv11.1 structural domains and found that deficient protein trafficking is the dominant mechanism for all domains except for the distal carboxy-terminus. Also, most pore mutations--in contrast to intracellular domain mutations--were found to have severe dominant-negative effects when co-expressed with wild-type subunits. Finally, pharmacological correction of the trafficking defect in homomeric mutant channels was possible for mutations within all structural domains. However, pharmacological correction is dramatically improved for pore mutants when co-expressed with wild-type subunits to form heteromeric channels.


Conflict of interest statement

Competing Financial Interests. Dr. January is a co-founder of Cellular Dynamics International. Dr. Delisle has a research contract with Gilead Scientific. The authors declare no other competing financial interests.

Figures

Figure 1
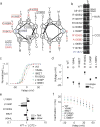
Figure 1. Topology of Kv11.1
(a) Cartoon of Kv11.1 with circles representing amino acids and cylinders representing TMD segments 1–6 and the S4–S5 linker. S1–S4 make up the VSD and the pore is located between S5 and S6. The intracellular PASD, CNBHD, and CCD are labeled in light blue. Black and blue circles show the location of all reported LQT2 and SIDS mutations, respectively. Red circles show the location of all reported SNPs. The ER retention signal RXR is highlighted in yellow and the glycosylation site at N598 is shown with a blue diamond. (b) Linear representation of the different Kv11.1 domains (to scale) showing the number and domain location of all LQT2-linked and SIDS mutations identified to date. The number characterized in this study are in parentheses (59 of 64 mutations for the EAGD, 73 of 100 mutations for the pore, 29 of 41 mutations for the C-linker and CNBHD, and 9 of 36 mutations for the Distal C-terminus).
Figure 2
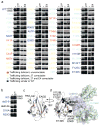
Figure 2. Trafficking phenotype and structural context of LQT2-linked EAGD missense mutations
(a, b) Representative immunoblots of transiently transfected HEK293 cells comparing trafficking under control culture conditions at 37°C, at reduced temperature (27°C, 24hrs) or in E4031 (E4, 24hrs). Dashes (-) indicate the 140kD molecular weight marker. Mutations are color-coded as follows: trafficking deficient and uncorrectable in red, trafficking deficient but correctable at 27°C in yellow, trafficking deficient but correctable at 27°C or with E4031 in light blue, and those that traffic similar to WT in blue. (c) Crystal structure of the EAGD (PDB: 4HP9). Mapped LQT2 residues correspond to panel A and uncharacterized mutations (I96V and D102A) are black. (d) Representation of the EAGD (PDB: 4HP9) complexed with the C-linker/CNBHD model from alignments to the structure of the EAGD-CNBHD complex from mouse (PDB: 4LLO). C-linker region is shown in green, CNBHD in blue, and intrinsic ligand in magenta. Mutations that are trafficking competent (blue balls) are labeled. An example of a full length immunoblot can be found in Supplementary figure 2.
Figure 3
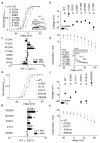
Figure 3. Electrophysiological properties of LQT2-linked EAGD and C-linker/CNBHD missense mutations
(a, e) Activation current-voltage (I-V) relationships. From a holding potential of −80mV, cells were depolarized to voltages between −70mV and 50mV in 10mV increments for 3s to quantify tail current. I-V relations were determined by normalizing peak tail currents (Itail) from each step to the maximal peak Itail. (b, f) V1/2 and slope factors. The voltage at which peak IKv11.1 was half-maximal (V1/2) and the slope factor (k) were determined by fitting the normalized I-V relationship with the Boltzmann function. (c, g) WT-to-mutant time constant ratios (speeding factor) for deactivation at −50mV. The fast (taufast) and slow (tauslow) time constants of channel deactivation were determined with a double exponential fit of the Itail decay from 50mV to −50mV (red trace).. (d, h) Inactivation time constants determined at 0mV. From a holding potential of −80mV, cells were depolarized to 50mV for 1.5s to open and inactivate channels followed by a short 10ms step to −100mV to remove inactivation without allowing enough time for the channels to deactivate. This was followed by test pulses from −30mV to 60mV in 10mv increments. Inactivation time constants for each step were fit with a single exponential. Error bars are SEM. Asterisks indicate statistical significance (p<0.05). n = 3 to 9 HEK293 cells for each experiment.
Figure 4
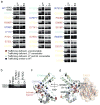
Figure 4. Trafficking phenotype and structural context of LQT2-linked Clinker/CNBHD LQT2 missense mutations
(a, b) Representative immunoblots of transiently transfected HEK293 cells comparing trafficking under control conditions at 37°C, at reduced temperature (27°C, 24hrs) or in E4031 (E4, 24 hrs). Dashes (-) indicate the 140kD molecular weight marker. Mutations are color-coded as follows: trafficking deficient and uncorrectable in red, trafficking deficient but correctable at 27°C in yellow, trafficking deficient but correctable at 27°C or with E4031 in light blue and those that traffic similar to WT in blue. (c) Model of the C-linker/CNBHD with C-linker region in green, CNBHD in blue, and intrinsic ligand in magenta. Mapped LQT2 residues correspond to panel A and uncharacterized mutations (L678P, L693P, I728F) are black. (d) Representation of the EAGD (colored wheat) (PDB: 4HP9) complexed with the C-linker/CNBHD model from alignments to the structure of the EAGD-CNBHD complex from mouse (PDB: 4LLO).
Figure 5
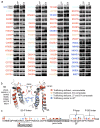
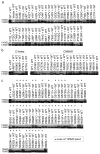
Figure 5. Trafficking phenotype of LQT2-linked pore missense mutations
(a) Representative immunoblots of transiently transfected HEK293 cells comparing trafficking under control conditions at 37°C, at reduced temperature (27°C) or in E4031 (E4). Dashes (-) indicate the 140kD molecular weight marker. Mutations are color-coded as follows: trafficking deficient and uncorrectable in red, trafficking deficient but correctable at 27°C or with E4031 in light blue, trafficking deficient but only correctable with E4031 in orange and those that traffic similar to WT in blue. (b) Structural model of the pore with Terfenadine (blue molecule) modeled into the putative drug-binding domain. Mapped LQT2 residues correspond to panel A and uncharacterized mutations (M574R and L622F) are black. (c) Linear representation of the S5–S6 pore linker with helices represented as cylinders and colored dots representing the different trafficking phenotypes associated with each residue (e.g. G626).
Figure 6
Figure 6. Trafficking phenotype of LQT2-linked distal C-terminus missense mutations
(a) Helical wheel diagram showing two of the four helices forming the coiled coil domain with LQT2 mutations underlined in black, SIDS mutations in blue and SNPs red. (b) Representative immunoblots of transiently transfected HEK293 cells comparing trafficking under control conditions at 37°C and at reduced temperature (27°C). Dashes (-) indicate the 140kD molecular weight marker. (c) I-V relationships. (d) V1/2 and slope factors. (e) WT-to-mutant time constant ratios (speeding factor) for deactivation at −50mV. (f) Inactivation time constants determined at 0mV. Protocols are described in Fig. 3. Error bars are SEM. Asterisks indicate statistical significance (p<0.05). n = 4 to 12_HEK293 cells for each experiment.
Figure 7
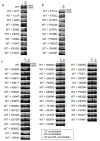
Figure 7. Trafficking phenotype of LQT2 missense mutations co-expressed with WT
Representative immunoblots of transiently transfected HEK293 cells co-expressing WT and mutant under control conditions. Dashes (-) indicate the 140kD molecular weight marker. Asterisks (*) indicate complete absence of the 155kD band.
Figure 8
Figure 8. Correction of heteromeric Kv11.1 channels
Representative immunoblots of transiently transfected HEK293 cells co-expressing WT and mutant alleles as heteromeric channels under control conditions (-), with culture at 27°C (24hrs) or culture in E4031 (E4, 24 hrs). Dashes (-) indicate the 140kD molecular weight marker. Yellow, orange, and blue asterisks indicate correction at 27°C, in E4031, or both, respectively, that were not correctable under those conditions as homomeric channels. H562P is also included, which was not completely dominant negative.
Figure 9
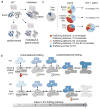
Figure 9. Model of Kv11.1 biogenesis and correction
(a) Model illustrating class 2 and/or class 3 loss-of-function phenotypes for EAGD and C-linker/CNBHD mutations. Mutations can either be destabilizing resulting in misfolding and ERAD (top right, out of focus), disrupt protein-protein interactions resulting in quicker deactivation (bottom left, separated) or both (bottom right). (b) Summary of the trafficking phenotypes by domain for Kv11.1 homomeric channels and channels co-expressed with WT. Number of mutations analyzed are in parentheses (see also Supplementary Tables 2,3,4). (c) Simplified five step folding model illustrating the different correction phenotypes based on data reported here and elsewhere (see discussion). The most destabilizing PASD and C-linker/CNBHD mutations fail to make it to step 2 and undergo ERAD (red). These are uncorrectable at 27° or with E4. Less destabilizing mutations make it further along the folding pathway (step 2) and are amenable to 27°C temperature correction but not E4 pharmacological correction (yellow). Mildly destabilizing mutations make it to step 3 where E4031, which acts postranslationally, can facilitate cooperative interactions between subunits allowing for correction. (d) Pore mutations (orange) behave differently. Most are stable enough to make it to step 4 but result in severe dominant-negative effects causing both WT and mutant to undergo ERAD. These heteromeric channels fail to make it to step 5 (dashed outlines) required for ER exit but can undergo improved folding and ER exit with pharmacological correction strategies.

Similar articles

Cited by

References

    1. Curran ME, et al. A molecular basis for cardiac arrhythmia: HERG mutations cause long QT syndrome. Cell. 1995;80(5):795–803. - PubMed
    1. Tester DJ, Ackerman MJ. Sudden infant death syndrome: How significant are the cardiac channelopathies? Cardiovasc Res. 2005;67:388–396. - PubMed
    1. Brugada R, et al. Sudden death associated with short-QT syndrome linked to mutations in HERG. Circulation. 2004;109(1):30–5. - PubMed
    1. Crociani O, et al. Cell cyce-dependent expression of HERG1 and HERG1B isoforms in tumor cells. J Biol Chem. 2003;278:2947–2955. - PubMed
    1. Johnson JN, et al. Identification of a possible pathogenic link between long QT syndrome and epilepsy. Neurology. 2009;27:224–231. - PMC - PubMed

Publication types

MeSH terms

Substances

Supplementary concepts