. 2014 Nov 11;3(5):832-40.
doi: 10.1016/j.stemcr.2014.08.011. Epub 2014 Sep 25.

Transmembrane Inhibitor of RICTOR/mTORC2 in Hematopoietic Progenitors

Affiliations

Transmembrane Inhibitor of RICTOR/mTORC2 in Hematopoietic Progenitors

Dongjun Lee et al. Stem Cell Reports. .

Abstract

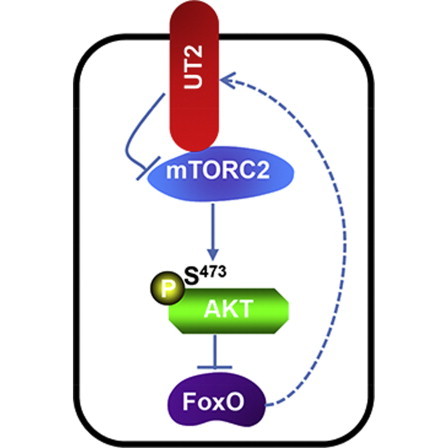
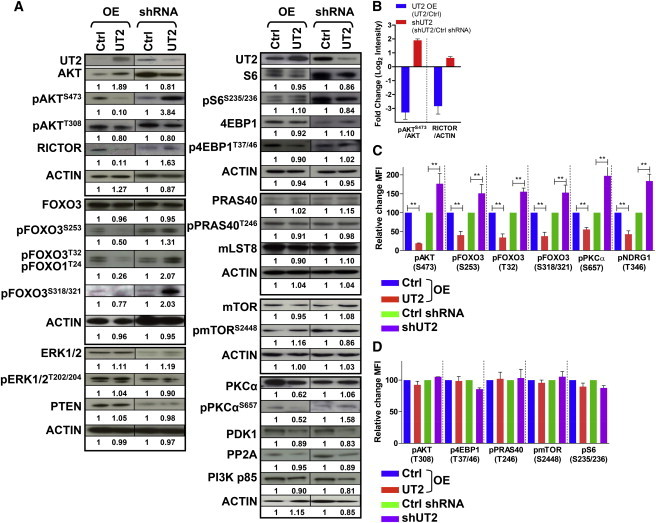
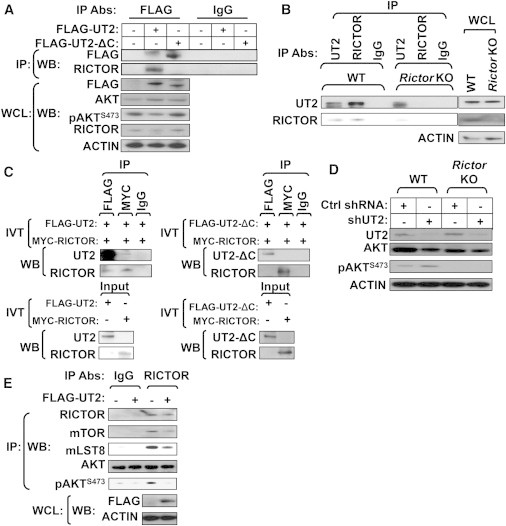
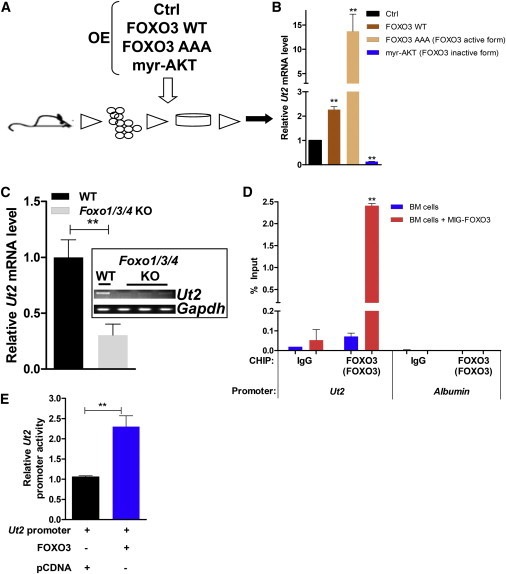
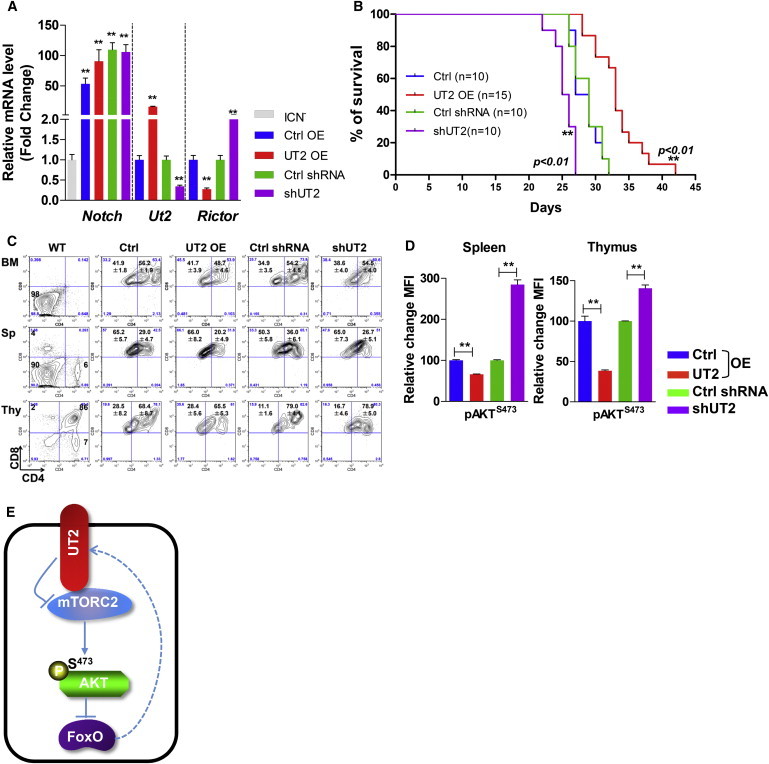
Central to cellular proliferative, survival, and metabolic responses is the serine/threonine kinase mTOR, which is activated in many human cancers. mTOR is present in distinct complexes that are either modulated by AKT (mTORC1) or are upstream and regulatory of it (mTORC2). Governance of mTORC2 activity is poorly understood. Here, we report a transmembrane molecule in hematopoietic progenitor cells that physically interacts with and inhibits RICTOR, an essential component of mTORC2. Upstream of mTORC2 (UT2) negatively regulates mTORC2 enzymatic activity, reducing AKT(S473), PKCα, and NDRG1 phosphorylation and increasing FOXO transcriptional activity in an mTORC2-dependent manner. Modulating UT2 levels altered animal survival in a T cell acute lymphoid leukemia (T-ALL) model that is known to be mTORC2 sensitive. These studies identify an inhibitory component upstream of mTORC2 in hematopoietic cells that can reduce mortality from NOTCH-induced T-ALL. A transmembrane inhibitor of mTORC2 may provide an attractive target to affect this critical cell regulatory pathway.


Figures

None
Graphical abstract
Figure 1
Figure 1
UT2 Regulates the mTORC2/AKT/FOXO Axis in Primary Hematopoietic Cells (A) Primary hematopoietic cells from cells overexpressing or depleted for UT2 were analyzed by western blotting using the indicated antibodies. ACTIN was used as a loading control (n = 2–3 experiments). (B) Graphs show the fold change of the indicated normalized protein ratios (pAKTS473/AKT and RICTOR/ACTIN) in (A). Data are means ± SEM (n = 3 experiments). (C and D) Flow cytometry was performed on hematopoietic cells overexpressing or shRNA-depleted for UT2. Quantification of the fold change in mean fluorescence intensity for the indicated phosphoprotein in these cells is shown. Data are means ± SEM (n = 2–3 experiments; two-tailed, unpaired t test). p < 0.05, ∗∗p < 0.01. See also Figure S1.
Figure 2
Figure 2
UT2 Interacts with mTORC2/RICTOR and Regulates Their Activities in Primary Hematopoietic Cells (A) HEK293T cells transfected with vectors encoding either Flag-UT2 full length or Flag-UT2 ΔC mutant were lysed and subjected to IP using an antibody directed against FLAG and IgG, respectively. The resulting precipitates and corresponding whole-cell lysates (WCLs) were subjected to western blot analysis using the indicated antibodies (n = 3 experiments). (B) RICTOR or UT2 was immunoprecipitated from WT and conditional homozygous deletion of Rictor BM cells and subjected to western blot analysis using the indicated antibodies (n = 6 mice pool per each genotype). (C) In vitro-translated FLAG-UT2 full length (left) or FLAG-UT2 ΔC mutant (right) proteins were subjected to IP using the indicated antibodies in the presence of in vitro-translated myc-RICTOR protein (n = 2–3 experiments). (D) WT and conditional homozygous deletion of Rictor BM cells expressing shRNA constructs against control or UT2 were subjected to western blot analysis using the indicated antibodies (n = 3 mice pool per each genotype). (E) Endogenous RICTOR was immunoprecipitated from control and HEK293T cells transfected with vectors encoding FLAG-UT2 full length and subjected to in vitro kinase assays using recombinant inactive AKT as the substrate and pAKTS473 as the readout. An immunoblot for the levels of RICTOR, mTOR, and mLST8 in each immunoprecipitate is shown (n = 3 experiments). See also Figure S2.
Figure 3
Figure 3
FOXO3 Activates Ut2 Expression in Primary Hematopoietic Cells (A) Schematic representation of a gene-expression assay in primary hematopoietic cells. (B) Quantitative RT-PCR for Ut2 expression. Data are means ± SEM (n = 3 experiments; two-tailed, unpaired t test). ∗∗p < 0.01. (C) Ut2 expression in primary hematopoietic cells from WT and Foxo1/3/4 KO mice. Data are means ± SEM (n = 3 mice per each genotype; two-tailed, unpaired t test). ∗∗p < 0.01. (D) ChIP analysis for MIG-FOXO3 or mock expressing BM cells, using the indicated antibodies. Data are means ± SEM (n = 3 experiments; two-tailed, unpaired t test). ∗∗p < 0.01. (E) Relative luciferase activity of FOXO3 on the Ut2 promoter. Data are means ± SEM (n = 4 experiments; two-tailed, unpaired t test). ∗∗p < 0.01. See also Figure S3.
Figure 4
Figure 4
UT2 Extends the Disease Latency of T-ALL in Mice (A) Expression profile of the indicated genes before BM transplantation (BMT) assays. Primary hematopoietic cells from C57BL/6 5-fluorouracil (5-FU)-injected donors with cells overexpressing or shRNA-depleted for UT2 were transduced with overexpressing intracellular NOTCH1 (ICN), and then BMT assays were performed. Data are means ± SEM (n = 3 experiments; two-tailed, unpaired t test). p < 0.05. ∗∗p < 0.01. “Control” represents ICN-transduced cells. (B) Kaplan-Meier survival curves for recipient mice after transplantation of ICN1-transduced BM cells from cells overexpressing or shRNA-depleted for UT2 as described in (A) (n = 10–11 biological replicated experiments, log rank test). ∗∗p < 0.01. (C) Flow-cytometry analysis of various hematopoietic tissues from T-ALL recipient mice in (A) (n = 8–9 biological replicated experiments). (D) Expression of phosphorylated AKT on S473 in spleen and thymus from recipient mice in (A). Animals were examined when they were moribund. Data are means ± SEM (n = 8–9 biological replicated experiments, two-tailed, unpaired t test). ∗∗p < 0.01. (E) UT2 negatively regulates AKT signaling by modulating the activity of RICTOR/mTORC2. See also Figure S4.

References

    1. Blackburn J.S., Liu S., Wilder J.L., Dobrinski K.P., Lobbardi R., Moore F.E., Martinez S.A., Chen E.Y., Lee C., Langenau D.M. Clonal evolution enhances leukemia-propagating cell frequency in T cell acute lymphoblastic leukemia through Akt/mTORC1 pathway activation. Cancer Cell. 2014;25:366–378. - PMC - PubMed
    1. Brunet A., Bonni A., Zigmond M.J., Lin M.Z., Juo P., Hu L.S., Anderson M.J., Arden K.C., Blenis J., Greenberg M.E. Akt promotes cell survival by phosphorylating and inhibiting a Forkhead transcription factor. Cell. 1999;96:857–868. - PubMed
    1. Chiang M.Y., Xu L., Shestova O., Histen G., L’heureux S., Romany C., Childs M.E., Gimotty P.A., Aster J.C., Pear W.S. Leukemia-associated NOTCH1 alleles are weak tumor initiators but accelerate K-ras-initiated leukemia. J. Clin. Invest. 2008;118:3181–3194. - PMC - PubMed
    1. García-Martínez J.M., Alessi D.R. mTOR complex 2 (mTORC2) controls hydrophobic motif phosphorylation and activation of serum- and glucocorticoid-induced protein kinase 1 (SGK1) Biochem. J. 2008;416:375–385. - PubMed
    1. Guertin D.A., Stevens D.M., Thoreen C.C., Burds A.A., Kalaany N.Y., Moffat J., Brown M., Fitzgerald K.J., Sabatini D.M. Ablation in mice of the mTORC components raptor, rictor, or mLST8 reveals that mTORC2 is required for signaling to Akt-FOXO and PKCalpha, but not S6K1. Dev. Cell. 2006;11:859–871. - PubMed

Publication types

MeSH terms

Substances