. 2014 Nov 11;3(5):841-57.
doi: 10.1016/j.stemcr.2014.09.006. Epub 2014 Oct 11.

A dominant-negative isoform of IKAROS expands primitive normal human hematopoietic cells

Affiliations

A dominant-negative isoform of IKAROS expands primitive normal human hematopoietic cells

Philip A Beer et al. Stem Cell Reports. .

Abstract

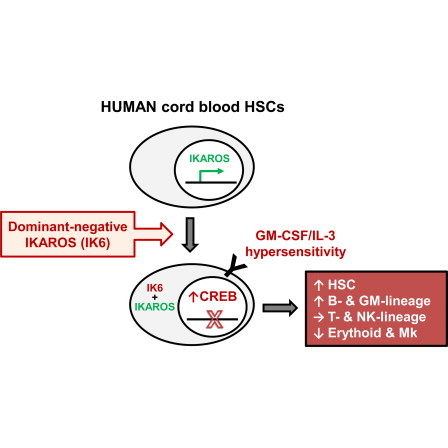
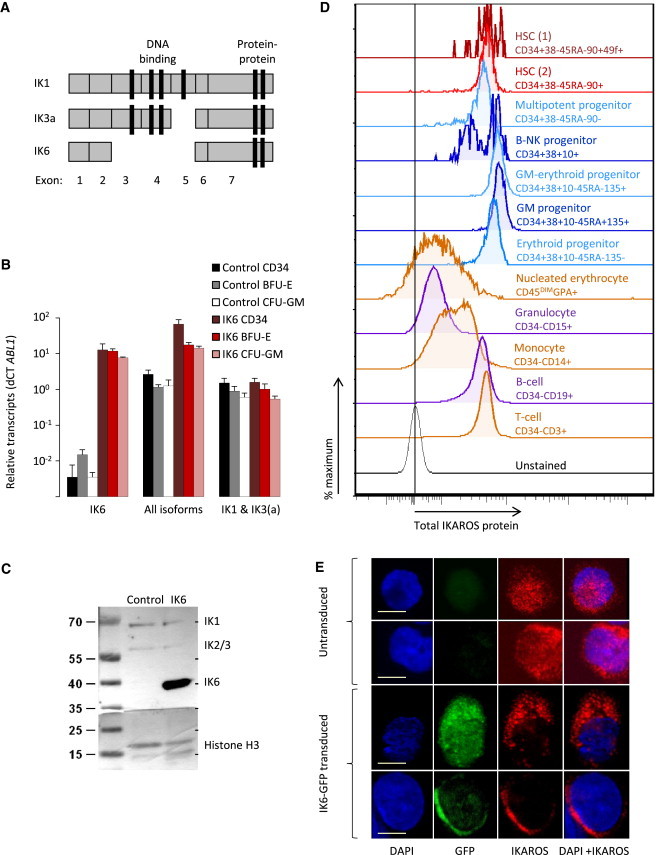
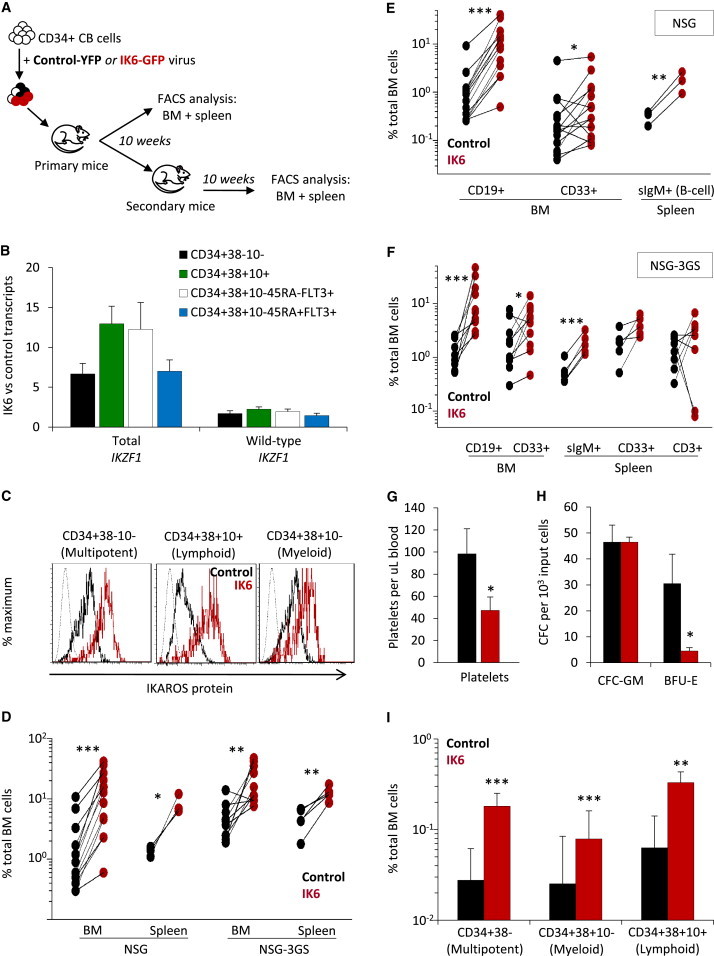
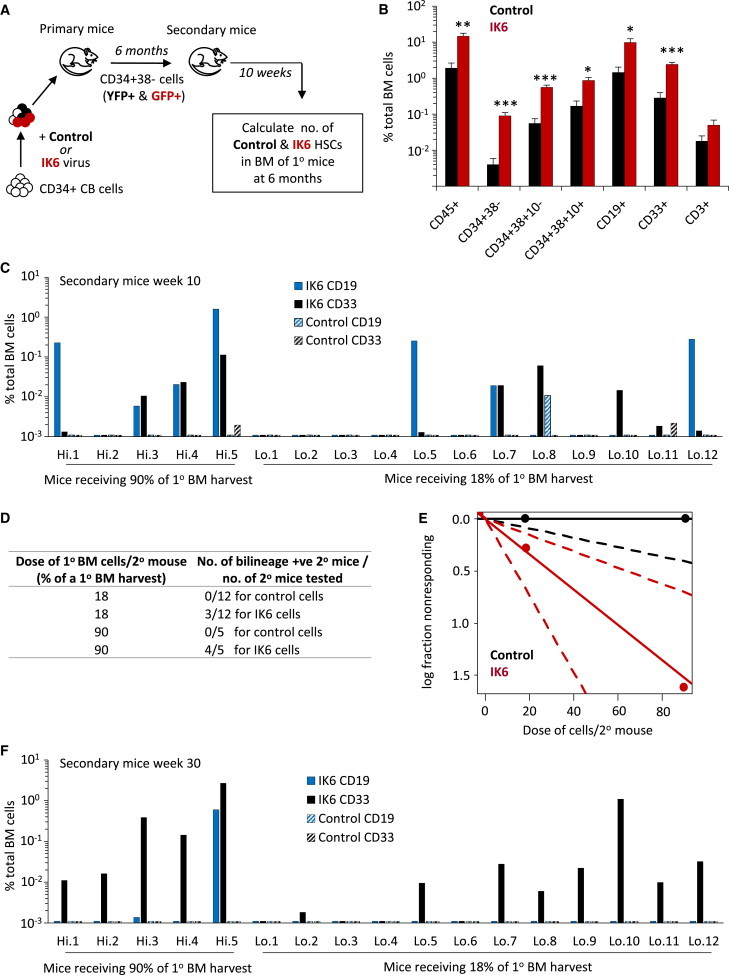
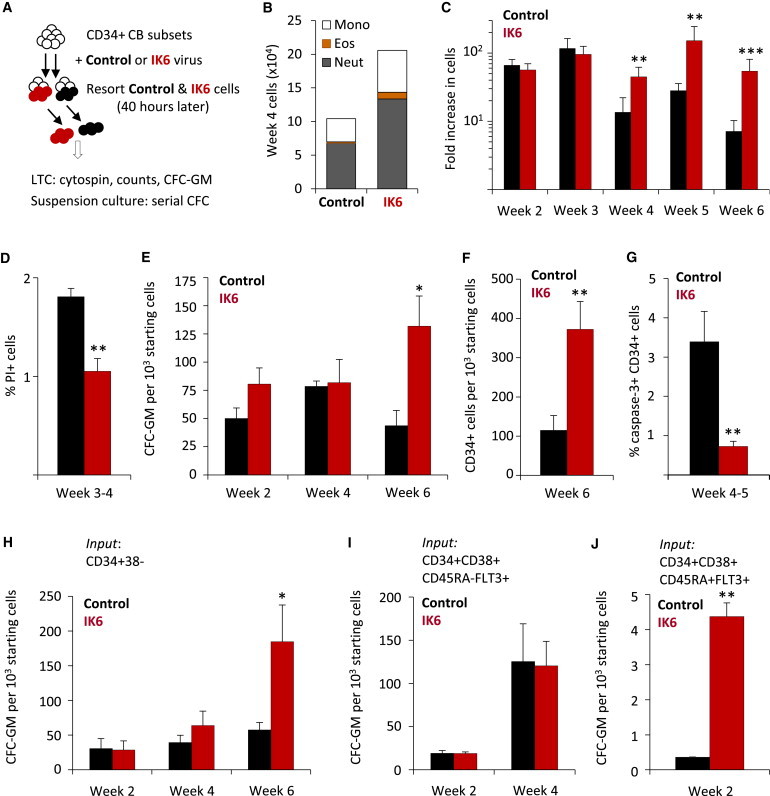
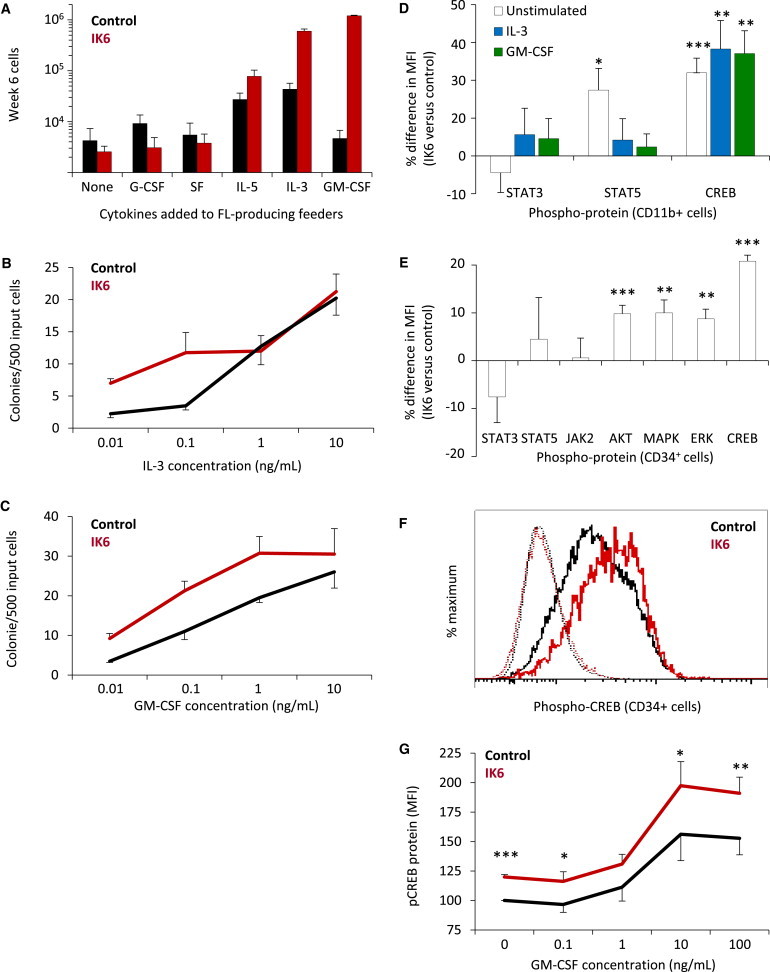
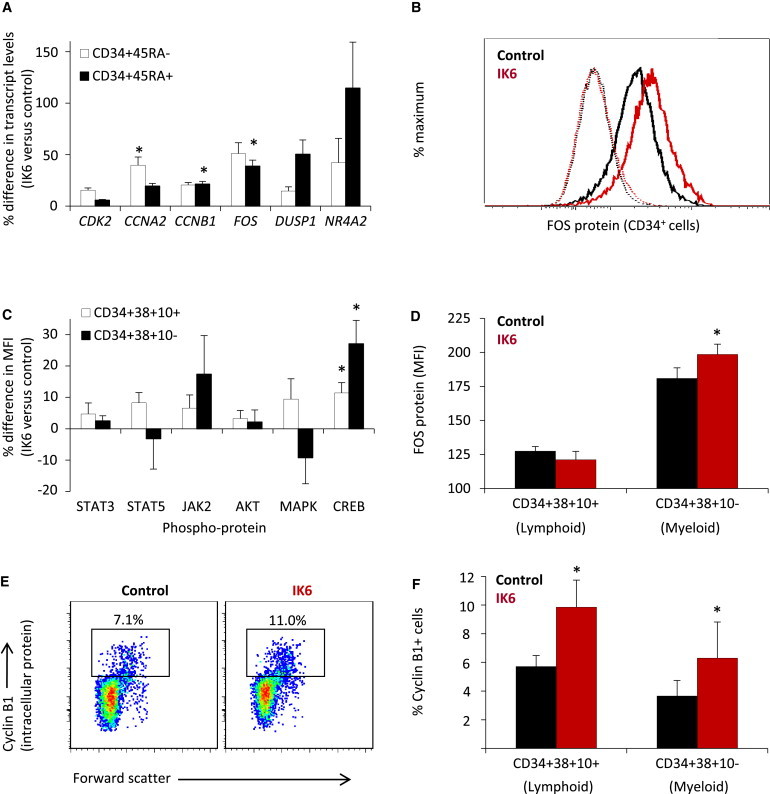
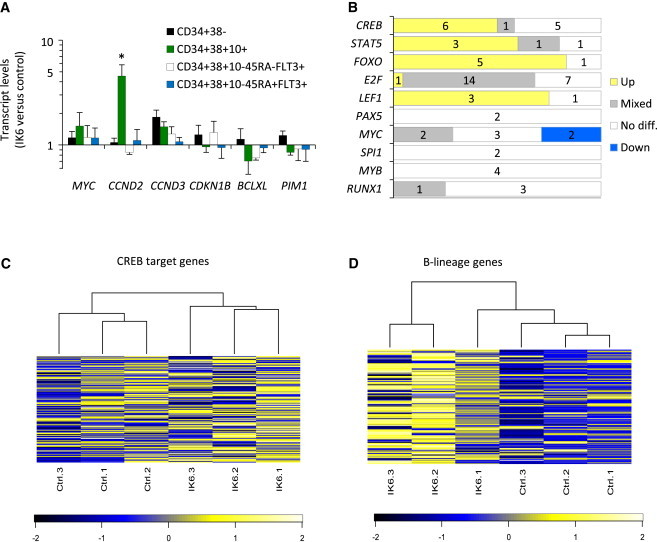
Disrupted IKAROS activity is a recurrent feature of some human leukemias, but effects on normal human hematopoietic cells are largely unknown. Here, we used lentivirally mediated expression of a dominant-negative isoform of IKAROS (IK6) to block normal IKAROS activity in primitive human cord blood cells and their progeny. This produced a marked (10-fold) increase in serially transplantable multipotent IK6(+) cells as well as increased outputs of normally differentiating B cells and granulocytes in transplanted immunodeficient mice, without producing leukemia. Accompanying T/natural killer (NK) cell outputs were unaltered, and erythroid and platelet production was reduced. Mechanistically, IK6 specifically increased human granulopoietic progenitor sensitivity to two growth factors and activated CREB and its targets (c-FOS and Cyclin B1). In more primitive human cells, IK6 prematurely initiated a B cell transcriptional program without affecting the hematopoietic stem cell-associated gene expression profile. Some of these effects were species specific, thus identifying novel roles of IKAROS in regulating normal human hematopoietic cells.


Figures

None
Graphical abstract
Figure 1
Figure 1
IKAROS Expression and Inhibition by IK6 in Human CB Cells (A) Human IKAROS exon structure. (B) Isoform-specific IKZF1 transcripts determined by qRT-PCR in IK6- and control-transduced CD34+ CB cells and their clonally derived erythroid (from BFU-E) and GM progeny (from CFC-GM; mean ± SEM; three experiments). (C) IKAROS protein isoforms in CD34+ CB cells analyzed by western blotting with histone H3 as the loading control. (D) Representative flow cytometric profiles of intracellular IKAROS in normal human CB cell subsets (from one of three experiments). (E) Confocal microscopy images of representative single untransduced or IK6-transduced CD34+ CB cells stained with DAPI (blue) and an antibody reactive with both full-length IKAROS and IK6 (red). Scale bar, 10 μm.
Figure 2
Figure 2
Enhanced Multilineage Repopulating Activity of IK6-Transduced Human CD34+ CB Cells (A) Experimental design. (B) Ratio of ABL1/B2M normalized IKZF1 transcript levels in transduced CD34+ human cell subsets generated in NSG mice (mean ± SEM, four mice). (C) Representative flow cytometric profiles of total IKAROS protein in human cells generated in five NSG mice (dotted line shows unstained control). (D) Paired comparisons of total IK6- and control-derived human CD45+ cells in individual mice transplanted 8–10 weeks previously (24 mice from five cohorts). (E and F) Ten-week posttransplant levels of human CD19+ and surface immunoglobulin M+ (B), CD3+ (T), and CD33+ (GM) cells in the same mice shown in (D). (G) Platelet levels in the blood of NSG mice transplanted 4–10 weeks previously (mean ± SEM; seven mice from two cohorts). (H) Colonies derived from equal numbers of IK6- and control-transduced myeloerythroid progenitors sorted from the BM of NSG mice transplanted 10 weeks previously (mean ± SEM; three mice). (I) Levels of different human CD34+ subsets in the BM of primary NSG mice transplanted 10 weeks previously (mean ± SEM, 14 mice). Progenitor-enriched fractions: multipotent, CD34+CD38; lymphoid, CD34+CD38+CD10+; myeloerythroid, CD34+CD38+CD45RAFLT3+; granulopoietic, CD34+CD38+CD45RA+FLT3+. BFU-E, burst-forming unit-erythroid; CFC-GM, colony-forming cell-GM. p < 0.05; ∗∗p < 0.01; ∗∗∗p < 0.001. See also Figure S2.
Figure 3
Figure 3
IK6 Enhances the In Vivo Expansion of Multipotent Repopulating Human CB Cells (A) Experimental design. (B) Different subsets of IK6- and control-derived human cells in the BM of primary NSG mice 26 weeks posttransplant (mean ± SEM; eight mice). (C) Levels of human CD19+ (B) and CD33+ (GM) cells derived from IK6- and control transduced cells in the BM of individual secondary NSG mice transplanted 10 weeks previously. Limit of detection = 0.0001% based on analyses of ≥106 live cells. (D) Frequency of secondary mice dually repopulated with control- or IK6-transduced human lymphoid and myeloid cells. (E) Plot of data shown in (D), generated using the ELDA algorithm (Hu and Smyth, 2009), showing the natural log fraction of the nonengrafted (nonresponding) mice plotted on a linear scale on the y axis versus the transplant cell dose on the x axis. (F) Levels of human CD19+ (B) and CD33+ (GM) cells derived from control- and IK6-transduced cells in the BM of individual secondary NSG mice transplanted 30 weeks previously. p < 0.05; ∗∗p < 0.01; ∗∗∗p < 0.001.
Figure 4
Figure 4
IK6 Enhances GM Outputs at Multiple Stages of GM Progenitor Differentiation (A) Experimental design. (B) Numbers of mature cell types in the nonadherent fraction of 4-week-old LTCs (200 cells assessed/sample; three experiments). (C) Kinetics of the enhancing effect of IK6 on LTC cell outputs (mean ± SEM; three experiments). (D) Proportion of PI+ nonadherent IK6- and control-transduced cells in 3- to 4-week-old LTCs (mean ± SEM; three experiments). (E) Total CFC-GMs derived from IK6- and control-transduced cells in LTCs (mean ± SEM; three experiments). (F) Total CD34+ cells derived from IK6- and control-transduced cells in 6-week LTCs (mean ± SEM; three experiments). (G) Proportion of cleaved caspase-3+ CD34+ cells derived from IK6- and control-transduced cells in 4- to 5-week LTCs (mean ± SEM; three experiments). (H–J) CFC-GMs in suspension cultures initiated with different subsets of transduced CD34+ CB cells (normalized to 103 input cells; mean ± SEM; three experiments). p < 0.05; ∗∗p < 0.01; ∗∗∗p < 0.001. See also Figure S3.
Figure 5
Figure 5
IK6 Sensitizes Human GM Progenitors to GM-CSF and IL-3 (A) Effect of different human growth factors on 6-week cell outputs from IK6- and control-transduced human cells (mean ± SEM; four replicates each from two experiments). (B and C) IL-3 and GM-CSF dose-response relationships for GM colony formation from IK6- and control-transduced human CD34+ cells (mean ± SEM; two replicates each from two experiments). (D) Differences in levels of intracellular phosphoproteins in IK6- versus control-derived CD3411b+ GM cells stimulated (or not) with GM-CSF or IL-3 (mean ± SEM of MFI ratios; six to eight experiments). (E) Basal levels of intracellular phosphoproteins in IK6- versus control-derived CD34+ cells (mean ± SEM of MFI ratios from six to eight experiments). (F) Representative flow cytometric profiles of phospho-CREB levels (solid lines) in IL-3-stimulated CD34+ cells derived from IK6- and control-transduced cells. Dotted lines show staining in the absence of the phospho-CREB antibody. (G) Phospho-CREB response of CD34+ cells derived from IK6- and control-transduced cells to increasing concentrations of GM-CSF (mean ± SEM for normalized changes in phospho-CREB MFI values, four experiments). MFI, median fluorescence intensity; FL, FLT3-ligand. p < 0.05; ∗∗p < 0.01; ∗∗∗p < 0.001.
Figure 6
Figure 6
IK6 Activates CREB and Its Targets FOS and Cyclin B1 in CD34+ Human CB Cells (A) IK6-stimulated gene expression in subsets of CD34+ cells from 3- to 4-week LTCs (mean ± SEM ratio of normalized transcript levels; seven experiments). (B) Representative flow cytometric profile of intracellular FOS protein levels (solid lines) in CD34+ cells derived from IK6- and control-transduced cells in 3-week LTCs. Dotted lines indicate staining in the absence of anti-FOS antibody. (C) Percentage differences in phosphoprotein levels (MFIs) in different subsets of CD34+ cells generated from IK6- and control-transduced cells cotransplanted into NSG mice (mean ± SEM, four mice). Phospho-ERK was not detected. (D) FOS protein levels in progeny of IK6- and control-transduced cells cotransplanted into NSG mice 10 weeks previously (mean ± SEM, four mice). (E) Representative flow cytometric plots of lymphoid progenitor (CD34+CD38+CD10+) cells from NSG mice cotransplanted 10 weeks previously with IK6- and control-transduced cells and then stained for intracellular Cyclin B1 protein. (F) Percent Cyclin B1+ human cells in NSG mice cotransplanted with IK6- and control-transduced cells 10 weeks previously (mean ± SEM; four mice). MFI, median fluorescent intensity; p < 0.05.
Figure 7
Figure 7
IK6 Activates a B-Lineage Transcriptional Program Prematurely in Human CD34+CD38 Cells (A) Normalized transcript levels in subsets of human cells generated from IK6- versus control-transduced cells in four cotransplanted NSG mice (mean ± SEM). (B) Differential enrichment of genes bearing specific transcription factor binding sites in a comparison of gene expression data from the CD34+CD38 progeny of IK6- and control-transduced cells sorted from transplanted mice. “Up” indicates a positive enrichment. “Down” indicates a negative enrichment. “Mixed” indicates enrichment including both up- and downregulated genes. (C) Unsupervised clustering and heatmap of human CREB target genes (500 genes showing strongest CREB binding in a chromatin immunoprecipitation sequencing study of human cells; Zhang et al., 2005) showing relative expression (Z score) in CD34+CD38 cells. (D) Unsupervised clustering and heatmap of 127 genes whose expression is ≥2-fold higher in normal human CD34+CD38+CD10+ B cell progenitors as compared to normal human CD34+CD38 CB cells (Hystad et al., 2007) showing their relative expression (Z score) in CD34+CD38 cells. p < 0.05.

References

    1. Aghaeepour N., Chattopadhyay P.K., Ganesan A., O’Neill K., Zare H., Jalali A., Hoos H.H., Roederer M., Brinkman R.R. Early immunologic correlates of HIV protection can be identified from computational analysis of complex multivariate T-cell flow cytometry assays. Bioinformatics. 2012;28:1009–1016. - PMC - PubMed
    1. Aghaeepour N., Jalali A., O’Neill K., Chattopadhyay P.K., Roederer M., Hoos H.H., Brinkman R.R. RchyOptimyx: cellular hierarchy optimization for flow cytometry. Cytometry A. 2012;81:1022–1030. - PMC - PubMed
    1. Billerbeck E., Barry W.T., Mu K., Dorner M., Rice C.M., Ploss A. Development of human CD4+FoxP3+ regulatory T cells in human stem cell factor-, granulocyte-macrophage colony-stimulating factor-, and interleukin-3-expressing NOD-SCID IL2Rγ(null) humanized mice. Blood. 2011;117:3076–3086. - PMC - PubMed
    1. Carbonaro D.A., Jin X., Petersen D., Wang X., Dorey F., Kil K.S., Aldrich M., Blackburn M.R., Kellems R.E., Kohn D.B. In vivo transduction by intravenous injection of a lentiviral vector expressing human ADA into neonatal ADA gene knockout mice: a novel form of enzyme replacement therapy for ADA deficiency. Mol. Ther. 2006;13:1110–1120. - PubMed
    1. Challita P.M., Skelton D., el-Khoueiry A., Yu X.J., Weinberg K., Kohn D.B. Multiple modifications incis elements of the long terminal repeat of retroviral vectors lead to increased expression and decreased DNA methylation in embryonic carcinoma cells. J. Virol. 1995;69:748–755. - PMC - PubMed

MeSH terms

Substances

Associated data