. 2015 Dec;54(12):1772-85.
doi: 10.1002/mc.22249. Epub 2014 Nov 21.

PTN signaling: Components and mechanistic insights in human ovarian cancer

Affiliations

PTN signaling: Components and mechanistic insights in human ovarian cancer

Geetika Sethi et al. Mol Carcinog. 2015 Dec.

Abstract

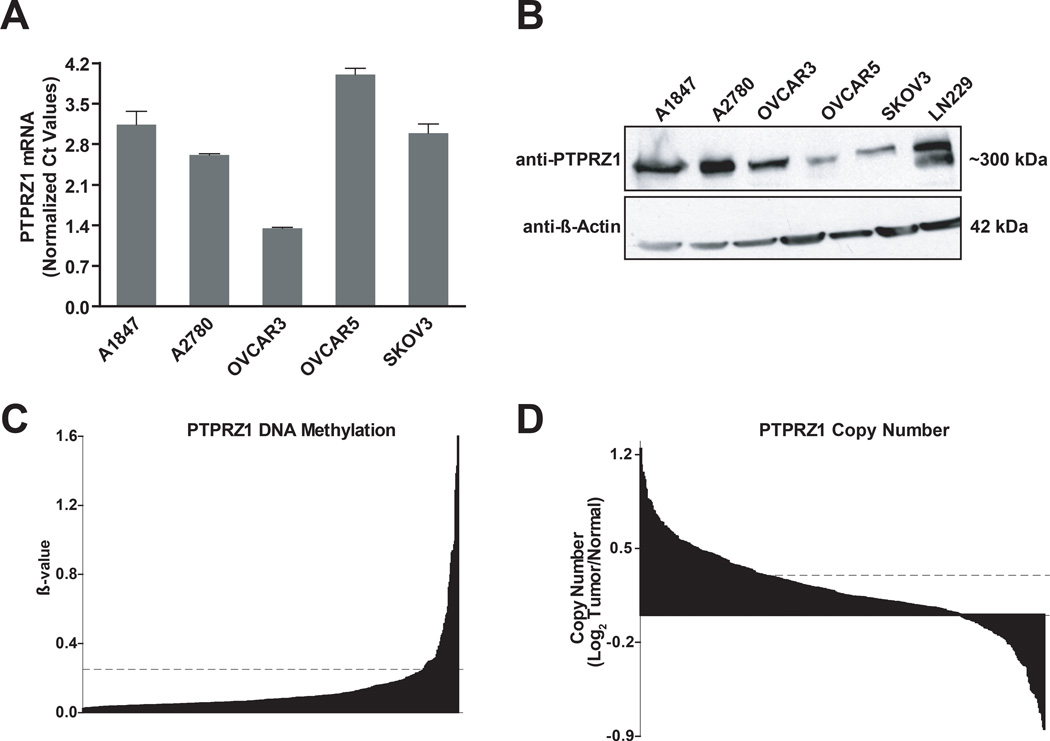
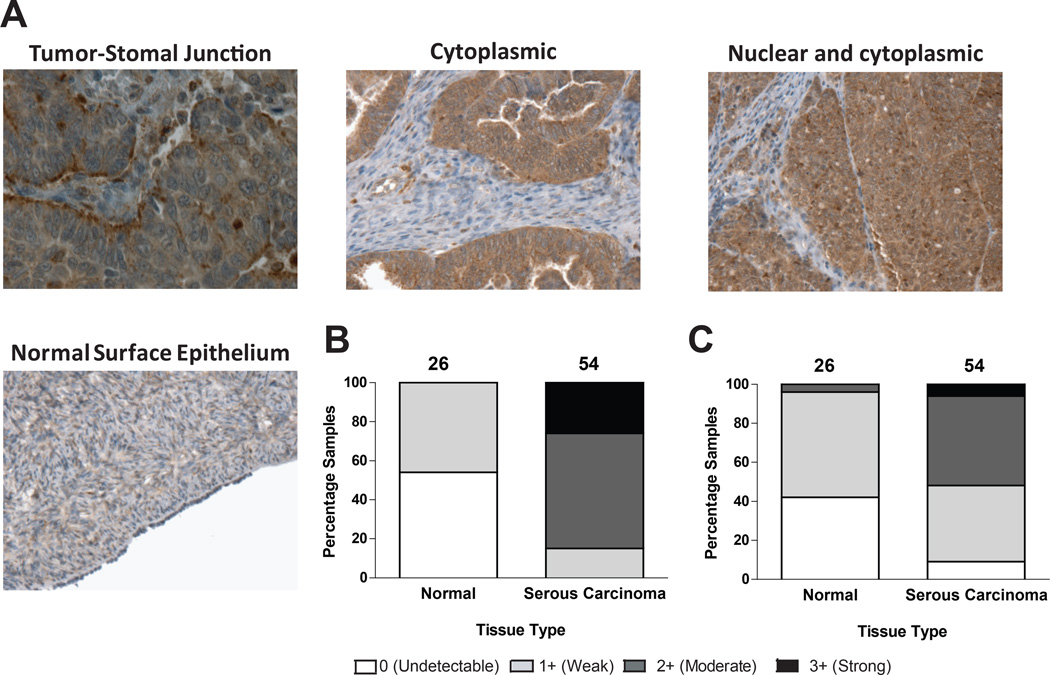
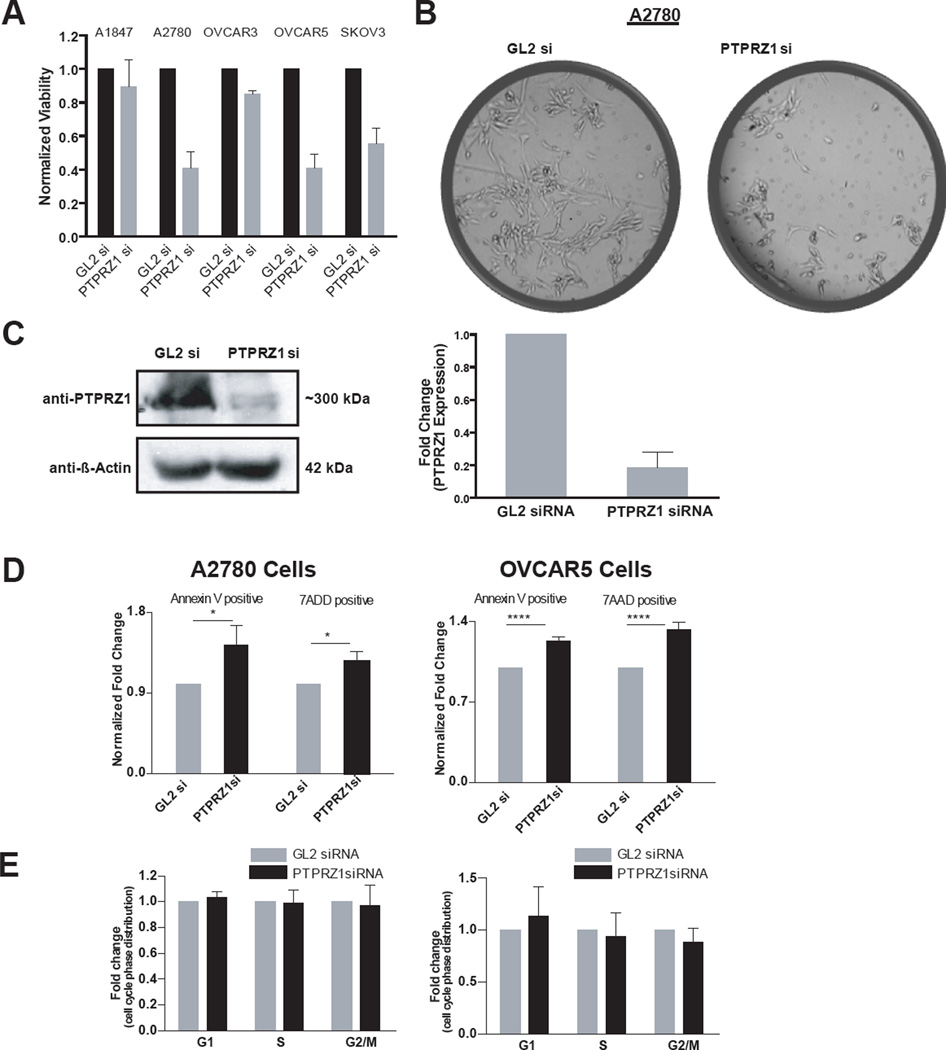
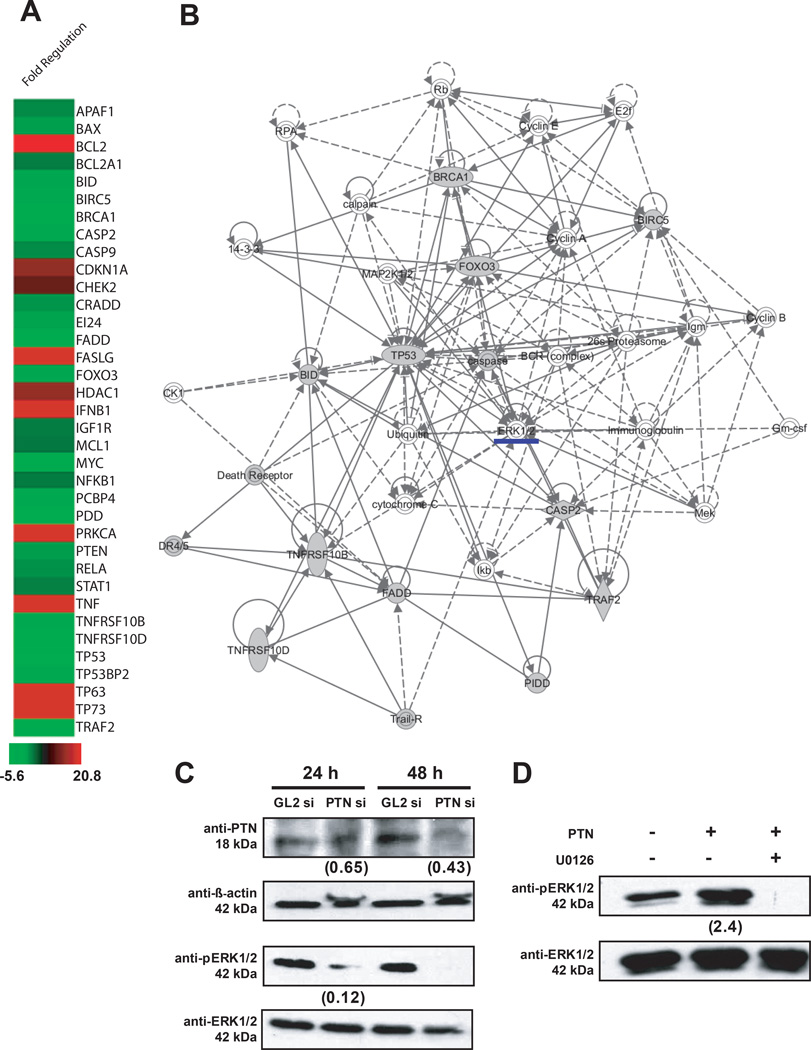
Molecular vulnerabilities represent promising candidates for the development of targeted therapies that hold the promise to overcome the challenges encountered with non-targeted chemotherapy for the treatment of ovarian cancer. Through a synthetic lethality screen, we previously identified pleiotrophin (PTN) as a molecular vulnerability in ovarian cancer and showed that siRNA-mediated PTN knockdown induced apoptotic cell death in epithelial ovarian cancer (EOC) cells. Although, it is well known that PTN elicits its pro-tumorigenic effects through its receptor, protein tyrosine phosphatase receptor Z1 (PTPRZ1), little is known about the potential importance of this pathway in the pathogenesis of ovarian cancer. In this study, we show that PTN is expressed, produced, and secreted in a panel of EOC cell lines. PTN levels in serous ovarian tumor tissues are on average 3.5-fold higher relative to normal tissue and PTN is detectable in serum samples of patients with EOC. PTPRZ1 is also expressed and produced by EOC cells and is found to be up-regulated in serous ovarian tumor tissue relative to normal ovarian surface epithelial tissue (P < 0.05). Gene silencing of PTPRZ1 in EOC cell lines using siRNA-mediated knockdown shows that PTPRZ1 is essential for viability and results in significant apoptosis with no effect on the cell cycle phase distribution. In order to determine how PTN mediates survival, we silenced the gene using siRNA mediated knockdown and performed expression profiling of 36 survival-related genes. Through computational mapping of the differentially expressed genes, members of the MAPK (mitogen-activated protein kinase) family were found to be likely effectors of PTN signaling in EOC cells. Our results provide the first experimental evidence that PTN and its signaling components may be of significance in the pathogenesis of epithelial ovarian cancer and provide a rationale for clinical evaluation of MAPK inhibitors in PTN and/or PTPRZ1 expressing ovarian tumors.

Keywords: MAP kinase signaling; PTPRZ1 (protein tyrosine phosphatase receptor Z1); epithelial ovarian cancer (EOC); pleiotrophin (PTN); survival.


Conflict of interest statement

CONFLICT OF INTEREST – The authors declare that no conflicts of interest exist.

Figures

Figure 1
Figure 1. PTN expression across different EOC cell lines and primary tissues
A) Bar graph representing relative levels of PTN mRNA transcript across EOC cell lines assessed by qRT-PCR and normalized to PPIA mRNA levels. Mean normalized gene expression values are shown (n = 2, ± SD). B) Immunoblotting result of cell lysates prepared from EOC cell lines probed with polyclonal anti-PTN. Recombinant human PTN (15 ng, R&D Systems) was used as a positive control. C) Relative levels of secreted PTN measured using ELISA in the conditioned media (48 h) obtained from EOC cell lines and media (n = 4, ± SD), and the positive control cell line LN229. D) Immunoblot analysis of cell lysates prepared from five high grade serous ovarian tumor tissue samples (lanes T1, T2, T3, T4 and T5) and two normal ovarian tissue samples (lanes N1 and N2) probed with polyclonal anti-PTN. Recombinant human PTN (15 ng) was used as a positive control. Quantification of the immunoblot using AlphaView software ver. 3.3 (Cell Biosciences) is shown as a bar graph and represents fold-change of PTN expression in each tumor sample relative to the mean of the normal tissues. An asterisk indicates that the tumor tissue that showed a 2-fold or more increase in PTN levels as compared to normal tissues.
Figure 2
Figure 2. PTPRZ1 expression in EOC cell lines and evaluation of DNA methylation and copy number of PTPRZ1 in ovarian serous adenocarcinoma
A) Bar graph represents relative levels of PTPRZ1 mRNA transcript across EOC cell lines assessed by qRT-PCR and normalized to PPIA mRNA levels. Mean normalized gene expression values are shown (n=2, ±SD). B) Immunoblot analysis of cell lysates prepared from EOC cell lines probed with monoclonal anti-PTPRZ1. A cellular lysate from the LN229 cell line was used as a positive control. C) Shown is the β-values (mean of 2 probes) for DNA methylation status for PTPRZ1 gene in 494 TCGA samples. The dotted line at y = 0.25 indicates hypomethylation of PTPRZ1. D) Plotted are the copy number values (log2 tumor/normal ratio) of PTPRZ1 across the 494 TCGA samples. The dotted line at y = 0.3 indicates copy number gain at a threshold of log2 0.3.
Figure 3
Figure 3. PTPRZ1 expression across normal ovarian surface epithelium and ovarian tumor specimens
A) Immunohistochemical analysis of PTPRZ1 expression was performed on ovarian TMAs containing normal ovarian tissue (26 samples) and tumor specimens (54 serous adenocarcinomas). Panel A, top left core is an example of a tumor tissue core exhibiting membranous staining at the tumor-stromal junction. Panel A, middle core is an example of a tumor tissue core showing cytoplasmic expression. Panel A, top right core is an example of a tumor tissue core exhibiting both cytoplasmic and nuclear expression. Normal surface epithelium is shown in the bottom left core. B) Bar graphs represent percentage of normal and tumor samples exhibiting different levels of expression of PTPRZ1 in the cytoplasm. C) Bar graphs represents percentage of normal and tumor samples exhibiting different levels of PTPRZ1 expression in the nucleus. The intensity of PTPRZ1 staining was scored using light microscopy as follows: 0 (undetected), 1 (weak), 2 (moderate) or 3 (strong). The number above each bar indicates the total number of samples evaluated in the respective category.
Figure 4
Figure 4. Effect of PTPRZ1 knockdown on EOC cell proliferation
A) The average normalized viability scores (n = 2, ± SD) following gene silencing using PTPRZ1 siRNAs evaluated in the five EOC cell lines are shown. B) Representative phase contrast images of A2780 cells treated with GL2 siRNA and PTPRZ1 siRNA. C) Left, Immunoblotting was performed following GL2 siRNA and PTPRZ1 siRNA treatment to determine the level of knockdown of PTPRZ1 in A2780 cells (n = 2, ± SD). Right, immunoblots were quantified using AlphaView software, version 3.3 (Cell Biosciences). D) A2780 and OVCAR5 cells were transfected with PTPRZ1 or GL2 siRNAs. Seventy-two hours post-transfection, cells were harvested and processed for analysis of apoptosis. Cells were stained for annexin V and 7-AAD (7-aminoactinomycin) using Guava Nexin reagent (contains both the stains) followed by enumeration using a Guava flow cytometer (Millipore). The fold-change in annexin V positive cells and 7-AAD positive cells is shown (mean ± SD, n = 3, **** p-value<0.0001, *p-value<0.01). E) A2780 and OVCAR5 cells were transfected with PTPRZ1 or GL2 siRNAs. Seventy-two hours post-transfection, cells were harvested and processed for analysis of cell cycle progression. Cells were stained using Guava Cell Cycle reagent (propidium iodide) followed by enumeration using a Guava flow cytometer (Millipore). The fraction of cells in each phase of the cell cycle was measured by propidium iodide staining followed by enumeration using the Guava instrument. The percentage of cells in each cell cycle phase after PTPRZ1 siRNA and GL2 siRNA treatment (72 h) is shown (mean ± SD, n = 3).
Figure 5
Figure 5. ERK1/2 mediates PTN signaling in EOC cells
A) Heat map shows the fold-change in gene expression in A2780 cells treated with PTN siRNA (48 h) as compared to the GL2 siRNA treated cells. Red represents increased expression (up-regulation); black represents mean expression; and green represents lower expression (down-regulation). All expression values (fold-change) fall within [−5.68 to 20.8]. B) Shown is the network with the highest score as generated using IPA. Fifteen genes (shaded nodes) for which expression levels were decreased by 1.5-fold or more in PTN siRNA treated cells relative to GL2 siRNA treated A2780 cells were mapped and functional interactions between gene products based on IPA knowledge are described. ERK1/2 (underlined) was identified as one of the signaling effectors (non-shaded nodes). C) Shown is the immunoblotting result of cell lysates from GL2 siRNA and PTN siRNA treatment at 24 h and 48 h subjected to electrophoresis and probed with polyclonal anti-PTN, anti-pERK1/2, anti-total ERK1/2 and β-actin. Numbers denote the average (at least 2 independent experiments) fold-change of the ratio of PTN:β-actin and pERK1/2:ERK1/2 normalized to respective negative controls (lane1 and lane 3). D) Shown is the immunoblotting result to evaluate effect of PTN (100 ng/mL) on activation of ERK1/2 in A2780 cells in the presence or absence of ERK inhibitor, UO126 (30 µM, 2 h). Lysates were subjected to electrophoresis and probed with anti-pERK1/2, and anti-total ERK1/2. Numbers denote the average (at least 2 independent experiments) fold-change of the ratio of PTN:β-actin and pERK1/2:ERK1/2 normalized to respective negative controls (lane1).

References

    1. Siegel R, Naishadham D, Jemal A. Cancer statistics, 2013. CA: A Cancer Journal for Clinicians. 2013;63(1):11–30. - PubMed
    1. Modugno F, Ness RB, Wheeler JE. Reproductive risk factors for epithelial ovarian cancer according to histologic type and invasiveness. Ann Epidemiol. 2001;11(8):568–574. - PubMed
    1. Morch LS, et al. Hormone therapy and different ovarian cancers: a national cohort study. Am J Epidemiol. 2012;175(12):1234–1242. - PubMed
    1. McCluggage WG. Morphological subtypes of ovarian carcinoma: a review with emphasis on new developments and pathogenesis. Pathology. 2011;43(5):420–432. - PubMed
    1. Ren H, et al. Identification of anaplastic lymphoma kinase as a potential therapeutic target in ovarian cancer. Cancer Res. 2012;72(13):3312–3323. - PubMed

Publication types

MeSH terms