

Special Education Services Received by Students with Autism Spectrum Disorders from Preschool through High School
- PMID: 25419002
- PMCID: PMC4235523
- DOI: 10.1177/0022466913483576
Special Education Services Received by Students with Autism Spectrum Disorders from Preschool through High School
Abstract
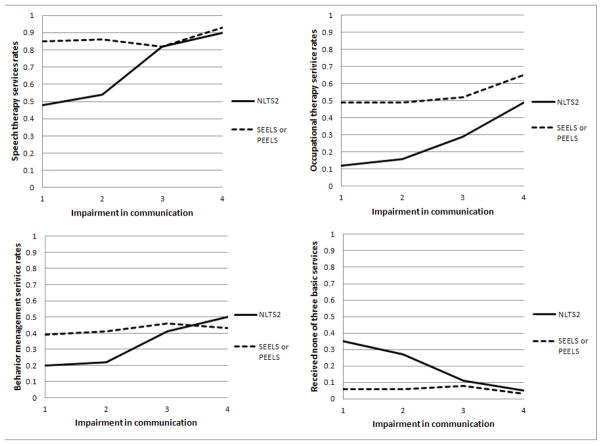
Little is known about how special education services received by students with Autism Spectrum Disorders (ASDs) differ by age, disability severity, and demographic characteristics. Using three national datasets, the Pre-Elementary Education Longitudinal Study (PEELS), the Special Education Elementary Longitudinal Study (SEELS), and the National Longitudinal Transition Study-2 (NLTS2), this study examined the age trends in special education services received by students with ASDs from preschool through high school. Elementary-school students with ASDs had higher odds of receiving adaptive physical education, specialized computer software or hardware, and special transportation, but lower odds of receiving learning strategies/study skills support than their preschool peers. Secondary-school students had lower odds of receiving speech/language or occupational therapy and of having a behavior management program, but higher odds of receiving mental health or social work services than their elementary-school peers. Both disability severity and demographic characteristics were associated with differences in special education service receipt rates.
Keywords: age; autism; demographic characteristics; disability severity; service; special education.
Figures
References
-
- Carlson E, Posner D, Lee H. Pre-Elementary Education Longitudinal Study Restricted-Use Data Set for Waves 1, 2, 3, 4, and 5: User’s Guide. Washington, DC: U.S. Department of Education: National Center for Special Education Research; 2010.
-
- Centers for Disease Control and Prevention. Prevalence of autism spectrum disorders —Autism and developmental disabilities monitoring network, 14 sites, United States, 2008. MMWR. 2012;61(SS-03):1–19. - PubMed
Grants and funding
LinkOut - more resources
Full Text Sources
Other Literature Sources