

Technology-enhanced Interactive Teaching of Marginal, Joint and Conditional Probabilities: The Special Case of Bivariate Normal Distribution
- PMID: 25419016
- PMCID: PMC4238889
- DOI: 10.1111/test.12012
Technology-enhanced Interactive Teaching of Marginal, Joint and Conditional Probabilities: The Special Case of Bivariate Normal Distribution
Abstract
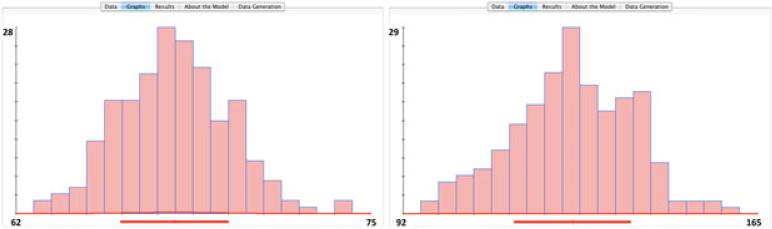
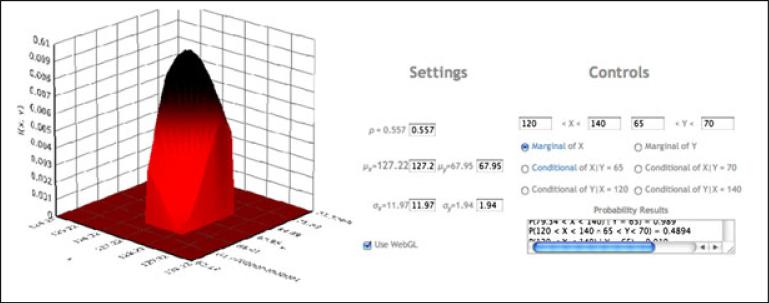
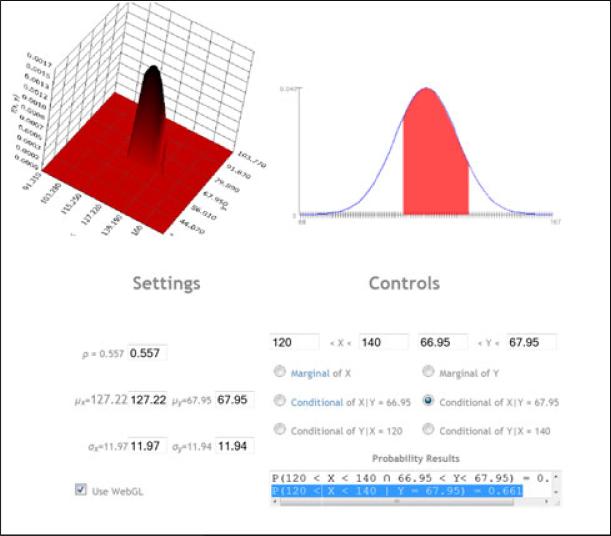
Data analysis requires subtle probability reasoning to answer questions like What is the chance of event A occurring, given that event B was observed? This generic question arises in discussions of many intriguing scientific questions such as What is the probability that an adolescent weighs between 120 and 140 pounds given that they are of average height? and What is the probability of (monetary) inflation exceeding 4% and housing price index below 110? To address such problems, learning some applied, theoretical or cross-disciplinary probability concepts is necessary. Teaching such courses can be improved by utilizing modern information technology resources. Students' understanding of multivariate distributions, conditional probabilities, correlation and causation can be significantly strengthened by employing interactive web-based science educational resources. Independent of the type of a probability course (e.g. majors, minors or service probability course, rigorous measure-theoretic, applied or statistics course) student motivation, learning experiences and knowledge retention may be enhanced by blending modern technological tools within the classical conceptual pedagogical models. We have designed, implemented and disseminated a portable open-source web-application for teaching multivariate distributions, marginal, joint and conditional probabilities using the special case of bivariate Normal distribution. A real adolescent height and weight dataset is used to demonstrate the classroom utilization of the new web-application to address problems of parameter estimation, univariate and multivariate inference.
Keywords: blended instruction; science education; statistics education; teaching; technology-enhanced; webapp.
Figures


References
-
- Algozzine B, Bateman LR, et al. Developing technology competencies in a college of education. Current Issues in Education. 2011;2(0):1–12.
-
- Ayalew L, Kasahara M, et al. The spatial correlation between earthquakes and landslides in Hokkaido (Japan), a GIS-based analysis of the past and the future. Landslides. 2011;8:1–16.
-
- Billingsley P. Probability and Measure. Wiley; 2012.
-
- Castillo E, Galambos J. Conditional distributions and the bivariate normal distribution. Metrika. 1989;36(1):209–214.
Grants and funding
LinkOut - more resources
Full Text Sources
Other Literature Sources