. 2014 Dec;20(12):1427-35.
doi: 10.1038/nm.3735. Epub 2014 Nov 24.

Chronic enrichment of hepatic endoplasmic reticulum-mitochondria contact leads to mitochondrial dysfunction in obesity

Affiliations

Chronic enrichment of hepatic endoplasmic reticulum-mitochondria contact leads to mitochondrial dysfunction in obesity

Ana Paula Arruda et al. Nat Med. 2014 Dec.

Abstract

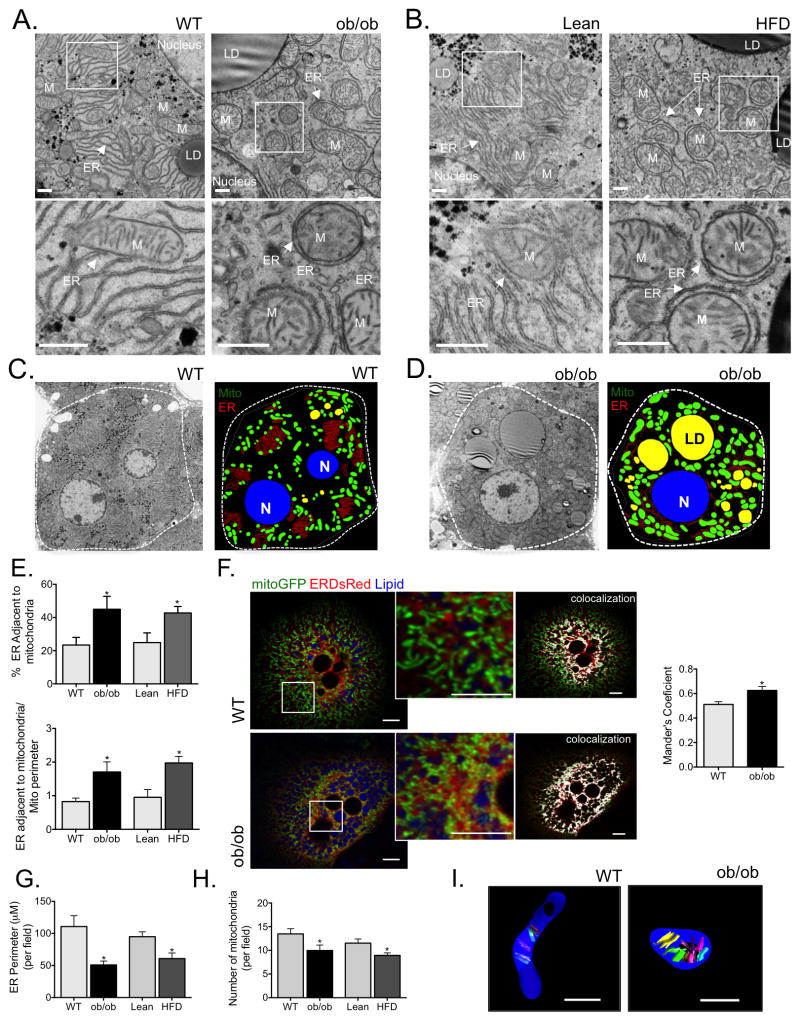
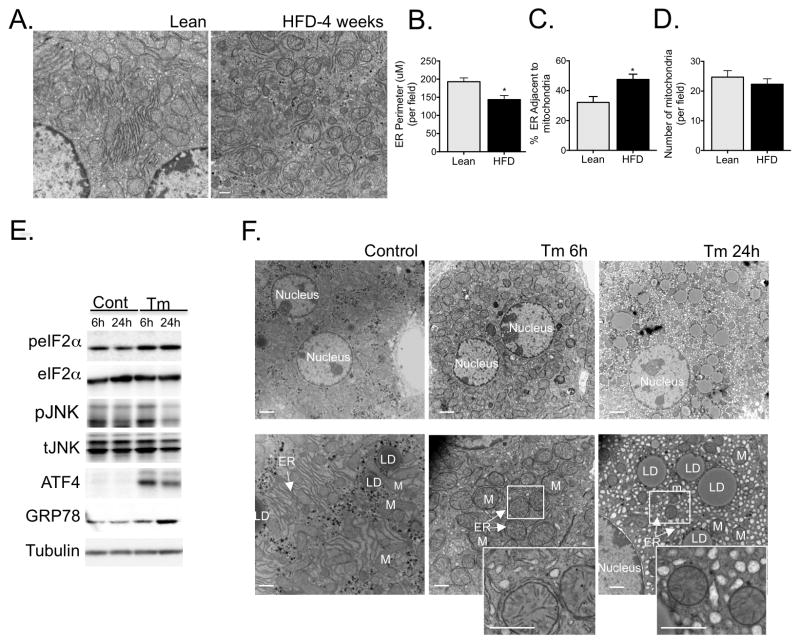
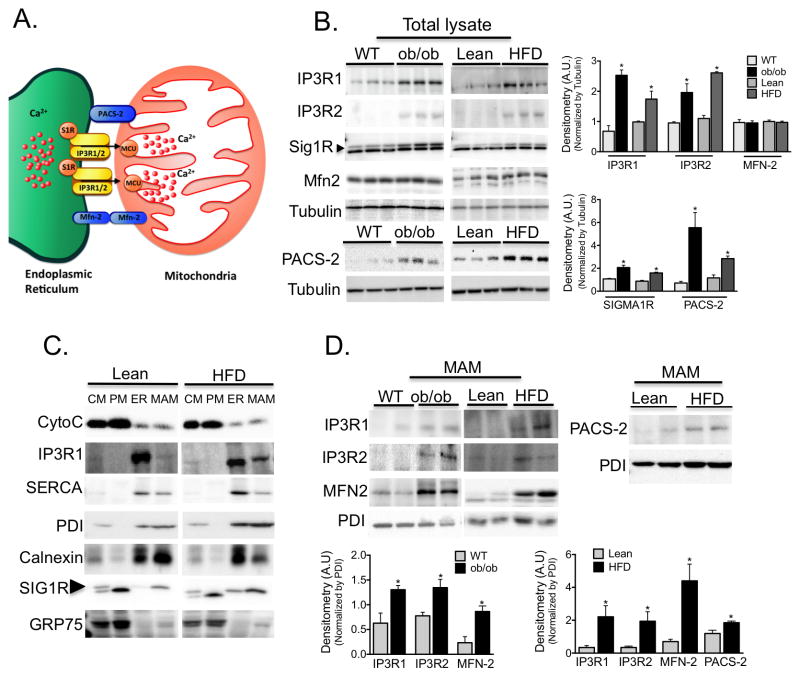
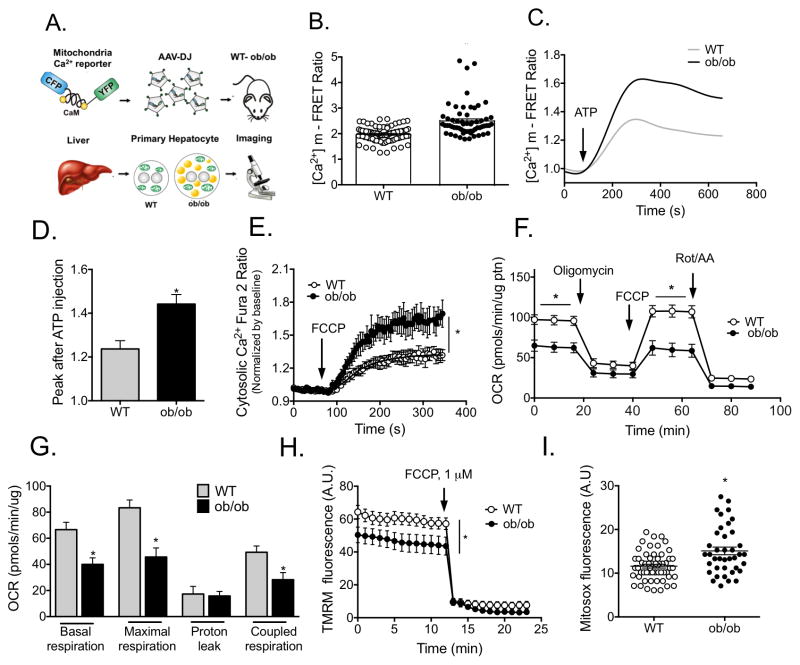
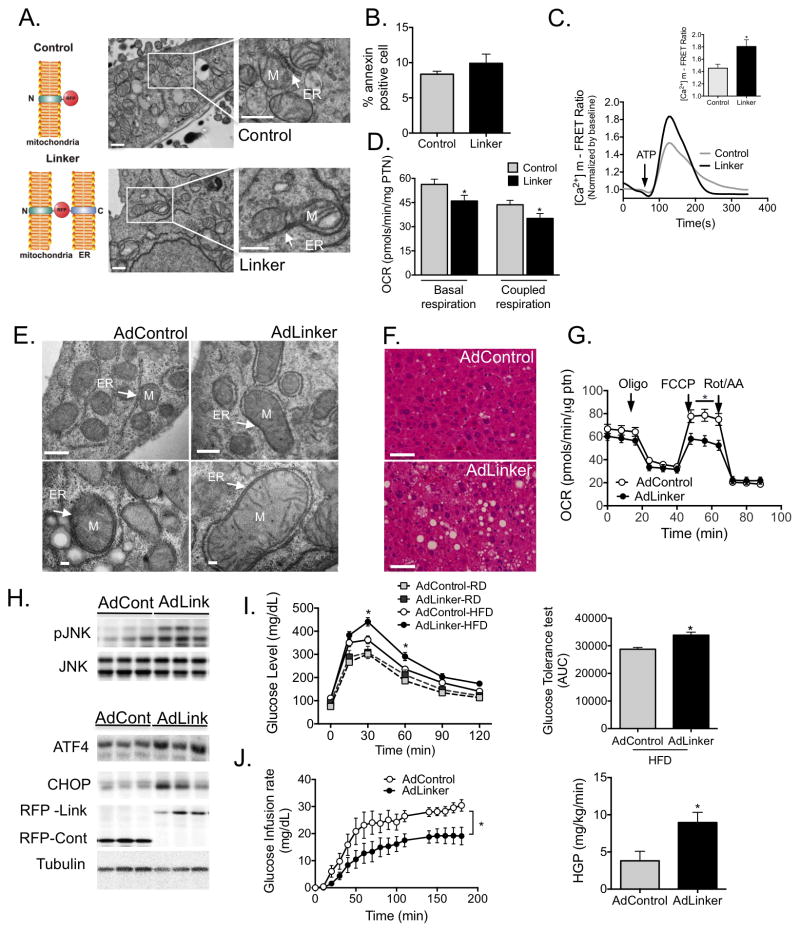
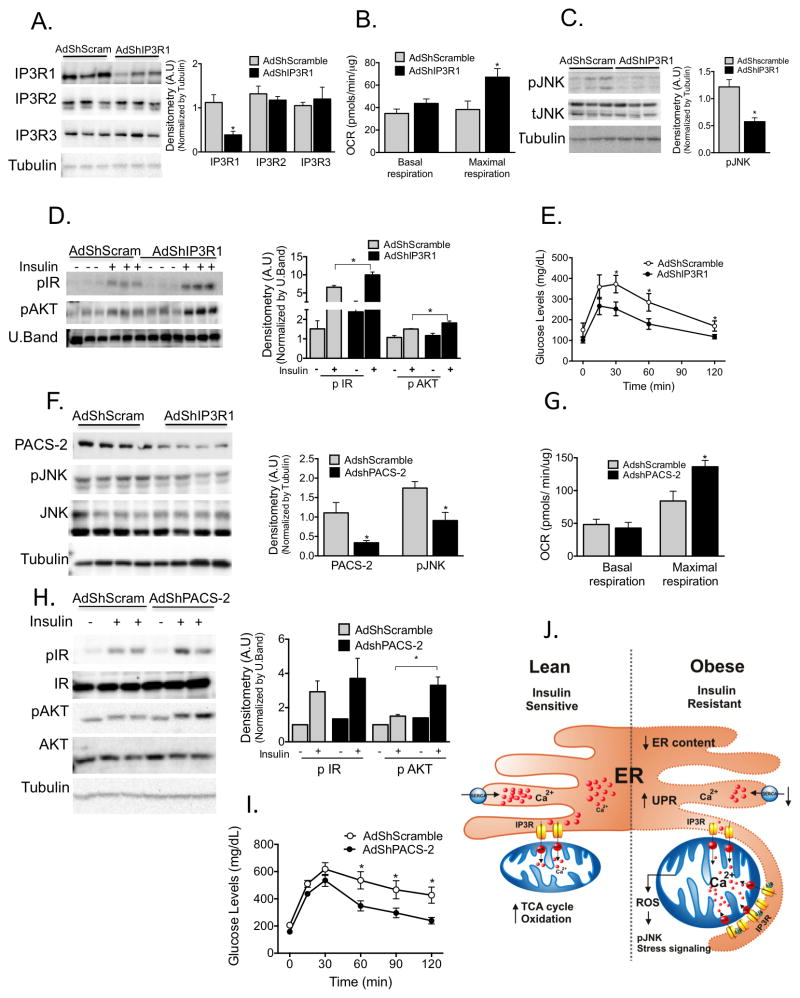
Proper function of the endoplasmic reticulum (ER) and mitochondria is crucial for cellular homeostasis, and dysfunction at either site has been linked to pathophysiological states, including metabolic diseases. Although the ER and mitochondria play distinct cellular roles, these organelles also form physical interactions with each other at sites defined as mitochondria-associated ER membranes (MAMs), which are essential for calcium, lipid and metabolite exchange. Here we show that in the liver, obesity leads to a marked reorganization of MAMs resulting in mitochondrial calcium overload, compromised mitochondrial oxidative capacity and augmented oxidative stress. Experimental induction of ER-mitochondria interactions results in oxidative stress and impaired metabolic homeostasis, whereas downregulation of PACS-2 or IP3R1, proteins important for ER-mitochondria tethering or calcium transport, respectively, improves mitochondrial oxidative capacity and glucose metabolism in obese animals. These findings establish excessive ER-mitochondrial coupling as an essential component of organelle dysfunction in obesity that may contribute to the development of metabolic pathologies such as insulin resistance and diabetes.


Figures

Figure 1
Figure 1. Obesity induces increased MAM formation and changes in ER and mitochondrial morphology in the liver
(A&B) Representative transmission electron microscopy (TEM) of liver sections derived from wild type and leptin-deficient (wt and ob/ob, 8–10 weeks of age, A) or lean and obese (16 weeks of high fat diet, HFD, B) mice at 6800x, scale bar 500nm. ER (endoplasmic reticulum), M (mitochondria), N (nucleus), LD (lipid droplet). (C&D) TEM images were analyzed using iMOD to delineate major cellular structures at 1400x. (E) Quantitation of ER length adjacent to mitochondria normalized by total ER length and by mitochondrial perimeter. (F) Confocal images of primary hepatocytes isolated from lean (wt) and obese (ob/ob) mice co-expressing a mitochondria-targeted GFP (mito-GFP), an ER-targeted DsRed (ER-DsRed) and stained with a lipid droplet specific dye (monodansylpentane). (F) Statistical quantification of the overlapping area (Manders’ coefficient) between Mito-GFP and ER-DsRed, n=10 (wt) n=11 (ob/ob) from 4 independent experiments. (G) Quantitation of ER perimeter and (H) number of mitochondria. The morphometric analysis of the TEM pictures were calculated from average of 50 pictures (10 pictures per animal) in each experimental group (from 5 different animals per group). (I) 3D reconstruction of serial TEM sections obtained from independent samples taken at 11000x of single mitochondria, scale bar: 500nm. All the graphs represent mean ± SEM, *P < 0.05, Student’s t-test.
Figure 2
Figure 2. ER structural and functional changes in response to acute stress
(A) Representative TEMs of liver sections from wild type mice following 4 week challenge with regular chow or HFD. (B) Quantitation of ER perimeter (C) ER length adjacent to mitochondria normalized by total ER length (D) Number of mitochondria. The morphometric analysis were calculated from average of 18 pictures (~ 5 pictures per animal) in each experimental group (from 3 different animals per group) using Image J. (E) Evaluation of cell stress signaling activation in liver following 6 or 24 hours of tunicamycin (TM) exposure by western blot. (F) Representative TEMs of liver sections from wild type mice following 6 of 24 hours of TM treatment. Scale bar: 2um (upper panel) and 500nm (lower panel), n=3. The graphs represent mean ± SEM, *P < 0.05, Student’s t-test.
Figure 3
Figure 3. Regulation of MAM enriched proteins in obesity
(A) Schematic illustration of functional and structural MAM proteins. (B) Western blot and image J based quantification analysis of indicated proteins in liver total lysates from wt/ob/ob and lean/HFD-fed (16 weeks) mice. Arrow indicates the specific Sig1R band, n=3 representative of 2–3 independent experiments. (C) Western blot analysis of indicated proteins of subcellular fractions from mouse livers. CM: crude mitochondria. PM: Pure mitochondria, ER: endoplasmic reticulum and MAM: mitochondria associated ER membranes. Cytochrome C (Cyto C) was used as a mitochondrial marker; IP3R and SERCA were found mostly in the bulk ER. PDI and Calnexin were equally distributed between ER and MAM, and Sigma 1 receptor (Sig1R) enrichment served as a known MAM marker. This figure is representative of at least 5 different preparations (D) Western blot and quantification analysis of indicated proteins in MAMs from wt/ob/ob and lean/HFD mice, n=3. PDI served as a loading control. All the graphs represent mean ± SEM, *P < 0.05, Student’s t-test.
Figure 4
Figure 4. Obesity alters mitochondrial calcium flux liver
(A) Schematic depicting the details of the experimental procedure used to measure mitochondrial Ca2+ levels in primary hepatocytes. (B) Mitochondrial Ca2+ content in primary hepatocytes from wt and ob/ob mice measured by FRET of 4mtD3cpv, n= 81 (wt) or 60 (ob/ob) cells, 4 independent experiments. (C) Representative trace of [Ca2+]m upon 100uM ATP stimulation. (D) Quantification of the Ca2+ peak after ATP stimulation, n=15 cells, 4 independent experiments. (E) Cytosolic Ca2+ measured with 4μM of Fura 2-AM after 1μM FCCP treatment, n=60 (wt) or 40 (ob/ob) cells, 3 independent experiments. (F–G) Oxygen consumption rate (OCR) of primary hepatocytes from lean and ob/ob mice in basal assay medium (basal respiration), in the presence of 2μM olygomicin, (ATPsynthase inhibitor), 1μM FCCP (uncoupling agent) and 2μM Rotenone (Rot) and 2μM antimycin (AA) (complex I and III inhibitors, respectively). Maximal respiration, proton leak and coupled respiration were determined as described in methods section, n=11 (wt) n=13 (ob/ob) plates, 7 independent preparations. (H) Mitochondrial membrane potential in isolated hepatocytes from wild type and ob/ob mice, n=23 (Wt), n=15 (ob/ob), representative of 3 independent experiments (I) ROS production measured with 3μM mitosox loading. n=57 (wt) and 39 (ob/ob) cells from 3 independent experiments. All the graphs represent mean ± SEM, *P < 0.05, Student’s t-test.
Figure 5
Figure 5. Experimental induction ER-mitochondria interactions increases mitochondrial calcium flux and impairs glucose homeostasis
(A) Schematic illustrating the mitochondrial-ER synthetic linker. The construct encodes a monomeric red fluorescent protein (RFP) fused to the OMM targeting sequence of mAKAP1 at the N terminus and the ER targeting sequence of yUBC6 at the C terminus with a length of ≈25 nm. Representative TEM of Hepa 1-6 cells expressing control (upper panel) and linker plasmids (bottom panel) at 9300x, scale bar: 500nm. (B) FACS analysis of Annexin V positivity in control and linker-expressing cells, n=3. (C) Representative trace of mitochondrial Ca2+ dynamics in single Hepa 1-6 cells expressing the control or linker construct, measured by FRET of 4mtD3cpv following treatment with ATP (100μM). (C inset) Quantification of the peak in Ca2+ after ATP stimulation, 3 independent experiments. (D) Measurement of oxygen consumption rate (OCR) in control and linker-expressing Hepa 1-6 cells in the presence of 2μM Oligomycin, 0.4 μM FCCP and 2μM Rotenone (Rot) and 2μM antimycin (AA). n=15 from 4 independent experiments. (E) Representative TEMs of liver sections from lean mice expressing the control or linker construct, scale bar: 500nm upper panel and 100nm bottom panel (F) Liver sections from HFD-fed mice expressing control or linker constructs, stained with hematoxylin and eosin, scale bar 50um. (G) OCR of primary hepatocytes from HFD-fed mice expressing control or linker constructs, n =10, from 3 independent preparations. (H) Western blot and quantification analysis of indicated proteins in liver lysates from HFD-fed mice expressing control or linker constructs. (I) Glucose tolerance test (GTT) and area under the curve of mice expressing control or linker constructs, n=6 (Ad control-RD, Adlinker-RD and Adcontrol-HFD) n=7 (Adlinker-HFD). (J) Glucose infusion rate and Hepatic glucose production during hyperinsulinemic-euglycemic clamp in HFD-fed mice expressing control or linker constructs, n= 8 for Adcontrol and 11 for Adlinkers. All data are mean +/− SEM, *P <0.05 (two-way ANOVA for panel M or Student’s t-test for the others).
Figure 6
Figure 6. Experimental suppression of MAM function or formation alters mitochondrial calcium flux and improves glucose homeostasis
(A) Western blot and quantification analysis demonstrating specific knockdown of IP3R1 in liver lysates following adenoviral shRNA transduction, n= 3, representative of 2 independent experiments. (B) Oxygen consumption rate of primary hepatocytes from mice expressing control or shIP3R1, n=6. (C) Western blot and quantification analysis showing reduced JNK phosphorylation in liver lysates following IP3R1 knockdown. (D) Western blot and quantification analysis of the insulin-action in the liver samples following expression of shScramble or shIP3R1. n=3. (E) Glucose tolerance test in mice expressing shScramble or shIP3R1, n=7. (F) Western blot and quantification analysis demonstrating specific knockdown of PACS-2 in liver lysates following adenoviral shRNA transduction, n=4 representative of 2 independent experiments. (G) Oxygen consumption rate of primary hepatocytes from mice expressing control or shPACS-2, n=5 for shscramble and n=8 for shPACS-2. (H) Western blot and quantification analysis of the insulin-action in the liver samples following expression of shScramble or shPACS-2, n=3. (I) Glucose tolerance test in mice expressing shScramble or shPACS-2, n=7 for shScramble and 9 for shPACS-2. (J) We propose here that an early development in the course of obesity-induced metabolic disease is increased MAM formation in the liver. Increased MAM formation drives higher calcium transfer from ER (via IP3R1) to the mitochondria, leading to calcium overload, which in turn leads to impairment in mitochondrial oxidative capacity, increased ROS generation, cellular stress, impaired insulin action in the liver and abnormal glucose metabolism. All data are mean +/− SEM, *P <0.05, Student’s t-test for the others.

References

    1. Flegal KM, Carroll MD, Ogden CL, Curtin LR. Prevalence and trends in obesity among US adults, 1999–2008. JAMA: the journal of the American Medical Association. 2010;303:235–241. - PubMed
    1. Hotamisligil GS. Inflammation and metabolic disorders. Nature. 2006;444:860–867. - PubMed
    1. Hotamisligil GS. Endoplasmic reticulum stress and the inflammatory basis of metabolic disease. Cell. 2010;140:900–917. - PMC - PubMed
    1. Lowell BB, Shulman GI. Mitochondrial dysfunction and type 2 diabetes. Science. 2005;307:384–387. - PubMed
    1. Fu S, et al. Aberrant lipid metabolism disrupts calcium homeostasis causing liver endoplasmic reticulum stress in obesity. Nature. 2011;473:528–531. - PMC - PubMed

Publication types

MeSH terms